
Sample Category Title
Trade Idea: GBP/JPY – Buy at 149.50
GBP/JPY - 150.95
Original strategy:
Buy at 149.95, Target: 151.95, Stop: 149.35
Position: -
Target: -
Stop: -
New strategy :
Buy at 149.50, Target: 151.50, Stop: 148.90
Position: -
Target: -
Stop:-
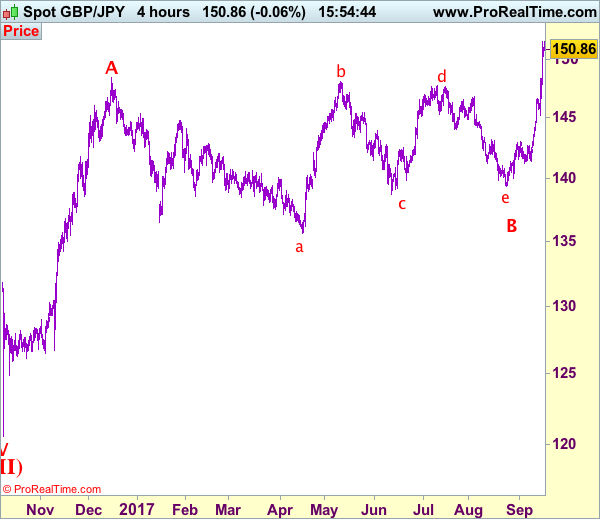
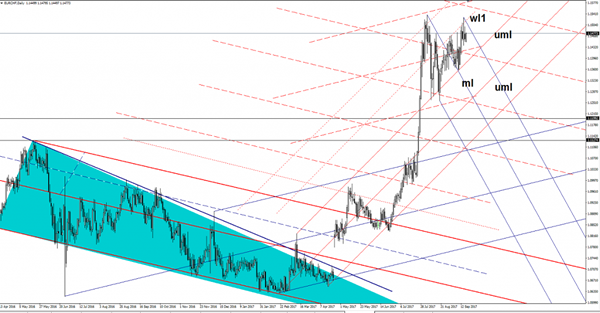
As sterling has retreated after faltering below last week’s high at 151.55, suggesting further consolidation below this level would be seen and pullback to 150.00-10 cannot be ruled out, however, reckon downside would be limited to 149.40-50 and bring another rise later, above said resistance at 151.55 would extend recent upmove to 152.00, then 153.00, however, near term overbought condition should limit upside to 154.00-10 and price should falter below 155.00. Our latest preferred count is that triangle wave B correction ended at 139.35 (the final e leg of triangle), hence wave C has commenced and may extend further gain to 153.00 and later 154.00.
In view of this, we are still looking to buy sterling on pullback as 149.50 should limit downside. Below 149.00 would risk correction to 148.50 but still reckon downside would be limited to previous resistance at 148.35 and 147.75-80 should hold, bring another upmove later.
Our preferred count is that larger degree wave V with circle is unfolding from 251.12 with wave (I) 219.34, (II): 241.38 and wave (III) is subdivided into 1: 192.60, 2: 215.89 (23 Jul 2008) and wave 3 ended at 118.87 earlier in 2009. The correction from there to 162.60 is wave 4 which itself is a double three and is labeled as first a-b-c ended at 151.53, followed by wave x at 139.03, 2nd a ended at 162.60, 2nd b at 146.75 and 2nd c leg of wave 4 ended at 163.00. Therefore, the decline from 163.00 to 116.85 is now treated as wave 5 which also marked the end of larger degree wave (III), hence wave (IV) major correction has commenced for retracement of the wave (III) from 241.38 and upside target at 183.95-00 (50% Fibonacci retracement of the wave (II) from 241.38) had been met, a drop below 160.00 would suggest wave (IV) has ended at 195.85, bring decline in wave (V) for initial weakness to 130 (already met) and 120.
Brent Oil Loses Momentum
Brent Oil moves higher within the ascending channel and should hit new highs in the upcoming period. Technically is showing some exhaustion signs, but nothing significant. The Friday's failure to reach the 56.06 previous high has signaled that a minor drop could come. Price could decrease a little to retest the downside line of the minor ascending channel before will jump towards the $57.00 per barrel.
EUR/JPY Breakout In Play
EUR/JPY is trying to breakout from the confluence area formed at the intersection between the median line (ml) with the second warning line (descending dotted line) of the minor descending pitchfork.
A valid breakout through the mentioned confluence area will accelerate the upside movement. Price has finally escaped from the minor ascending channel between the sliding lines (SL), signaling a further increase.
USD/JPY Bulls In Control
The USD/JPY has opened with a gap up signaling that the bulls are in full control. Price is approaching a major dynamic resistance, but a breakout is favored as the Yen is demolished by the Nikkei's bullish movement.
The Japanese currency drops versus all its rivals on the short term, this could continue as the JP225 continues the upside movement. The Nikkei is pressuring a major horizontal resistance, a valid breakout above the 20058 static resistance will confirm a further increase and a Yen's further depreciation.
Only another false breakout above the 20058 horizontal resistance will signal another leg lower and a Yen's dominance. The Japanese banks are closed in observance of Respect-for-the-Aged Day.
The pair is driven by the technical factors, remains to see what will happen after the United States data will be released, but I don't think that will have any significant impact.
The USD/JPY is trading in the green and is almost to hit the third warning line (WL3) of the descending pitchfork. Personally, I believe that if will touch it will break it because, a valid breakout will signal a further increase in the upcoming period.
Continues to move in range on the short term, so we'll have a clear direction once will breakout from this range.
I've drawn a minor ascending pitchfork hoping that I'll catch another leg higher, the rate could be attracted by the median line (ml) of this pitchfork. Temporary resistance could be found at the 38.2% retracement level as well.
A failure to reach the median line (ml) will signal a minor drop towards the lower median line (lml).
EUR/CHF Reversal?
EUR/CHF has posted significant gains in the morning and tries to stay higher after the failure to reach and retest the 1.1536 previous high. I’ve drawn a minor descending pitchfork hoping that I’ll catch a potential downside movement. A retest of the upper median line (uml) of the minor descending pitchfork followed by a minor decrease will confirm a significant drop.
AUD/USD On The Run
Price has rallied after the retest of the lower median line (lml) of the minor ascending pitchfork. Technically, the perspective remains bullish as long as is trapped within the minor ascending pitchfork's body.
I've drawn a minor descending pitchfork, a retest of the upper median line (uml) could signal a potential reversal. It could develop a Rising Wedge pattern, which could signal a reversal, a major drop will be confirmed after a valid breakdown below the median line (ML).
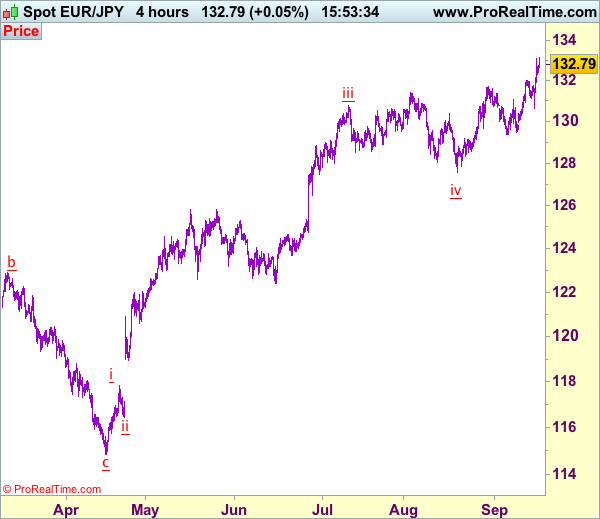
Trade Idea: EUR/JPY – Buy at 132.00
EUR/JPY - 132.80
Original strategy:
Buy at 132.20, Target: 134.20, Stop: 131.60
Position: -
Target: -
Stop: -
New strategy :
Buy at 132.00, Target: 134.00, Stop: 131.40
Position: -
Target: -
Stop:-
Although the single currency rose briefly above last week’s high of 133.09, lack of follow through buying and current retreat from 133.12 suggest consolidation below this level would be seen and initial downside risk is for pullback to 132.40-50, however, reckon downside would be limited to 132.01 (previous resistance turned support) and bring another rise later, above 133.12 would extend recent upmove to 133.50-60 but near term overbought condition should prevent sharp move beyond 134.00-10 and reckon 134.50-60 would hold from here, risk from there has increased for a retreat later.
In view of this, we are looking to reinstate long on pullback as previous resistance at 132.01 (should turn into support) and bring another rise later. Below 131.60-70 would defer and risk retreat to 131.00-10 but said support at 130.62 should remain intact, bring another rise later.
Our latest preferred count is that wave (ii) is ABC-X-ABC which ended at 123.33 and wave (iii) is unfolding with wave iii ended at 100.77, followed by wave iv at 111.57 and wave v as well as the wave (iii) has ended at 97.04, followed by wave (iv) at 111.43 and wave (v) has ended at 94.12 which is also the end of the larger degree v, this also implied the major wave (C) has also ended there, hence major correction has commenced from there with (A) leg unfolding in its lower degree wave c which has possibly ended at 145.69. Under this count, A-B-C wave (B) has commenced with A leg ended at 136.23, wave B at 143.79 and wave C has possibly ended at 149.79.
Our larger degree count is that the decline from 139.26 is wave (C) and is sub-divided into a diagonal triangle i-ii-iii-iv-v with wave i - 105.44, wave ii- 123.33, wave iii - 97.03, wave iv - 111.43, followed by the final wave v as well as the end of wave (C) at 94.12, this also mark the bottom of larger degree wave B. Under this count, major rise in wave C has commenced as an impulsive wave with minor wave III ended at 145.69, wave V is still in progress for further gain to 150.00. Having said that, this so-called wave V could well be the first leg of larger degree 5-waver wave C and this wave C should bring at least a retest of wave A top at 169.97 (July 2008).
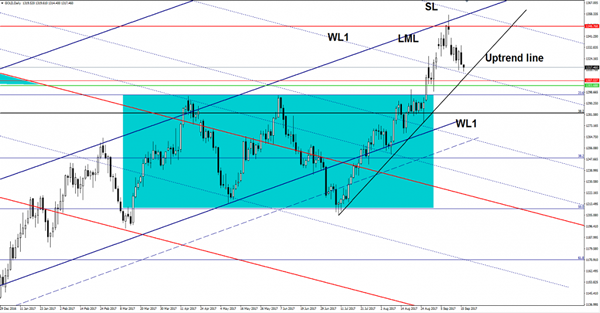
Gold Near Important Confluence
The Gold price has dropped further on the short term and could resume the minor retreat if the USDX will have enough energy to climb higher in the upcoming period. Price is trading right below the $1320 per ounce, but is almost to reach an important confluence. The minor corrective phase was expected, but this could end up soon if the USD will slide further versus its rivals.
Right now is very important to see what will happen on the USDX, which has managed to breakout above a dynamic resistance. The dollar index has come down to retest it and now is somehow expected to climb much higher.
Gold dropped in the morning, even if the NZD/USD and the AUD/USD have rallied aggressively. Personally, I’m expecting the Aussie and Kiwi to drop again versus the greenback because the pairs are located right below some important resistance levels.
Price has dropped further and is almost to reach the warning line (WL1) of the descending pitchfork, most likely will be attracted by the confluence area formed at the intersection between the uptrend line with the warning line (WL1). Remains to see how will react when will touch the mentioned confluence, a breakdown will accelerate the sell-off.
However, a rejection from this confluence will signal an increase at least till will reach the $1348 per ounce (horizontal resistance) and the lower median line (LML).
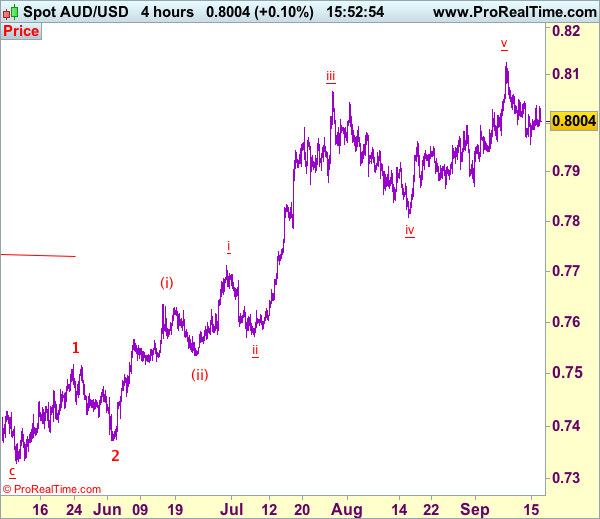
Trade Idea: AUD/USD – Sell at 0.8080
AUD/USD – 0.8003
Original strategy:
Sell at 0.8090, Target: 0.7900, Stop: 0.8150
Position: -
Target: -
Stop:-
New strategy :
Sell at 0.8080, Target: 0.7900, Stop: 0.8140
Position: -
Target: -
Stop:-
Although aussie found support at 0.7956 last week and rebounded, if our view that temporary top has been formed at 0.8125 is correct, upside would be limited to 0.8080-90 and bring another decline, below , below said support at 0.7956 would add credence to this view, bring retracement of recent rise to 0.7920-25 and later 0.7890-00 but support at 0.7867-71 should remain intact.
In view of this, we are looking to sell aussie on recovery as 0.8090-00 should limit upside. Above said resistance at 0.8125 would (this month’s high) would extend recent upmove in wave v of (iii) to 0.8150, then towards 0.8200, however, loss of upward momentum should prevent sharp move beyond 0.8225-30 and price should falter below 0.8250-60, risk from there is seen for a retreat later.
On the 4-hour chart, the move from 0.8066 is the wave 5 with i: 0.8860, ii: 0.8315, wave iii is an extended move ended at 1.0183, iv: 0.9706 and wave v has ended at 1.1081 (also the top of entire wave 5). The subsequent selloff is the major correction which is unfolding as ABC-X-ABC and 2nd A leg has ended at 0.8848, followed by a-b-c wave B which ended at 0.9758, hence, 2nd C wave is now in progress and indicated downside target at 0.7000 and 0.6950 had been met, so further fall to 0.6710-20 cannot be ruled out.
Japanese Markets Closed For A Public Holiday On Monday, Focus On Fed’s Sept 19-20 Policy Meeting
Dollar Firmer vs Yen, Trades Near Friday's 7-Week High. The dollar held firm near a seven-week high versus the yen on Monday, supported by recent rises in U.S. Treasury yields. The greenback edged up 0.3 percent to 111.17 yen, trading within sight of Friday's peak at 111.33 yen, its highest level since late July.
Sterling Steady, Takes Breather After Last Week's Rally. Sterling was firm after having rallied sharply on Friday, sterling rose past the $1.36 level for the first time since the Brexit vote, after comments from BoE policymaker Gertjan Vlieghe echoed the central bank's signal that the first rate increase in a decade could happen in 'coming months'.
Potential Demand Surge Pushes Oil Prices Up. Crude oil prices rising sharply in anticipation of a rise in global demand with Brent prices hitting a five month high.
Watch Out Today For:
09:00 am GMT: EUR Consumer Price Index