Sample Category Title
NZDUSD Consolidates After Recent Bounce Above 0.72 But Downside Risk Remains
NZDUSD is consolidating between 0.7200 and 0.7340. The bounce from the August 31 low of 0.7131 lost steam and failed to rise above what has been a key resistance level at 0.7340. The intra-day risk is to the downside as the Tenkan-sen line has crossed below the Kijun-sen line on the 4-hour chart. RSI is in bearish territory after dipping below 50 but downside momentum has weakened as the oscillator is now flat. The Ichimoku-cloud analysis on the 4-hour chart shows the market is still above the cloud which is expected to provide support in the near term. Price action is essential sideways since the beginning of this week above the key 0.7200 level. Breaking below this support would increase downside pressure to open the way to the August 31 low of 0.7131. Such a move would place a short-term top at the September 8 high of 0.7337 and strengthen the longer-term downtrend that started from the 0.7557 July peak. NZDUSD would need to regain the 0.73-handle to ease downside pressure. Breaching 0.7337 resistance (September 8 high) would shift focus to the upside to target 0.7390. From here the odds increase for a move to re-test the 0.7557 peak. The market maintains its underlying trend to the downside on the longer run timeframe. For now, the bounce from 0.7131 could be seen as a corrective move unless there is a sustained rise above 0.7340.
Firmly On Hold, But A Slightly More Hawkish Tone?
Today, the main event will be the Bank of England policy decision. As always, besides the rate decision, we will also get the minutes of the meeting. The consensus is for the Bank to keep its policy unchanged via a 7-2 vote. At its latest gathering, the Bank signaled little urgency for a rate hike in the next months, while it revised lower its inflation and economic growth forecasts. We think that the focus of this meeting will be initially on the vote count and subsequently, on what signals policymakers send regarding the likelihood of a near-term hike.
A few months ago, Governor Carney noted that a hike may depend mainly on firming wages and improving business investment. Given that business investment for Q2 was stagnant and that wages failed to accelerate in July, we doubt that an actual rate hike is looming. However, we have to note that the latest CPI data showed both the headline and the core inflation rates surging by more than anticipated in August, pushing the implied probability for a hike this year to 48%, according to the UK OIS. As such, even though we don’t expect an actual hike, we would not rule out the possibility of a slightly more hawkish narrative by the BoE, or even a 3rd policymaker voting for a hike. Bearing these in mind, we view the risks surrounding GBP today as being tilted to the upside. Any optimistic signals regarding a hike in coming months could add further fuel to the pound’s recent rally.
EUR/GBP traded in a consolidative manner yesterday, staying between the support of 0.8985 (S1) and the resistance of 0.9035 (R1). Having said that, given that the rate continues to trade below the short-term downtrend line taken from the peak of the 29th or August, we consider the short-term outlook to be negative. If indeed the BoE sounds more hawkish than previously today, or if we see another member joining those voting for a hike, the pair could break below 0.8985 (S1) and perhaps aim for our next support of 0.8920 (S2). On the other hand, softer language could be the trigger for a rebound. Nevertheless, as long as such a rebound remains limited below the aforementioned downtrend line, we would treat it as a corrective move and as a renewed opportunity for the bears to take charge at better levels.
USD continues to recover on the prospect of bipartisan tax reform
Yesterday, US President Trump met with leaders of the Democratic Party to discuss tax reform. Later, both sides stated that the talks were “constructive”. Meanwhile, House Speaker Paul Ryan said that the outline of a tax plan would be unveiled as soon as the 25th of September. Both the dollar and US stock indices jumped on the news, possibly because investors interpreted these developments as raising the odds of tax changes actually materializing sooner rather than later.
Today, we get the nation’s CPI data for August. The forecast is for the headline rate to have ticked up and for the core rate to have ticked down. We view the risks surrounding the core forecast as likely being tilted to the upside, given that the Markit services PMI for the month showed output charges rising at a 35-month high. If our view is correct, this could ease somewhat the concerns of FOMC policymakers regarding subdued inflation, and perhaps revive market expectations for another rate hike this year. At the time of writing, the probability for another hike by year-end is 45% according to the Fed funds futures.
A potential positive surprise in inflation could lift that percentage notably and thereby, help the dollar to recover even further.
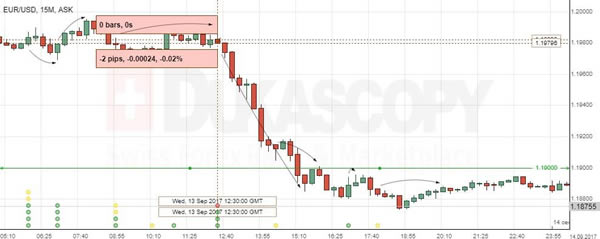
EUR/USD tumbled on Wednesday, following the encouraging tax talks. The pair fell after it hit resistance at 1.2000 (R2) to break below the 1.1930 (R1) barrier. At the time of writing, the pair is testing the 1.1870 (S1) line, where a dip could bring into play the crossroads of the 1.1830 (S2) key support and the medium-term uptrend line taken from the low of the 17th of April. However, as long as the pair continues to trade above that critical territory, we believe that there is still the likelihood for a rebound. We would like to see a clear close below the aforementioned crossroads before we turn our gaze to the downside. This could happen if we see a positive surprise in US inflation today.
As for the rest of today’s highlights:
In Switzerland, the SNB will announce its rate decision as well and the forecast is for this Bank to take no action too. Policymakers could repeat the usual mantra – that the franc remains significantly overvalued and that the Bank will remain active in the FX market as necessary. Thus, if any reaction in CHF today, it may be lower.
We have just one speaker on the agenda: ECB Governing Council member Jens Weidman.
EUR/GBP
Support: 0.8985 (S1), 0.8920 (S2), 0.8890 (S3)
Resistance: 0.9035 (R1), 0.9070 (R2), 0.9120 (R3)
EUR/USD
Support: 1.1870 (S1), 1.1830 (S2), 1.1775 (S3)
Resistance: 1.1930 (R1), 1.2000 (R2), 1.2100 (R3)
Daily Technical Analysis: EURUSD, GBPUSD, USDJPY, USDCHF
EURUSD
The EURUSD had a bearish momentum yesterday bottomed at 1.1873 as a part of the bearish correction phase after printed a bearish pin bar on Friday as you can see on my daily chart below. The bias is bearish in nearest term testing 1.1823 key support which is a good place to buy. Immediate resistance is seen around 1.1925. A clear break above that area could lead price to neutral zone in nearest term testing 1.2000 region. Overall I remain bullish but a clear break and daily close below 1.1823 key support could trigger further bearish correction scenario testing 1.1700 – 1.1600 support area. On the upside, we need a clear break at least above 1.2000 to continue the bullish scenario targeting 1.2175 region.
GBPUSD
The GBPUSD failed to continue its bullish momentum yesterday bottomed at 1.3184. Price is still moving above the EMA 200 as you can see on my H1 chart below suggests a valid bullish trend, but we may have a false breakout (above 1.3265) bearish scenario here, at least in short-term time frame. The bias is bearish in nearest term testing 1.3160 – 1.3082 support area. Immediate resistance is seen around 1.3265. A clear break and daily close above that area would keep the H1 chart bullish bias remain strong testing 1.3350 – 1.3400 area before targeting 1.3500 region
USDJPY
The USDJPY continued its bullish momentum yesterday topped at 110.68 and hit 110.73 earlier today in Asian session. The bias remains bullish in nearest term testing 111.00 key resistance. Immediate support is seen around 109.85. A clear break below that area could lead price to neutral zone in nearest term testing 109.25 or lower. The 4H chart technical bias remains bearish but a clear break and daily close above 111.000 key resistance would change the 4H chart bias to a neutral condition. Overall I remain neutral.
USDCHF
The USDCHF continued its bullish momentum yesterday topped at 0.9660. The bias remains bullish in nearest term testing 0.9700 area. Immediate support is seen around 0.9585 area. A clear break below that area could lead price to neutral zone in nearest term testing 0.9525 region but key support remains at 0.9450 area. On the upside, a clear break and daily close above 0.9700 would expose 0.9765 – 0.9807 key resistance which is a good place to sell with a tight stop loss.
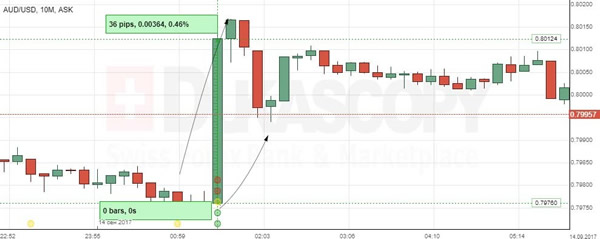
Technical Outlook: AUDUSD Was Boosted By Solid Jobs Numbers But Recovery Needs Break Above 0.8030 For Confirmation
Positive jobs data from Australia (upbeat employment change showed 54.2K new jobs added in August vs 15K forecasted and unemployment rate staying unchanged at 5.6%) inflated Australian dollar in Asia.
The Aussie jumped above 0.8000 barrier after three-day fall, including today’s action, found support at 0.7970 (daily Kijun-sen / 20SMA, as well as main bull-trendline off 0.7370).
However, gains were limited on disappointing data from China (Industrial production rose by 6.0% in August, undershooting forecast at 6.6% and also falling well below 6.4% in July and Retail sales also missed, coming at 10.1% in August vs 1.5% forecast and 6.4% in July).
This may offset positive impact from positive jobs data and keep near-term bias with bears while the price is unable to clearly break above initial 0.8000 barrier.
Stronger recovery needs break above 0.8000 and next pivot at 0.8030 (daily Tenkan-sen / Fibo 38.2% of 0.8124/0.7970 pullback) which would generate stronger bullish signal.
Otherwise, the downside is expected to remain vulnerable for renewed attack at 0.7970 pivot, loss of which would trigger fresh extension of pullback from 0.8124 towards 0.7929 (Fibo 61.8%) and expose daily cloud top at 0.7883.
Res: 0.8016, 0.8030, 0.8043, 0.8058
Sup: 0.7970, 0.7939, 0.7929, 0.7883
EUR/GBP Elliott Wave Analysis
EUR/GBP – 0.9018
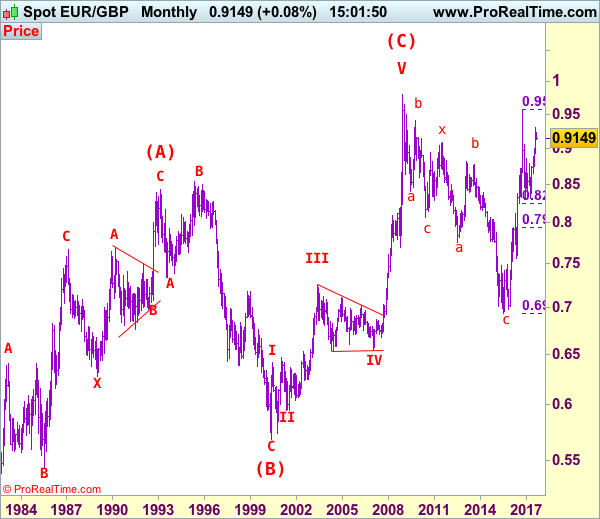
Although the single currency slipped again this week and near term downside risk remains for the retreat from 0.9307 temporary top to bring retracement of recent rise, reckon downside would be limited to 0.8980 and bring rebound to 0.9100, then test of 0.9200-05 but a daily close above latter level is needed to signal the retreat from 0.9307 has ended, bring further gain to 0.9235-40. Looking ahead, above this level would bring retest of 0.9307 but break there is needed to confirm recent upmove from 0.8304 (wave iv trough) has resumed and extend gain to 0.9380-85. We are keeping our view that early retreat from 0.9576 (wave iii top) has ended earlier at 0.8304 and bullishness remains for the rise from there to extend further gain to 0.9350, however, near term overbought condition should prevent sharp move beyond 0.9380-85 (100% projection of 0.8312-0.8950 measuring from 0.8743) and reckon 0.9440-50 would hold from here, risk from there is seen for a retreat.
Our latest preferred count is that the wave V of a 5-wave series from 0.5682 ended at 0.9805 earlier and major from there has possibly ended at 0.8067 as A-B-C-X-A-B-C. We are keeping our view that the entire correction from 0.9805 has possibly ended at 0.7756 and as labeled as the attached daily chart and impulsive move from 0.9084 has ended at 0.6938 as a 5-waver which marked as the (C) wave, recent impulsive rise is labeled as (I) (II), (i) (ii) series, indicated upside target at 0.9084 had been met, the retreat from 0.9576 suggest wave iii ended there and next upside target for wave v of (III) should head towards 0.9700 but price should falter well below parity .
On the downside, whilst initial marginal weakness from here cannot be ruled out, reckon downside would be limited to 0.8970-80 and bring another rise later. A daily close below support at 0.8923 would defer and suggest a temporary top has possibly been formed at 0.9307, risk correction to support at 0.8891, then 0.8850-60 but reckon downside would be limited to 0.8825-30 and bring another upmove later.
Recommendation: Hold long entered at 0.9065 for 0.9265 with stop below 0.8965

Euro's long term uptrend started in Feb 1981 at 0.5039 and is unfolding as a (A)-(B)-(C) move with (A): 0.8433 (Feb 1993), (B): 0.5682 (May 2000) and impulsive wave (C) should have ended at 0.9805 with wave III ended at 0.7254 (May 2003), triangle wave IV at 0.6536 (23 Jan 2007) and wave V as well as wave (C) has ended at 0.9805.
We are keeping an alternate count that only wave III ended at 0.9805 and the correction from there is the wave IV and has possibly ended at 0.6936, however, it is necessary to see a daily close above resistance at 0.9576 in order to change this to be the preferred count.
Technical Outlook: USDCHF Remains Steady After SNB And Probes Above Daily Cloud
Swiss National Bank left interest rate unchanged at 0.75% on their monetary policy meeting today. The SNB will continue to maintain its expansionary monetary policy, aiming to stabilize price developments and support economic activity. The central bank said Swiss Franc remains highly valued and the situation in the FX market remains fragile, with negative interest rates and SNB remaining ready to intervene in the FX market to reduce pressure on the national currency. The USDCHF remains in steep near-term recovery rally from 0.9420 (08 Sep low) which so far retraced over 61.8% of 0.9765/0.9420 downleg and probes above daily cloud, which twisted on Wednesday and was attracting near-term bulls. The pair hit session high at 0.9660, retesting Wednesday's high, after mild downside action post-SNB (the price fell to 0.9617 but recovered quickly). Daily studies are mixed, with MA's turning into bullish setup but slow stochastic strongly overbought and negative momentum studies, requiring further signals. Close above daily cloud will be bullish signal for extension towards next target at 0.9688 (descending 100SMA), however, overbought conditions warn of stall signals. Daily cloud base (0.9605) and daily Kijun-sen (0.9592) mark lower pivots, loss of which would generate stronger bearish signal for deeper correction.
Res: 0.9660, 0.9688, 0.9700, 0.9765
Sup: 0.9648, 0.9617, 0.9605, 0.9592
Technical Outlook: GBPUSD – BoE In Focus, Rally Towards 1.35 Zone Seen On Hawkish MPC Or Fall To 1.3070...
Cable is holding within narrow range in early Thursday and awaiting the outcome of Bank of England MPC's monetary policy meeting.
The pound ended trading on Wednesday in red, after being hit by overall weak UK jobs data, with additional pressure coming from stronger dollar which was boosted by signs that President Trump's tax plan was gaining momentum. Today's focus is at BoE, with central bank widely expected to keep interest rate and QE unchanged (0.25% and 435billion pounds respectively).
Markets will be closely watching for the rhetoric of the MPC, as BoE is expected to keep the story about interest rate hike alive and also focus on today's voting configuration.
The nine-member UK MPC is expected to vote 7-2 for rate hike, but surprise on hawkish shift on 6-3 voting configuration is also on the table.
This scenario would be supportive for pound and could spark stronger bullish acceleration towards target at 1.3473 (weekly cloud top).
On the other side, more dovish tone from BoE would weaken pound and risk bearish acceleration towards strong support at 1.3070 (daily cloud top).
Res: 1.3268, 1.3300, 1.3328, 1.3385
Sup: 1.3198, 1.3158, 1.3112, 1.3070
AUD/USD: Australian Employment Change
The positive report on the Australia's job market contributed to strengthening of the Aussie in Wednesday morning. The Australian Dollar strengthened by 0.46% against the Greenback to consolidate in the 0.8000 area.
The Australian Bureau of Statistics published the report showing that the country's unemployment rate remained at the 5.6% level, in line with expectations. Data revealed the job market added 54.2K new positions over the course of August, while analysts' anticipated a 17.4K gain. The Australian economy was still far to reach full employment, with main concern surrounding flat wage growth, which refrains consumer confidence.
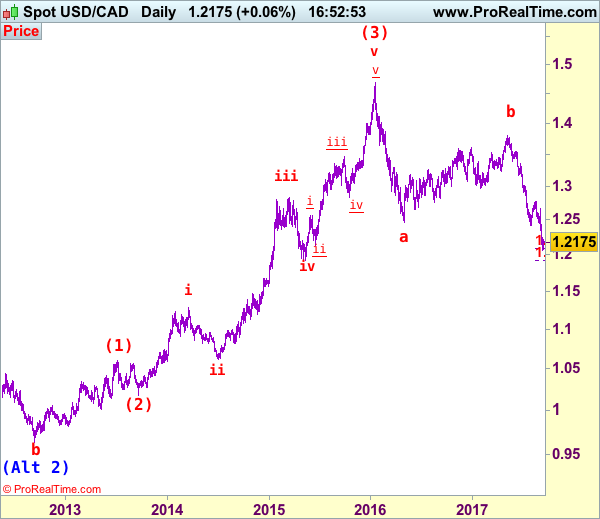
USD/CAD Elliott Wave Analysis
USD/CAD – 1.2177
As the greenback has remained under pressure after resuming recent decline, suggesting near term downside risk remains for recent selloff to extend weakness to 1.2050-60, however, loss of downward momentum should prevent sharp fall below psychological support at 1.2000 and reckon 1.1925 (61.8% projection of 1.3794-1.2414 measuring from 1.2778) and reckon 1.1890-00 would hold from here, risk has increased for a rebound to take place later. We are keeping our bearish count that wave b ended at 1.3794 and wave c has commenced for further fall towards psychological support at 1.2000.
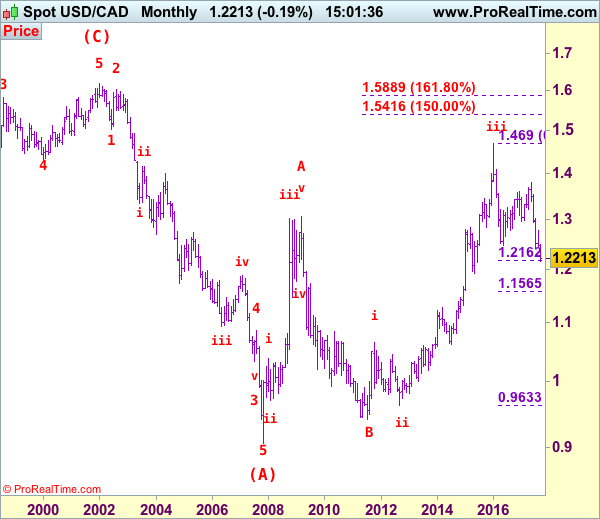
We are keeping our view that the wave b from 1.0657 (a leg top) has possibly ended at 0.9633 with (a): 0.9800, wave (b): 1.0447 and wave c at 0.9633, the subsequent rise from there is now treated as wave c exceeded indicated upside target at 1.3770-80 and 1.4000 and wave (3) has possibly ended at 1.4690 and wave (4) correction has commenced for retracement back towards 1.2000.
On the daily chart, our latest preferred count remains that the A of (B) rally from 0.9059 low (7 Nov 2007) unfolded into an impulsive wave with i: 0.9059-1.0380, ii ended at 0.9819, iii at 1.3019 followed by triangle wave iv at 1.2026 , then wave v formed a top at 1.3066 and also ended the wave A. The wave B is unfolding as an double three a-b-c-x-a-b-c and is sub-divided as a: 1.2192, b: 1.2716 and wave c at 1.0784, followed by wave x at 1.1725, another set of a-b-c unfolded with 2nd a at 0.9931, 2nd b at 1.0674. the 2nd c has possibly ended at 0.9407, therefore, consolidation with upside bias is seen for major correction, indicated target at 1.3900 had been met and gain to 1.4700 would follow.
On the upside, whilst initial recovery to 1.2290-00 cannot be ruled out, reckon upside would be limited to 1.2350-60 and price should falter below previous support at 1.2414 (now resistance), bring another decline later. A daily close above 1.2440-50 would defer and suggest a temporary low is possibly formed, bring a stronger rebound to 1.2500 and possibly 1.2550-60 but said resistance at 1.2663 should remain intact.
Recommendation: Would be prudent to stand aside for this week.
Longer term - The selloff from 1.6194 (21 Jan 2002) to 0.9059 (07 Nov 2007) is viewed as (A) wave which is a 5-waver as labeled on the monthly chart as below, the subsequently rally is labeled as (B) with impulsive A leg of (B) ended at 1.3066, wave B of (B) is unfolding which has either ended at 0.9407 or would extend one more fall but downside should be limited to 0.9200 and 0.9000 should hold.
EUR/USD: US Producer Price Index
The EUR/USD revealed muted response on a slighter-than-expected increase in the US producer prices. However, in the next couple of hours the Euro depreciated significantly against the Greenback, falling to the weakest level in a week below the 1.1900 mark.
The Labour Department revealed that the US producer prices accelerated growth at the strongest pace in four months amid an increase in gasoline prices. The report showed that the country’s PPI for final demand rose 0.2% in August, slightly below expectations for a 0.3% gain. Wednesday’s data were not quite as broad-based or strong as the Fed would like to consider to support an increase in core consumer prices to the Central Banks 2% target.