
Sample Category Title
UK Gilts Yields Rise, GBP Higher, FTSE Lower
Yields on U.K. government bonds have rallied across the curve as the Bank of England adopts a more "hawkish" tone.
The majority of Monetary Policy Committee members think "some withdrawal of monetary stimulus is likely to be appropriate over the coming months."
Also supporting yields is the BoE now expects inflation to rise above +3% in October.
Two-year gilt yields have rallied to +0.32%, their highest level since July and sharply up since levels of +0.13% only last week. Five, 10 and 30-year yields are also backing up.
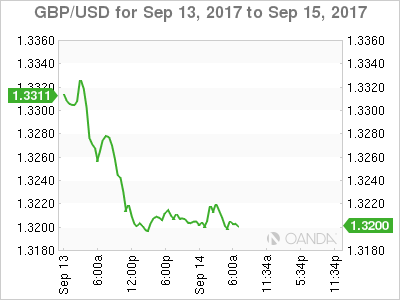
The FTSE 100 is trading down -0.36% as GBP/USD trades up +0.8% at £1.3320 and EUR/GBP is down -0.82% at €0.8926.
BoE Inflated Pound for Strong Acceleration
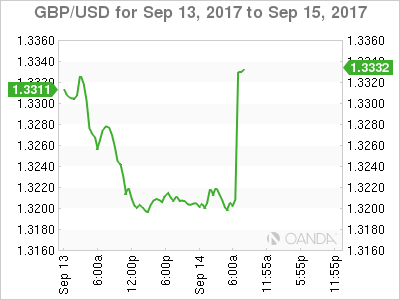
Cable spiked lower to session low at 1.3148 on knee-jerk reaction after BoE's left no surprise on 7-2 vote for rate hike on today's meeting. The Bank of England left interest rates and QE unchanged at 0.25% and 435 billion pounds respectively, which disappointed traders who expected more hawkish voting configuration. However, comments from BoE sounded optimistic and inflated pound for strong acceleration which returned above 1.3300 barrier and probes above yesterday's high at 1.3328. BoE MPC's policymakers said their first interest rate rise in more than a decade, was likely to be needed in coming months if economy growth and inflationary pressures continue to build. Markets took BoE's message as hawkish that sent pound into strong bullish acceleration, signaling that corrective phase off 1.3328 high is over. Bullish techs and renewed positive sentiment after BoE are supportive for acceleration towards target at 1.3473, provided by weekly cloud top.
Res: 1.3336; 1.3385; 1.3457; 1.3473
Sup: 1.3268; 1.3200; 1.3148; 1.3121
GBP/USD Mid-Day Outlook
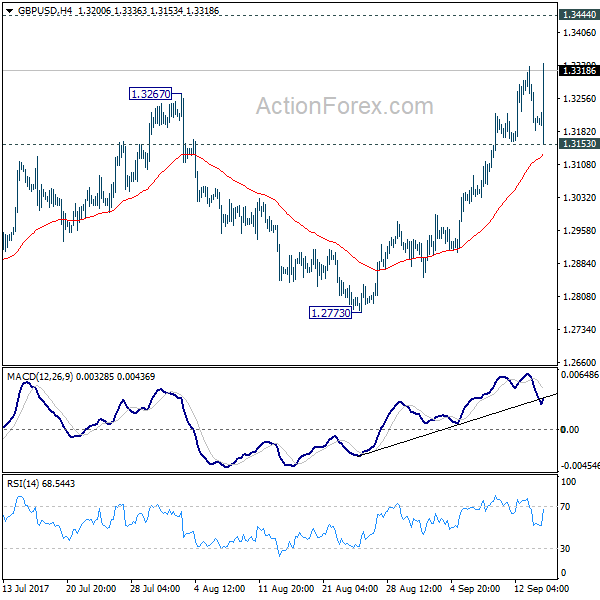
Daily Pivots: (S1) 1.3150; (P) 1.3240; (R1) 1.3297; More...
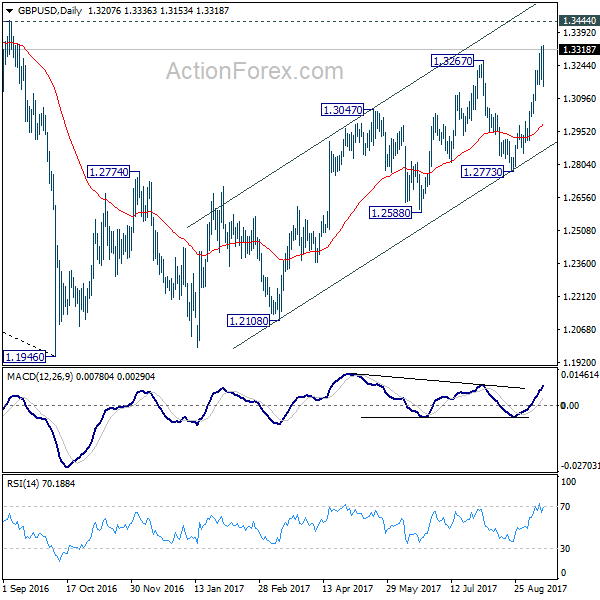
GBP/USD's rally resumes after brief retreat, breaking 1.3328 to as high as 1.3336 so far. Intraday bias is back on the upside for 1.3444 key resistance next. Still, we'd maintain that price actions from 1.1946 are still seen as a corrective pattern. Hence, we'd expect strong resistance from 1.3444 to limit upside to bring larger down trend reversal eventually. Break of 1.3153 support will raise the chance of reversal and turn bias to the downside for 55 day EMA (now at 1.2987) first. However, on the upside, firm break of 1.3444 will carry larger bullish implication and target 1.3835/5016 resistance first zone next.
In the bigger picture, overall, price actions from 1.1946 medium term low are seen as a corrective pattern. While further rise cannot be ruled out, larger outlook remains bearish as long as 1.3444 key resistance holds. Down trend from 1.7190 (2014 high) is expected to resume later after the correction completes. And break of 1.2773 support will be the first sign that such down trend is resuming. However, considering bullish convergence condition in monthly MACD, firm break of 1.3444 will argue that whole down trend from 2.1161 (2007) has completed. And stronger rise would be seen back to 38.2% retracement of 2.1161 to 1.1946 at 1.5466.
Sterling Surges as BoE Indicates Stimulus Exit Appropriate in Coming Months
Quick update: Dollar regains some strength after better than expected data. Headline CPI rose 0.4% mom, 1.9% yoy in August, above expectation of 0.3% mom, 1.8% yoy. Core CPI rose 0.2% mom, 1.7% yoy versus expectation of 0.2% mom, 1.6% yoy. Initial jobless claims dropped to 284k in the week ended September 9. Also, Canada new housing price index rose 0.4% mom in July.
The British Pound surges sharply as markets perceive BoE announcement today as a hawkish ones. There is no surprise from the policy decision, nor the vote split. The key is that BoE now indicated that stimulus exit could start in the coming "months". Swiss Franc stays soft after SNB left interest rates unchanged and sounds less concerned with the exchange rate in the statement. Meanwhile, Dollar is struggling to extend yesterday's tax reform new triggered gain after US President Donald Trump denied a DACA deal with Democrats. That raises the doubt again on whether Trump is working on bipartisan solutions with Democrats which leads to speedy approval of tax reforms.
BoE: Some withdrawal of monetary stimulus likely appropriate over the coming months
BoE left monetary policies unchanged today as widely expected. Bank rate is held at 0.25% by 7-2 vote with the usual hawks Ian McCafferty and Michael Saunders maintained their vote for a 25bps hike. Asset purchase target is kept at GBP 435b unanimously. Markets seen the announcement as a hawkish one though. The minutes noted that if the economy develops as expected, the majority believed "some withdrawal of monetary stimulus was likely to be appropriate over the coming months in order to return inflation sustainably to target." At the same time, BoE also reiterated the warning that policy tightening could happen "by a somewhat greater extent" than market rates imply. Nonetheless, such rate increases would be "at a gradual pace and to a limited extent."
PM May to deliver Brexit speech in Europe's historical heart in Florence
UK Prime Minister Theresa May announced that she will deliver a speech in Florence on September 22 "to update on Brexit negotiations so far". That will be just a few days ahead of the fourth round of Brexit negotiation, which is postponed to the week of September 25. May's spokesman said that "she will underline the government's wish for a deep and special partnership with the European Union once the UK leaves the EU." And May "wanted to give a speech on the UK's future relationship with Europe in its historical heart". UK also has had "deep cultural and economic ties spanning centuries with Florence, a city known for its historical trading power."
SNB Appears Less Concerned About CHF
As widely expected, SNB decided to keep the sight deposit rate unchanged at -0.75%, while the target range for the three-month Libor stayed at between -1.25% and -0.25%. The central bank also reiterated the pledge that it would intervene in the foreign exchange market if needed. Yet, SNB's sight deposit and FX reserve data indicate that less intervention has been adopted recently. Also Swiss franc's depreciation against the over the past few months has offered some reliefs to the policymakers. At the the members acknowledged the franc is not as overvalued as before. Nonetheless, weak economic and inflation have led the members to remain cautious and maintain the monetary policy unchanged. More in SNB Appears Less Concerned About CHF.
ECB Jazbec: More evidence needed before stimulus withdrawal
ECB governing council member Bostjan Jazbec said that more evidence is needed before the central bank decides to withdraw from the massive monetary stimulus. Jazbec noted that "we are still closely monitoring all developments, which are clearly going the way we expected." However, "the timing for the decision (on reducing bond purchases) has been postponed mainly because developments are in our view still not confirming the decision which will inevitably follow." And, "we need more data and more confirmation that what we are doing is in line with fulfilling our mandate." Strength of Euro is reported to be a major concerns among policy makers. But Jazbec sounded calm on it and note that the strong euro was a "a reflection of the robustness of growth development" in the euro zone.
Trump denied a DACA deal with Democrats
US President Donald Trump pushed back against claims from top Democrat lawmakers that a deal was made over the so called DACA (Deferred Action for Childhood Arrivals ) program. Trump tweeted that "no deal was made last night on DACA". And, massive border security would have to be agreed to in exchange for consent. Would be subject to vote."
Yesterday, Democrat leaders of the House and Senate, Nancy Pelosi and Chuck Schumer, said that yesterday that after a "very productive dinner" with Trump, "we agreed to enshrine the protections of DACA into law quickly and to work out a package of border security, excluding the wall, that's acceptable to both sides".
The White House issued a statement yesterday that the topics at the dinner with Democrats include tax reform, border security, DACA, infrastructure and trade. And the statement noted that "this is a positive step toward the President's strong commitment to bipartisan solutions for the issues most important to all Americans.
Also, House Ways and Means Committee Chairman Kevin Brady, the chief house tax writer, said the tax overhaul framework will be released in the week of September 25. Brady said that's a "consensus" of the so called Big Six including Speaker Paul D. Ryan, Senate Majority Leader Mitch McConnell, Senate Finance Committee Chairman Orrin G. Hatch, Treasury Secretary Steven Mnuchin, and White House economic adviser Gary Cohn.
There was hopes that Trump's change in his "strategy" in engaging the Democrats would speed up the progress to get tax reform through the Congress. Dollar surged as a result of this expectation. But markets will be cautious, at least until Trump delivers something concrete. And, time is needed to see whether Trump is really willing to work with the Democrats for so called "bipartisan solutions" for the good of Americans.
Aussie lifted mildly by strong job data
Australian job market expanded by 54.2k in August, nearly triple of expectation of 19.2k. That consists of decent growth in full-time jobs by 40.1k and part-time jobs by 14.1k. Unemployment rate was unchanged at 5.6%, in line with consensus. Participation rate also rose to 65.3%. There is slight change in expectation of RBA policies after the data. Markets are pricing in roughly 50% chance of a hike in June 2018.
RBA board member Ian Harper said yesterday that while there is "terrific" full time job growth, it's a "concern" to see sluggishness in underemployment. And, the Australian economy is still "operating below its potential". And it cannot justify a rate hike yet. Nonetheless, improvements in the economy prompted market analysts to reverse their forecast of RBA rate path. National Australia Bank predicted two rate cuts by RBA in 2017 earlier this year. But now's NAB is expecting a total for four rate hikes by RBA over the next two years. Stronger employment, GDP growth and investment are the main reasons for the change in NAB's forecast.
Disappointing August Data Evidenced That Chinese Growth Peaked In 1H17
August data further evidenced that China's economic growth has peaked in the first quarter. Following the sharper-than-expected slowdown in growth in July, the latest set of macroeconomic data also surprised to the downside. The moderation was a result of the government's tighter monetary policy in an attempt to curb excessive investment in certain areas, such as real estate. Renminbi's appreciation against US dollar since the beginning of the year probably has weighed on exports. This leads the PBOC to loosen capital control which has been adopted over the past years to prevent renminbi from severe depreciation. More in Disappointing August Data Evidenced That Chinese Growth Peaked In 1H17.
GBP/USD Mid-Day Outlook
Daily Pivots: (S1) 1.3150; (P) 1.3240; (R1) 1.3297; More...
GBP/USD's rally resumes after brief retreat, breaking 1.3328 to as high as 1.3336 so far. Intraday bias is back on the upside for 1.3444 key resistance next. Still, we'd maintain that price actions from 1.1946 are still seen as a corrective pattern. Hence, we'd expect strong resistance from 1.3444 to limit upside to bring larger down trend reversal eventually. Break of 1.3153 support will raise the chance of reversal and turn bias to the downside for 55 day EMA (now at 1.2987) first. However, on the upside, firm break of 1.3444 will carry larger bullish implication and target 1.3835/5016 resistance first zone next.
In the bigger picture, overall, price actions from 1.1946 medium term low are seen as a corrective pattern. While further rise cannot be ruled out, larger outlook remains bearish as long as 1.3444 key resistance holds. Down trend from 1.7190 (2014 high) is expected to resume later after the correction completes. And break of 1.2773 support will be the first sign that such down trend is resuming. However, considering bullish convergence condition in monthly MACD, firm break of 1.3444 will argue that whole down trend from 2.1161 (2007) has completed. And stronger rise would be seen back to 38.2% retracement of 2.1161 to 1.1946 at 1.5466.
Economic Indicators Update
| GMT | Ccy | Events | Actual | Forecast | Previous | Revised |
|---|---|---|---|---|---|---|
| 23:01 | GBP | RICS House Price Balance Aug | 6.00% | 0.00% | 1.00% | |
| 01:00 | AUD | Consumer Inflation Expectation Sep | 3.80% | 4.20% | ||
| 01:30 | AUD | Employment Change Aug | 54.2K | 19.2K | 27.9K | 29.3K |
| 01:30 | AUD | Unemployment Rate Aug | 5.60% | 5.60% | 5.60% | |
| 02:00 | CNY | Retail Sales Y/Y Aug | 10.10% | 10.50% | 10.40% | |
| 02:00 | CNY | Fixed Assets Ex Rural YTD Y/Y Aug | 7.80% | 8.20% | 8.30% | |
| 02:00 | CNY | Industrial Production Y/Y Aug | 6.00% | 6.60% | 6.40% | |
| 04:30 | JPY | Industrial Production M/M Jul F | -0.80% | -0.80% | -0.80% | |
| 07:30 | CHF | SNB Sight Deposit Interest Rate | -0.75% | -0.75% | -0.75% | |
| 07:30 | CHF | SNB 3-Month Libor Upper Target Range | -0.20% | -0.25% | -0.25% | |
| 07:30 | CHF | SNB 3-Month Libor Lower Target Range | -1.25% | -1.25% | -1.25% | |
| 11:00 | GBP | BoE Rate Decision | 0.25% | 0.25% | 0.25% | |
| 11:00 | GBP | BoE Asset Purchase Target Sep | 435B | 435B | 435B | |
| 11:00 | GBP | MPC Official Bank Rate Votes | 2--0--7 | 2--0--7 | 2--0--6 | |
| 11:00 | GBP | MPC Asset Purchase Facility Votes | 0--0--9 | 0--0--9 | 0--0--8 | |
| 12:30 | CAD | New Housing Price Index M/M Jul | 0.40% | 0.30% | 0.20% | |
| 12:30 | USD | Initial Jobless Claims (SEP 09) | 284K | 300k | 298k | |
| 12:30 | USD | CPI M/M Aug | 0.40% | 0.30% | 0.10% | |
| 12:30 | USD | CPI Y/Y Aug | 1.90% | 1.80% | 1.70% | |
| 12:30 | USD | CPI Core M/M Aug | 0.20% | 0.20% | 0.10% | |
| 12:30 | USD | CPI Core Y/Y Aug | 1.70% | 1.60% | 1.70% | |
| 14:30 | USD | Natural Gas Storage | 80B | 65B |
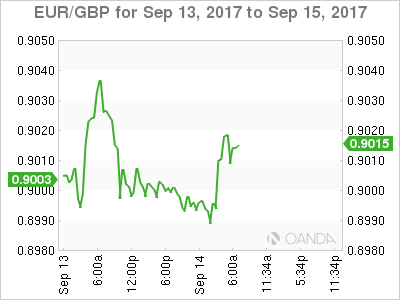
EURGBP Turns Bearish In Short Term, Bullish Outlook Weakens
EURGBP has stabilized around 0.90 following a two-week sell-off that saw the pair declining by more than 3% over the period. The downside momentum gained strength after prices breached the bottom of the upward trending linear regression channel. The short-term bias remains bearish with the RSI still in negative territory, although there are signs that the current downtrend has bottomed out. The RSI appears to have halted its decline and the stochastics are in oversold territory, suggesting an upside reversal could be on its way. Should the pair attempt to resume its uptrend, the 50-day moving average (MA) will likely act as immediate resistance at around the 0.9040 level. A break above the 50-day MA should help bolster the upside momentum and push price action back inside the channel. However, prices will likely meet strong resistance at the lower channel line at 0.91. Further gains would see the pair targeting the 0.9140 and 0.9200 levels followed by 0.9260. A break above 0.9260 would clear the way towards August's 8-year high of 0.9306. Failure to hold above this week's one-month low of 0.8982 would deepen the bearish bias and bring into the view the previous congested area of 0.8940. The next major support would come from the 0.8850 area. A drop below this level would threaten the bullish medium-term outlook, which has already weakened from the latest downslide, as it would take prices closer to the 200-day MA.
Watch Sterling, It Could Fly On BoE Decision
This week's risk rally has taken a breather ahead of this morning's Bank of England (BoE) monetary policy decisions (07:00 am EDT) and U.S inflation data (08:30 am EDT).
Most market watchers expect the BoE to vote 7-2 to keep rates on hold for now, but with the risk of a dissenter tilting the vote to 6-3. However, the jump in August U.K inflation to +2.9% y/y means there is a substantial risk that another MPC member could dissent in favour of a hike.
Depending on the outcome, sterling is expected to be in for a bumpy ride this morning. The possibility of a new 12-month high print outright (£1.3330) or even or a collapse towards the psychological £1.3000 handle is very much on the cards. Recent mixed U.K data, with high inflation, better labor market and manufacturing activity data, but weak wage growth and services sector activity, makes today's outcome rather uncertain.
1. Global Stocks see red
In Japan, stocks edged lower overnight, snapping a three-day winning streak, as weak Chinese economic data (see below) offset early gains when the broader Topix index hit the highest level in 24-months. Investor sentiment was also under pressure on news that a North Korean state agency threatened to use nuclear weapons to “sink” Japan and reduce the U.S to “ashes and darkness” for supporting a U.N sanctions. The Nikkei share average fell -0.3%, while the broader Topix also dropped -0.3%.
In Hong Kong, it was a similar situation disappointing China data rekindled investor concerns that the country's economy could start to lose some steam. The Hang Seng index fell -0.4%, while the China Enterprises Index lost -0.8%.
In China, with softer data overnight, investor are concerned that tighter monetary conditions will continue to weigh on credit growth and hence lead to a further slowdown in domestic economic activity. The CSI300 index was down -0.2%, while the Shanghai Composite Index lost -0.3%.
In Europe, regional indices trade little changed, even the FTSE trades flat ahead of the BoE rate decision. Miners are the biggest underperformers after disappointing data from China.
U.S stocks are set to open in the red (-0.1%).
Indices: Stoxx600 -0.1% at 381.0, FTSE flat at 7381, DAX -0.3% at 12519, CAC-40 -0.1% at 5212, IBEX-35 -0.6% at 10312, FTSE MIB flat at 22233, SMI +0.1% at 9064, S&P 500 Futures -0.1%.
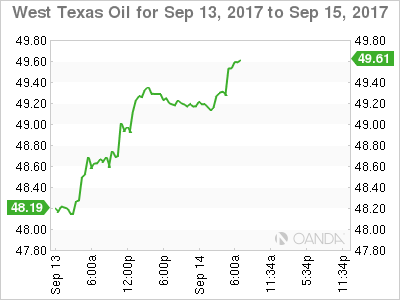
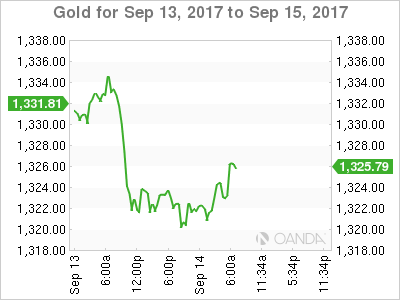
2. Oil holds gains, supported by hopes for robust demand, gold lower
Ahead of the U.S open, crude prices continue to hold on to most of yesterday's session gains when the market was buoyed by a forecast for firmer global oil demand by the IEA.
Brent crude for November is down -18c, or -0.3%, at +$54.98 a barrel after rising +1.6% Wednesday. West Texas Intermediate (WTI) is down -9c, or -0.2% at +$49.21, after a +2.2% gain yesterday.
Wednesday's gains came despite U.S government data showing another big build in weekly crude inventories due to Hurricane Harvey.
Note: DoE Crude: +5.9m vs. +3.5me; Gasoline: -8.4m vs. -3me; Distillate: -3.2m vs. -1.5me (biggest gasoline inventory drop since at least 1990)
Ahead of the U.S session, gold is trading atop of its two week lows on waning risk aversion, and as the dollar remains steady ahead of this morning's U.S consumer inflation data that is expected to offer clues on Fed hike timing. Spot gold is down -0.1% at +$1,321.24 an ounce
3. Sovereign yields back up
A potential “hawkish” turn by the BoE in a few hours is unlikely to catch fixed income traders offside, as rates have managed to back up aggressively this week.
The entire gilt curve has moved higher since last week's close. U.K 10-year Gilt yields have backed up +2 bps to +1.164% overnight, their highest yield print in six-weeks – a stronger-than-expected consumer inflation print Tuesday helped boost expectations of a more “hawkish” stance at today's monetary policy decision.
Elsewhere, the yield on U.S 10-year Treasuries have rallied less than +1 bps to +2.19%, hitting its highest print in three-weeks, Germany's 10-year Bund yield has backed up +1 bps to a one month high of +0.41%.
There were no surprises from Swiss National Bank (SNB) this morning who kept its deposit rate well in negative territory at -0.75%.
4. Dollar waits for U.S inflation data
Earlier this morning, the SNB amended its rhetoric on the currency front, noting that the currency has weakened versus the EUR (€1.1500) since its last policy announcement, but still said, “the Swiss franc nevertheless remains highly valued” and that its intervention in the foreign exchange market is “necessary.” It also noted that it had rallied against the USD ($0.9666). Swiss policy members also upgraded their inflation forecasts. SNB now sees inflation rising to +0.4% this year, compared with +0.3% previously. For 2018, inflation should go up by +0.4% as well.
Sterling (£1.3195) is trading lower before the BoE, as dealers are mindful of a less hawkish BoE. EUR/GBP is up +0.2% at €0.9018.
Note: The pound has been on a short rally in the past few sessions on expectations that the BoE will sound in favor of raising interest rates given that inflation is on a path towards +3%. Despite that, the market seems happy to take out most of the premium that was put in place after Tuesday's U.K consumer inflation data.
5. Chinese data disappoints; Aussie jobs again show growth
Chinese data overnight showed that retail sales (+10.1% vs. +10.5%e), industrial production (+6.0% vs. +6.6%e) and fixed-asset investment all slowed last month after a lackluster July as efforts to rein in credit expansion and reduce excess capacity begin to hit home.
China's fixed-asset investment, a key growth driver for the nation's economy, grew +7.8% in the first eight-months, the weakest pace since December 1999 and cooling from +8.3% in January-July. Factory was the weakest growth rate in nine-months.
Elsewhere, down-under, the Aussie economy added +54.2k jobs in August, more than twice as many expected. Both part-time and full-time employment saw growth. The jobless rate was steady at +5.6%
CAC Unchanged As French CPI Matches Estimate
The CAC index is unchanged on the Thursday session. Currently, the index is at 5,218.30, up 0.01% on the day. On the release front, there are no major eurozone events. French Final CPI rebounded in August with a gain of 0.5%, matching the estimate. On Friday, the Eurozone surplus is expected to drop to EUR 20.1 billion.
The French economy continues to improve, and received a thumbs-up from the OECD, which released a report on the French economy on Thursday. The OECD is forecasting growth of 1.7% in 2017, compared to a 1.1% gain in 2016. The report commended President Emmanuel Macron’s agenda to reform the economy, but emphasized that the government needed to cut public sector spending, which is the highest in the 35- member OECD. The report also called on the French government to overhaul the country’s labor laws, including cutting pension costs and raising the current retirement age of 62 years. With President Emmanuel Macron declaring he will reform France’s labor laws, powerful trade unions are mobilizing to fight back. On Tuesday, some 200,000 trade unionists came out for a mass protest. The government plans to adopt new labor rules on September 22, and two large unions have threatened to respond with a massive truckers strike on September 25, which could cause chaos across the country.
Germany goes to the polls on September 24, and France is hoping that a widely expected Angela Merkel win could lead to a more unified eurozone. President Macron plans to unveil a proposal to reform the eurozone, which would include a eurozone finance minister that would be in charge of a eurozone budget. Macron’s call for greater cooperation is linked to Britain’s exit from the EU, which could lead to divisions among the remaining 27 members in the bloc. Macron’s ambitious plan will need Germany’s support before it can become a reality. Will Germany embrace the idea? Angela Merkel’s position has said she is open to the idea, but on Wednesday, Jean-Claude Juckner, head of the European Commission, dismissed the plan, saying he favored a finance minister for the EU but was against a separate eurozone budget and finance minister.
(BOE) Bank Rate Held at 0.25%, Government Bond Purchases at £435bn and Corporate Bond Purchases at up to £10bn
The Bank of England's Monetary Policy Committee (MPC) sets monetary policy to meet the 2% inflation target, and in a way that helps to sustain growth and employment. At its meeting ending on 13 September 2017, the MPC voted by a majority of 7-2 to maintain Bank Rate at 0.25%. The Committee voted unanimously to maintain the stock of sterling non-financial investment-grade corporate bond purchases, financed by the issuance of central bank reserves, at £10 billion. The Committee voted unanimously to maintain the stock of UK government bond purchases, financed by the issuance of central bank reserves, at £435 billion.
The MPC set out its most recent assessment of the outlook for inflation and activity in the August Inflation Report. That assessment depended importantly on three main judgments: that the lower level of sterling continues to boost consumer prices broadly as projected, and without adverse consequences for inflation expectations further ahead; that regular pay growth remains modest in the near term but picks up over the forecast period; and that subdued household spending growth is largely balanced by a pickup in other components of demand.
Since the August Report, the relatively limited news on activity points, if anything, to a slightly stronger picture than anticipated. GDP rose by 0.3% in the second quarter, as expected in the MPC's August projections, although initial estimates of private final demand were softer than anticipated. The unemployment rate has continued to decline, to 4.3%, its lowest in over 40 years and a little lower than forecast in August. Survey indicators are consistent with continued strength in employment growth. Evidence continues to accumulate that the rate of potential supply growth has slowed in recent years. Overall, the latest indicators are consistent with UK demand growing a little in excess of this diminished rate of potential supply growth, and the continued erosion of what is now a fairly limited degree of spare capacity. Underlying pay growth has shown some signs of recovery, albeit remaining modest.
The sterling exchange rate has been volatile and the price of oil has increased. Headline and core CPI inflation in August were slightly higher than anticipated. Twelve-month CPI inflation rose to 2.9% and is now expected to rise to above 3% in October.
The circumstances since the referendum on EU membership, and the accompanying depreciation of sterling, have been exceptional. Monetary policy cannot prevent either the necessary real adjustment as the United Kingdom moves towards its new international trading arrangements or the weaker real income growth that is likely to accompany that adjustment over the next few years. The MPC's remit specifies that, in such exceptional circumstances, the Committee must balance any trade-off between the speed at which it intends to return inflation sustainably to the target and the support that monetary policy provides to jobs and activity. Recent developments suggest that remaining spare capacity in the economy is being absorbed a little more rapidly than expected at the time of the August Report, and that inflation remains likely to overshoot the 2% target over the next three years.
All MPC members continue to judge that, if the economy follows a path broadly consistent with the August Inflation Report central projection, then monetary policy could need to be tightened by a somewhat greater extent over the forecast period than current market expectations. A majority of MPC members judge that, if the economy continues to follow a path consistent with the prospect of a continued erosion of slack and a gradual rise in underlying inflationary pressure then, with the further lessening in the trade-off that this would imply, some withdrawal of monetary stimulus is likely to be appropriate over the coming months in order to return inflation sustainably to target. All members agree that any prospective increases in Bank Rate would be expected to be at a gradual pace and to a limited extent.
At this month's meeting, seven members thought that the current policy stance remained appropriate to balance the demands of the MPC's remit. Two members considered it appropriate to increase Bank Rate by 25 basis points. The Committee will undertake a full assessment of recent developments in the context of its November Inflation Report and accompanying economic projections.
There remain considerable risks to the outlook, which include the response of households, businesses and financial markets to developments related to the process of EU withdrawal. The MPC will respond to these developments as they occur insofar as they affect the behaviour of households and businesses, and the outlook for inflation. The Committee will continue to monitor closely the incoming evidence on these and other developments, and stands ready to respond to changes in the economic outlook as they unfold to ensure a sustainable return of inflation to the 2% target.
Market Update – European Session: Focus Turns To BOE MPC Vote And Whether More Hawks Join The Camp
Notes/Observations
SNB keeps policy steady but tweaks language on FX; now sees franc as highly valued compared to significantly over-valued; negative interest rates and FX intervene
options seen as essential in order to reduce the attractiveness of the currency
Focus on BOE rate decision and minutes to see whether the case has been built for more hawks to show their feathers
Overnight
Asia:
Australia Aug Employment Change: +54.2K v +20.0Ke v 27.9K prior; Unemployment Rate: 5.6% v 5.6%e
China Aug Industrial Production Y/Y: 6.0% v 6.6%e
China Aug Retail Sales Y/Y: 10.1% v 10.5%e
Korea Asia-Pacific Peace Committee (North Korea propaganda outlet): Let us reduce US mainland into ashes and darkness; Japan is no longer needed to exist near us
Europe:
Bank of Italy (BOI Paper: Adjustment in path of prices in Euro Area is still limited and far from sustained
BOE's Cunliffe: UK banking sector is stronger than it was before the crisis. BoE looking very closely at consumer lending and some credit card practices to see if there are risks to financial system. Would act if Bank’s Brexit plans pose risks to financial stability
UK govt spokesperson: PM May will make a speech about Britain’s future relationship with EU on Sept 22nd, in Florence Italy
Americas:
President Trump agreed with CFIUS recommendation to block Lattice merger with China's Canyon Bridge Fund citing national security issues
China Commerce Ministry (MOFCOM): Very concerned by Trump's blocking of China deal; security checks shouldn't be used as a protectionism tool
Economic data
(FI) Finland Aug CPI M/M: +0.3 v -0.3% prior; Y/Y: 0.7% v 0.5% prior
(EU) Aug EU27 New Car Registrations: 5.6% v 2.1% prior
(IN) India Aug Wholesale Prices (WPI) Y/Y: 3.2% v 3.2%e
(FR) France Aug Final CPI M/M: 0.5% v 0.5%e; Y/Y: 0.9% v 0.9%e
(FR) France Aug Final CPI EU Harmonized M/M: 0.6% v 0.6%e; Y/Y: 1.0% v 1.0%e, CPI Ex-Tobacco Index: 101.47 v 101.47e
(CH) Swiss National Bank (SNB) left the Sight Deposit Rate unchanged at -0.75% and maintained the 3-Month Libor Range between -0.25 to -1.25% (as expected) 6.6% prior; Unemployment Rate (SAeasonally Adj): 6.6% v 6.8%e
(IT) Italy Aug Final CPI (including Tobacco) M/M: 0.3% v 0.3% prelim; Y/Y: 1.2% v 1.2% prelim
(IT) Italy Aug Final CPI EU Harmonized M/M: 0.1% v 0.1% prelim; Y/Y: 1.4% v 1.4% prelim, CPI FOI Index ex Tobacco: No est v 101.0 prior
(ZA) South Africa Q2 Current Account Balance (ZAR): -110B v -88Be; Current Account to GDP ratio: -2.4% v -1.9%e
Fixed Income Issuance:
(SE) Sweden sold total SEK750M in I/L 2026 and 2027 Bonds
(IE) Ireland Debt Agency (NTMA) sold total €1.0B vs. €1.0B indicated in 2026 and 2037 IGB Bonds
Sold €550M in 1.0% May 2026 IGB bond; Avg Yield: 0.6894% v 0.7200% prior; Bid-to-cover: 2.55x v 2.25x prior
Sold €450M in 2037 IGB bonds; Avg Yeild: 1.6482%; Bid-to-cover: 1.74x
SPEAKERS/FIXED INCOME/FX/COMMODITIES/ERRATUM
Equities
Indices [Stoxx600 -0.1% at 381.0, FTSE flat at 7381, DAX -0.3% at 12519, CAC-40 -0.1% at 5212, IBEX-35 -0.6% at 10312, FTSE MIB flat at 22233, SMI +0.1% at 9064, S&P 500 Futures -0.1%]
Market Focal Points/Key Themes:
European Indices trade little changed with the exception of the Spanish Ibex trading lower by over 0.5%. The UK FTSE trades flat ahead of the BoE Rate decision later today, with shares of Fashion retailer Next outperforming after raising guidance, whilst Morrison shares trade sharply lower following first half results. Miners weigh after disappointing data from China. Elsewhere Interserve trades over 40% lower after a profit warning, on the other hand GVC trades higher after guiding EBITDA comfortable ahead of forecasts.
Equities
Consumer discretionary [Next [NXT.UK] +12.4% (Earnings), Hermes [RMS.UK] -2.1% (Earnings), GVC [GVC.UK] +3.8% (Earnings)]
Consumer Staples: [Morrisons [MRW.UK] -4.3% (Earnings)]
Industrials: [Interserve [IRV.UK] -47% (Profit warnings), GKN [GKN.UK] +3.3% (Board changes)]
Healthcare: [Spire Healthcare [SPI.UK] -16% (Earnings)]
Speakers
SNB policy Statement: CHF currency (Franc) remained highly valued (tweaked language from formerly significantly overvalued). Reiterated would remain active in FX markets and intervene if necessary as the situation remained fragile. To continue to monitor situation in mortgage and property market and would regularly assess countercyclical capital buffer
ECB's Jazbec (Slovenia): ECB QE tapering decision postponed but inevitable; strong euro reflects robust euro area economy. Euro Area has macro-prudential policy dilemma of whether policies should be taken at a European level or the national level
ECB's Smets (Belgium): Inflation might have bottomed out
Sweden Central Bank (Riksbank) Jansson: Latest inflation data being above target was comforting but too early to make policy less expansionary
Poland Central Bank Zyzynski: Might need to keep policy steady through 2018 or even longer
Turkey Fin MIn Agbal: 2017 GDP growth to be higher than mid-term target; could be over 5% for year. Q3 GDP growth above Q2 level. Interest rates to fall with lower CPI
Italy Business industry lobby Confindustria raised its 2017 and 2018 GDP growth forecasts (2017 Growth from 1.3% to 1.5% and 2018 Growth from 1.1% to 1.3%)
OECD: Forecasts France 2017 GDP growth at 1.7% and 2018 at 1.6%. France needed long-term strategy to cut public spending. Pension spending was too high while retirement age too low
Chancellor of Exchequer Hammond (Fin Min): UK government will aim for a "bespoke" deal with the EU to protect the City of London after Brexit. Financial services are the UK's most important export to the EU
Currencies
SNB amended its rhetoric on the currency front but analysts believed that recent depreciation of the Swiss franc was not a reason to change the central bank’s stance on FX and become more relaxed. EUR/CHF probed towards the 1.15 handle despite the SNB noted CHF currency (Franc) remained highly valued (tweaked language from formerly significantly over-valued). SNB obviously welcomed the recent weakening, but they would appreciate it if this trend continued
The main focus of the US morning will be the BOE rate decision and in the vote of the MPC on rates. GBP/USD recently tested above1.33 level on expectations that the BoE will turn up the dial on its hawkish rhetoric in an attempt to convince markets about the possibility of a rate rise at some point in the not too distant future BOE is back to full strength of 9 members as Ramsden joined the Board. Members McCafferty and Saunders have previously dissented at the last two decisions. In the past the chief economist Haldane seemed poised to join the hawks. CPI data has been edging towards 3% in recent months and well above the BOE target of 2%. However, recent wage data foreshadowed that personal consumption might remain subdued and thus keep BOE’s hands tied for some time ahead
Fixed Income
Bund futures trade at 161.81 up 5 ticks and still near the 2-month lows. Continued downside targets 161.42 while upside resistance stands initially at 163.27.
Gilt futures trade at 127.06 down 6 ticks after breaking below the 127.30 support level; the focus remains on the BOE. Continued downside eyeing 126.88, then 126.25. Upside targets 128.90 then 129.24.
Looking Ahead
05:30 (PL) Poland holds switch auction
06:00 (IL) Israel Q2 Current Account: No est v $2.5B prior
06:45 (US) Daily Libor Fixing
07:00 (UK) Bank of England (BOE)Interest Rate Decision: Expected to leave interest rates unchanged at 0.25%
07:00 (UR) Ukraine Central Bank Interest Rate Decision: Expected to leave Key Rate unchanged at 12.50%
07:00 (TR) Turkey Central Bank (CBRT) Interest Rate Decision: Expected to leave all key rates unchanged
07:00 (BR) Brazil Sept FGV Inflation IGP-10 M/M: +0.4%e v -0.2% prior
07:30 (BR) Brazil July Economic Activity Index (Monthly GDP) M/M: 0.1%e v 0.5% prior; Y/Y: +0.8%e v -0.6% prior
08:05 (UK) Baltic Dry Bulk Index
08:30 (US) Initial Jobless Claims: 300Ke v 298K prior; Continuing Claims: 1.97Me v 1.940M prior
08:30 (US) Aug CPI M/M: 0.3%e v 0.1% prior; Y/Y: 1.8%e v 1.7% prior
08:30 (US) Aug CPI Ex Food and Energy M/M: 0.2%e v 0.1% prior; Y/Y: 1.6%e v 1.7% prior
08:30 (US) Aug CPI Index NSA: 245.343e v 244.786 prior; CPI Core Index: 252.336e v 251.914 prior
08:30 (US) Aug Real Avg Weekly Earnings Y/Y: No est v 1.1% prior; Real Avg Hourly Earning Y/Y: No est v 0.7% prior
08:30 (CA) Canada July New Housing Price Index M/M: 0.4%e v 0.2% prior; Y/Y: No est v 3.9% prior
08:30 (US) Weekly USDA Net Export Sales
09:00 (RU) Russia Gold and Forex Reserve w/e Sept 8th: No est v $423.1B prior
09:50 (UK) Chancellor of Exchequer Hammond (Fin Min) in Budapest
10:30 (US) Weekly EIA Natural Gas Inventories
11:00 (BR) Brazil to sell Fixed Rate 2023 and 2027 Bonds
11:00 (BR) Brazil to sell 2018, 2019 and 2021 LTN Bills
11:30 (DE) ECB’s Weidmann (Germany) in Frankfurt
12:00 (IS) Iceland Aug International Reserves (ISK): No est v 670B prior
12:00 (LX) ECB’s Mersch (Luxembourg) in Estonia
14:10 (DE) German Chancellor Merkel at town hall event
15:00 (AR) Argentina Q2 Unemployment Rate: No est v 9.2% prior
17:00 (CL) Chile Central Bank (BCCH) Interest Rate Decision: Expected to leave Overnight Rate Target unchanged at 2.50%
19:00 (PE) Peru Central Bank (BCRP) Interest Rate Decision: Expected to leave Reference Rate unchanged at 3.75%
BoE Decision And US Inflation Data In Focus
US futures are pointing to a relatively flat open on Thursday as we await the latest monetary policy decision from the Bank of England and inflation data from the US.
Both central banks are facing similar and yet very different conundrums, with the UK experiencing above target inflation but slowing growth and economic uncertainty and the US stronger growth and a booming labour market but only moderate below target inflation. While pressure is growing within the BoE to raise interest rates in order to bring inflation back down to target, the opposite is true at the Fed where the desire to raise rates is deteriorating as inflation remains stubbornly low.
The Monetary Policy Committee at the BoE is expected to remain divided today, with two policy makers – Michael Saunders and Ian McCafferty – expected to stick to their guns and vote for a hike but there is the potential that others may join them. The most likely is Andy Haldane – Chief Economist at the BoE – who has indicated previously that he’s not a million miles away from crossing the divide. With two new policy makers having also recently joined – one two months ago and one this month – there is also an element of the unknown in respect to how they will vote.
Rate hike expectations have been ramped up in the markets, with 10-year Gilt yields having risen from 0.957% less than a week ago to as high as 1.164% earlier today, which has coinciding with a strong rally in sterling. The inflation data earlier in the week contributed to this but the rally actually started before so clearly expectations aren’t just based on that one release. Sterling could build on gains if we see any indication that a consensus for a rate hike is building.
With inflationary pressures continuing to elude the US and complicate the Fed’s tightening plans, today’s CPI data for August will naturally be monitored very closely. While the CPI number isn’t the Fed’s preferred measure of inflation, it is released two weeks before the core PCE price index and before next week’s meeting, at which the central bank is expected to announce plans to begin reducing its near $4.5 trillion balance sheet.
Traders haven’t been overly concerned about the tightening aspect of this until now but they are concerned about whether the Fed will delay plans for another rate hike before the end of the year. Markets are currently pricing in only a 47% chance of a December hike at the moment, with growing concerns within the Fed about the below target inflation clearly taking its toll. Further disappointing data today won’t make policy makers any more incline to pursue further hikes in the coming months.