Sample Category Title
Dollar Index Steady Above 92 Key-Level, Sterling Flat Ahead Of BOE Decision
On Thursday, the dollar index was moving sideways above the 92 key-level in Asia, as investors ignored another aggressive warning from North Korea and instead were cautious whether US inflation data released later today would change the chances of the Fed raising interest rates again this year. Meanwhile, the pound was flat at yesterday's lows ahead of the Bank of England's policy meeting later today.
Early in Asia, the North Korean regime threatened to use its nuclear weapons to “sink” Japan and turn the US into “ashes” for their supportive stance on the recent UN decision to approve additional but softer sanctions on its latest nuclear test. However, forex markets reacted little to the renewed North Korean warnings, keeping their eyes mostly on the US consumer price index which is expected to accelerate slightly from 1.7% growth in July to 1.8% in August on a yearly basis. If this expectation is realized or exceeded, it could raise the odds for a third rate hike this year.
Besides that, developments around US fiscal policy seem to support the dollar as congressional committees are expected to create an outline regarding tax reforms in the upcoming weeks starting on September 25. Moreover, the Speaker of the House of Representatives, Paul Ryan, argued on Wednesday that potential tax cuts would be reimbursed by faster economic expansion.
The dollar index was trading flat during Asian hours around 92.40 after a strong rally yesterday which led the index to a 10-day high of 92.48. Dollar/yen edged down from a one-month high of 110.72 early today to 110.45, while dollar/swissie retreated to 0.9648 after it touched a one-month high of 0.9659 yesterday.
Gold continued its downtrend, falling to a two-week low of $1,319.07 per ounce before it climbed to $1,321.34.
The euro weakened to a two-week low of $1.1865 during the Asian session after the ECB's chief economist Peter Praet reiterated that an accommodative monetary policy is needed for inflation to reach the central bank's target of 2%, saying that a “steady hand” should be maintained in policy as inflation still has room to rise.
Meanwhile, in the UK, BOE policymakers are preparing to launch their policy meeting at 1100GMT today, with markets anticipating rates to remain steady with a vote of 7-2. However, July's disappointing figures on wage growth will likely put the BOE members in a dilemma on how to cope with rising inflation which fluctuates near 3%, above the central bank's target of 2%.
In terms of data, Australia published upbeat labor data for the month of August, while Chinese numbers on retail sales and industrial production came in lower than expected.
The aussie partially reversed yesterday's losses touching a session high of $0.8015 in the wake of better-than-expected labor readings. However, a few hours later, weaker Chinese data pushed the currency down to $0.7997.
The kiwi dipped into losses, touching a one-week low of $0.7208 after polls for September 23 elections showed on Thursday that the opposition Labour Party moved to the front position, obtaining the support of 44%, while the governing National Party, which has led the polls so far, attracted a backing of 40%.
Looking at oil prices, WTI crude and Brent were down at $49.27 per barrel and $55.01 respectively.
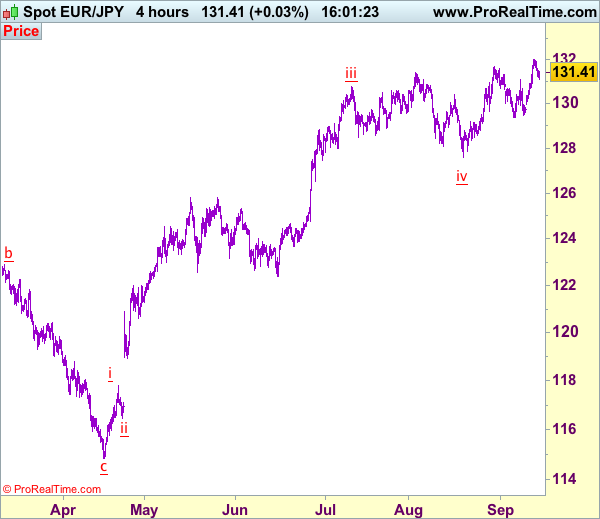
EUR/JPY Daily Outlook
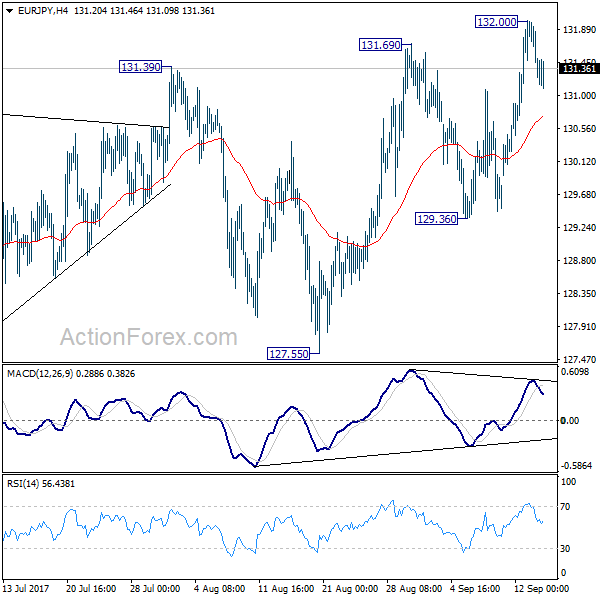
Daily Pivots: (S1) 131.02; (P) 131.46; (R1) 132.25; More...
EUR/JPY lost momentum after hitting 132.00 and intraday bias is turned neutral first. Further rise is expected as long as 129.36 support holds. Above 132.00 will target 134.20 fibonacci level next.
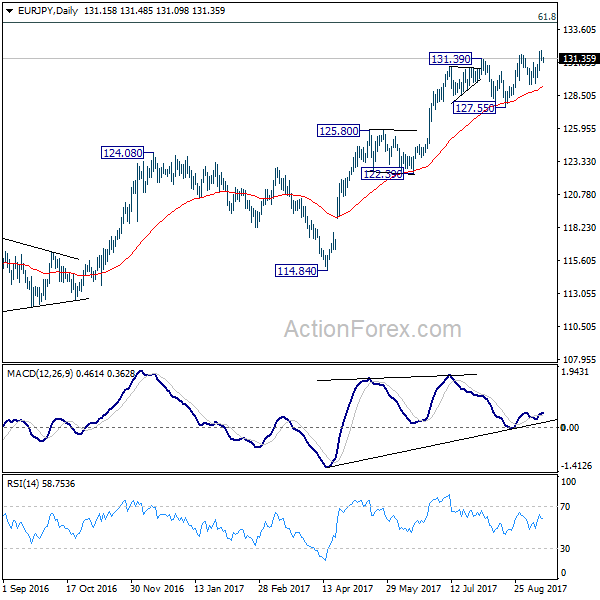
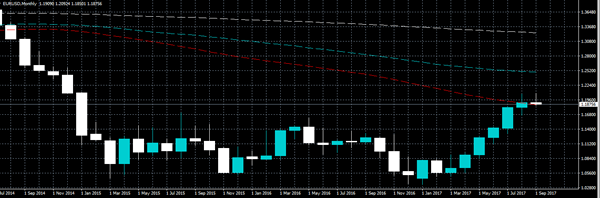
In the bigger picture, current rise from 109.03 is seen as at the same degree as the down trend from 149.76 (2014 high) to 109.03 (2016 low). as long as 124.08 resistance turned support holds, further rise is expected to 61.8% retracement of 149.76 to 109.03 at 134.20. Sustained break there will pave the way to key long term resistance zone at 141.04/149.76. However, firm break of 124.08 will argue that rise from 109.03 is completed and turn outlook bearish.
Trade Idea: EUR/JPY – Exit long entered at 131.35
EUR/JPY - 131.35
Original strategy:
Bought at 131.35, Target: 133.35, Stop: 130.75
Position: - Long at 131.35
Target: - 133.35
Stop: - 130.75
New strategy :
Exit long entered at 131.35,
Position: - Long at 131.35
Target: -
Stop:-
Despite rising to 132.01 earlier this week the subsequent retreat suggests consolidation below this level would be seen and near term downside risk has increased for correction to 130.91 support, break there would suggest a temporary top is possibly formed, bring further fall to 130.50-60 and later towards 130.25-30 but downside should be limited to this week’s low at 129.95, bring another rise later.
In view of this, would be prudent to exit long entered at 131.35 and stand aside for now. Above 131.60-65 would bring another rise to 132.01 but break there is needed to signal recent upmove has once again resumed and extend gain to 132.40-50, then towards 133.00-10, however, near term overbought condition should prevent sharp move beyond 133.50 and upside should be limited to 133.90-00.
Our latest preferred count is that wave (ii) is ABC-X-ABC which ended at 123.33 and wave (iii) is unfolding with wave iii ended at 100.77, followed by wave iv at 111.57 and wave v as well as the wave (iii) has ended at 97.04, followed by wave (iv) at 111.43 and wave (v) has ended at 94.12 which is also the end of the larger degree v, this also implied the major wave (C) has also ended there, hence major correction has commenced from there with (A) leg unfolding in its lower degree wave c which has possibly ended at 145.69. Under this count, A-B-C wave (B) has commenced with A leg ended at 136.23, wave B at 143.79 and wave C has possibly ended at 149.79.
Our larger degree count is that the decline from 139.26 is wave (C) and is sub-divided into a diagonal triangle i-ii-iii-iv-v with wave i - 105.44, wave ii- 123.33, wave iii - 97.03, wave iv - 111.43, followed by the final wave v as well as the end of wave (C) at 94.12, this also mark the bottom of larger degree wave B. Under this count, major rise in wave C has commenced as an impulsive wave with minor wave III ended at 145.69, wave V is still in progress for further gain to 150.00. Having said that, this so-called wave V could well be the first leg of larger degree 5-waver wave C and this wave C should bring at least a retest of wave A top at 169.97 (July 2008).
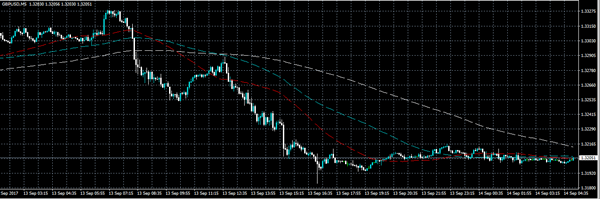
Pound Softens Ahead Of BOE Meeting
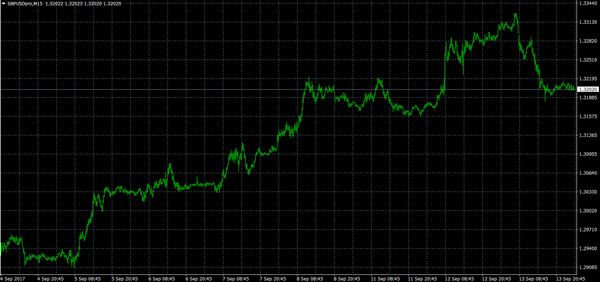
The British pound has corrected sharply lower against the U.S dollar, finding interim support at the 1.3183 level, ahead of today's key Bank of England interest rate decision and policy decision.
Yesterday saw a resurgence in greenback, as President Donald Trump promised to lower corporate tax rates. We also saw technical selling in the GBPUSD pair accelerate, after the 1.3252 level was broken.
The GBPUSD pair risks a deeper downside correction today, if the Bank of England appears to be more dovish, pushing back expectations of an upcoming interest rate hike.
Key intraday technical support is located at 1.3183, with critical weekly support at the September 12th price low, at 1.3160.
Below 1.3160, traders will look to the 1.3125 level, the weekly pivot point, at 1.3109, and the pairs 50-day moving average, at 1.3016.
To the upside, GBPUSD intraday resistance is located at the 100-hour moving average, at 1.3214, with further resistance at 1.3228.
Above the 1.3228 level, intraday resistance is located at the daily pivot point, at 1.3252, and the former swing price high, at 1.3289.
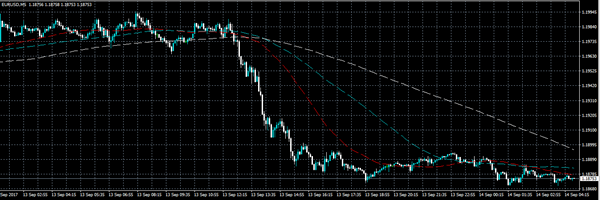
Euro Test Monthly Support
The EURUSD pair has moved sharply lower, after reports surfaced that the Trump administration is moving closer to finalizing a fifteen percent corporate tax rate, with plans to present the new taxation rate to congress on September 25th.
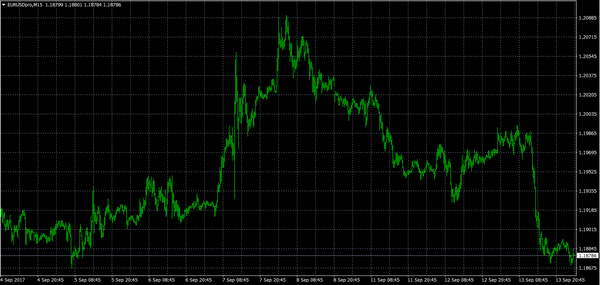
Price-action has so far found strong intraday technical support from the 1.1870 level, which represents the euro's monthly time frame, 50-period moving average.
The EURUSD pair remains under short-term selling pressure while trading below the key 1.1957 level, which is the euro's calculated daily pivot point and yesterday's range break-out zone.
Key intraday technical support below the 1.1870 level is located at the H4 time frame 200 period moving average, at 1.1852, and the 50-day moving average, at 1.1818.
To the upside, key technical resistance is located at 1.1890, and the September 12th price low, at 1.1926. The euro's 50-hour moving average offers critical intraday resistance, at the 1.1940 level.
Trade Idea: AUD/USD – Sell at 0.8090
AUD/USD – 0.8004
Original strategy:
Sell at 0.8090, Target: 0.7900, Stop: 0.8150
Position: -
Target: -
Stop:-
New strategy :
Sell at 0.8090, Target: 0.7900, Stop: 0.8150
Position: -
Target: -
Stop:-
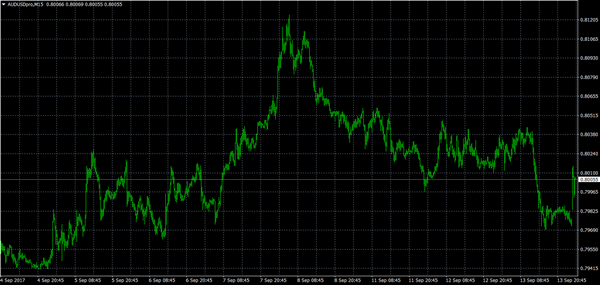
Although aussie dropped to as low as 0.7970, as the pair found support there and has rebounded, suggesting consolidation would be seen and corrective bounce to 0.8040-45 cannot be ruled out, however, as top has been formed at 0.8125, upside should be limited to 0.8090 and bring retreat later, below said support at 0.7963-70 would add credence to this view, bring retracement of recent rise to 0.7920-25 and later 0.7890-00 but support at 0.7867-71 should remain intact.
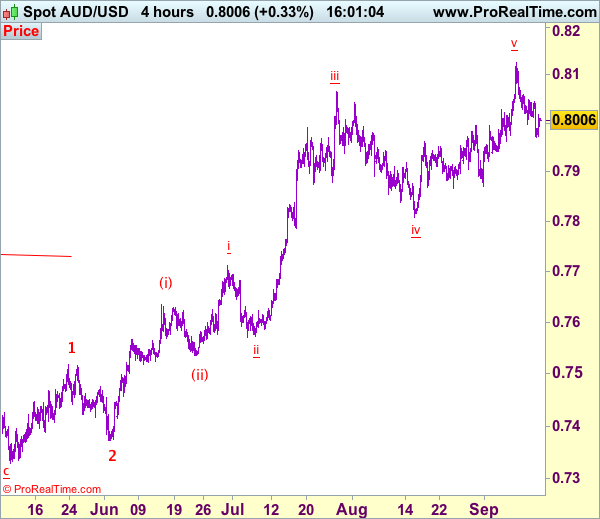
In view of this, we are looking to sell aussie on recovery as 0.8090-00 should limit upside. Above said resistance at 0.8125 would (last week’s high) would extend recent upmove in wave v of (iii) to 0.8150, then towards 0.8200, however, loss of upward momentum should prevent sharp move beyond 0.8225-30 and price should falter below 0.8250-60, risk from there is seen for a retreat later.
On the 4-hour chart, the move from 0.8066 is the wave 5 with i: 0.8860, ii: 0.8315, wave iii is an extended move ended at 1.0183, iv: 0.9706 and wave v has ended at 1.1081 (also the top of entire wave 5). The subsequent selloff is the major correction which is unfolding as ABC-X-ABC and 2nd A leg has ended at 0.8848, followed by a-b-c wave B which ended at 0.9758, hence, 2nd C wave is now in progress and indicated downside target at 0.7000 and 0.6950 had been met, so further fall to 0.6710-20 cannot be ruled out.
Bank Of England, US Data Drive Headlines Thursday
Monetary policy and economic data will keep investors busy on Thursday, as high-profile releases from both sides of the Atlantic are scheduled.
The Swiss National Bank (SNB) will deliver a policy decision at 07:30 GMT, where officials are widely expected to keep interest rates at -0.75%. The SNB slashed interest rates to -0.75% back in early 2015 and has remained on the sidelines ever since.
The Bank of England's policy meeting later in the day is expected to be more interesting, as officials continue to debate the pace and timing of future rate hikes. Although the BOE is widely expected to keep policy unchanged, at least two members of the Monetary Policy Committee (MPC) will likely vote in favour of raising interest rates.
Britain's central bank will deliver its rate decision at 11:00 GMT.
Key European data releases include French and Italian consumer inflation, as well as Greek unemployment.
In the United States, all eyes are on consumer inflation data, which are scheduled for release at 12:30 GMT. The consumer price index (CPI) is forecast to rise to 1.8% in the 12 months through August. So-called core inflation, which strips away volatile food and energy costs, is predicted to come in at 1.6%.
The Labor Department will also release its weekly jobless claims report at 08:30 GMT.
Earlier in the day, the Australian government reported that overall employment surged last month, a sign that the domestic economy was regaining momentum. Australian employers added 54,200 workers in August, the national statistics bureau reported Thursday. More importantly, full-time jobs climbed 40,100.
Meanwhile, China reported slower than expected growth for retail sales, industrial production and urban investment last month.
AUD/USD
The Australian dollar shot up after the stronger than expected jobs report to reach a session high of 0.8020 US. The AUD/USD was last up 0.3% at 0.8004. The pair is trading roughly 120 pips below its recent year-to-date high. The Aussie currency continues to struggle at the 80-cent level. This is likely to continue in the near term as the Reserve Bank of Australia conveys the potential downsides of a strong local currency.
EUR/USD
The euro fell nearly 100 pips against the dollar on Wednesday, extending last week’s correction. The EUR/USD continues to show upside momentum, but that could be disrupted by US inflationary data on Thursday. Solid CPI figures may compel the Federal Reserve to raise interest rates this year, thus helping to shore up the US dollar.
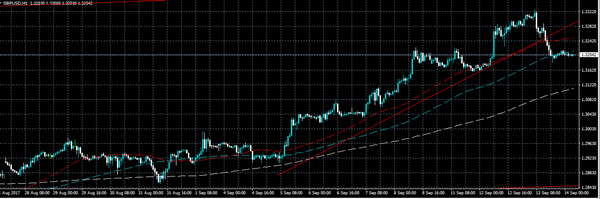
GBP/USD
Cable is down more than 100 pips from its 13 September high, which also happened to be the highest level of the year. The GBP/USD is currently trading just above the 1.3200 level. Price activity is expected to remain limited ahead of the BOE rate decision.
Can Gold Price Hold This Important Support Vs US Dollar?
Key Highlights
- Gold price after trading towards $1360 against the US Dollar made a short-term top.
- At the moment, the price is trading near a major support near $1320 on the 4-hours chart.
- China's Retail Sales in August 2017 posted an increase of 10.1% (YoY), less than the forecast of +10.5%.
- China's Industrial output in August 2017 posted an increase of 6% (YoY), less than the forecast of +6.6%.
Gold Price Technical Analysis
Gold price was in a super uptrend from the $1260-1265 levels against the US Dollar. The price recently traded as high as $1357, started a correction and currently trading near a major support.
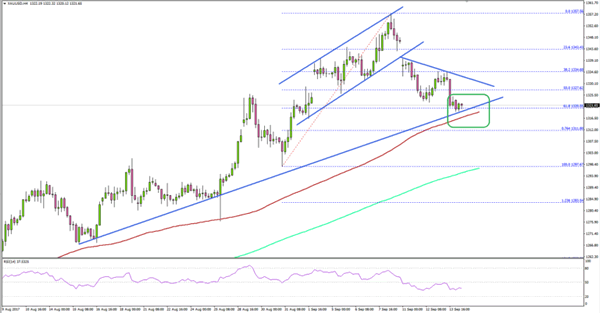
As mentioned, after trading as high as $1357.56, the price started correcting lower. It moved below the 50% Fib retracement level of the last wave from the $1297 low to $1357 high, which is a short-term bearish sign.
At the outset, the price is currently near a crucial bullish trend line with support near $1320 on the 4-hours chart. The stated $1320 support is also positioned above the 100 simple moving average (H4).
Therefore, the $1320 level holds a lot of importance for the current trend. A break and close below it could take the price back towards the next support at $1300. On the upside, there is a connecting bearish trend line at $1330, which is a short-term resistance.
China's Retail Sales and Industrial Production
Today, China saw a couple of important releases like the Retail Sales and Industrial output by the National Bureau of Statistics of China. The forecast was lined up for an increase in the Retail Sales by 10.5% in August 2017 compared with the month a year ago.
However, the actual result was on the lower side, as the Retail Sales grew 10.1%, which was also less than the last 10.4%. Similarly, the Industrial output was lined up for an increase of 6.6% in August 2017 compared with the month a year ago.
The actual was disappointing, as the increase was 6%, less than the last +6.4%. The Urban investment also posted a lower reading of +7.8%, less than the forecast of +8.2%.
Overall, Gold price might correct a few points towards $1330, but it remains at a risk of further corrections.
EUR/GBP Daily Outlook
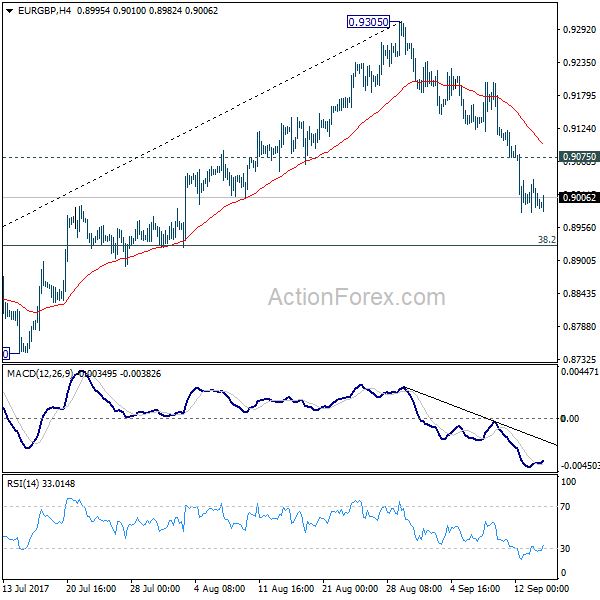
Daily Pivots: (S1) 0.8973; (P) 0.9006; (R1) 0.9029; More
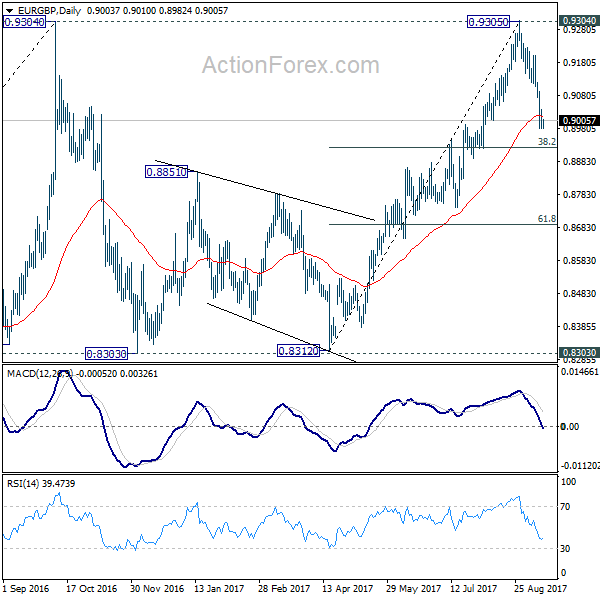
With 0.9073 minor resistance intact, intraday bias in EUR/GBP remains on the downside for 38.2% retracement of 0.8312 to 0.9305 at 0.8926 first. Fall from 0.9305 is likely the third leg of the consolidation from 0.9304. Break of 0.8926 will target 61.8% retracement at 8691 and below. On the upside, above 0.9075 minor resistance will turn intraday bias neutral first.
In the bigger picture, price actions from 0.9304 are viewed as a medium term corrective pattern. It's uncertain whether it is finished yet. But in case of another fall, we'd expect strong support from 0.8116 cluster support (50% retracement of 0.6935 to 0.9304 at 0.8120) to contain downside and bring rebound. Whole up trend from 0.6935 is expected to resume after consolidation from 0.9304 completes. Firm break of 0.9799 high will target 61.8% projection of 0.5680 to 0.9799 from 0.6935 at 1.1054.
EUR/AUD Daily Outlook
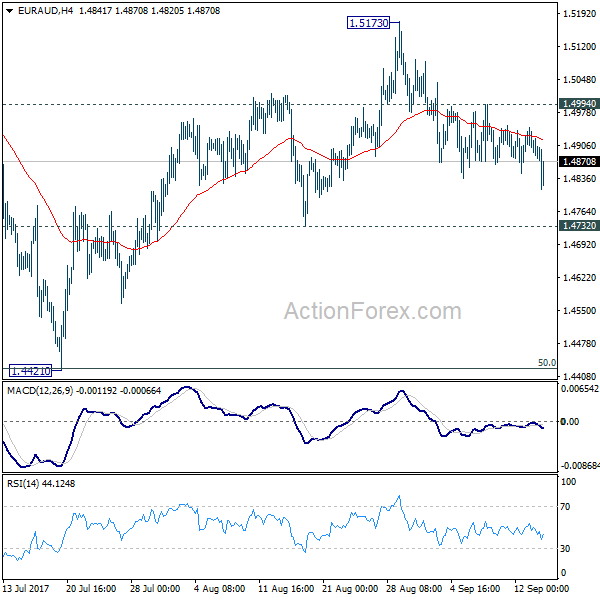
Daily Pivots: (S1) 1.4859; (P) 1.4901; (R1) 1.4925; More....
EUR/AUD dips mildly today and further fall is expected to 1.4732 support next. Decisive break there will confirm that fall from 1.5173 is the third leg of consolidation pattern from 1.5226. In that case, further fall should be seen to 1.4421 again. But we'd expect strong support from there to contain downside and bring rebound. On the upside, above 1.4994 minor resistance will turn bias back to the upside for 1.5173/5226 resistance zone instead.
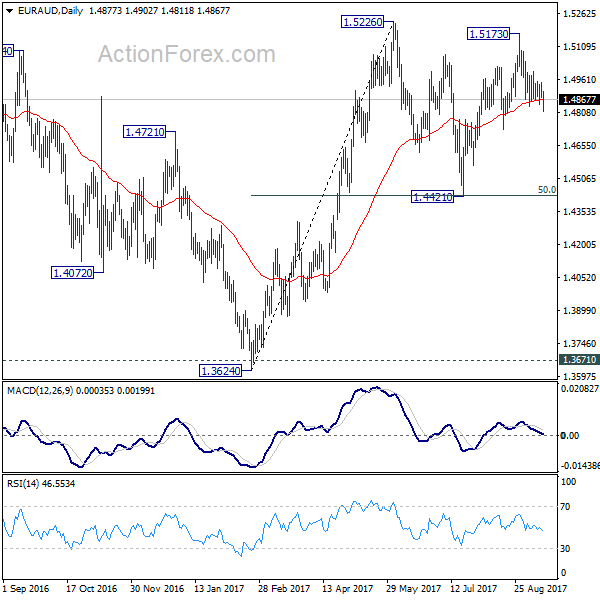
In the bigger picture, we're holding on to the view that corrective decline from 1.6587 medium term has completed at 1.3624. Rise from 1.3624 is expected to extend to retest 1.6587. The corrective structure of the price actions from 1.5226 is affirming this view. Above 1.5226 will target a test on 1.6587 key resistance. However, break of 1.4421 support will dampen our view and would drag EUR/AUD lower to retest key support zone around 1.3624.