
Sample Category Title
Trade Idea : GBP/USD – Sell at 1.3285 or Buy at 1.3140
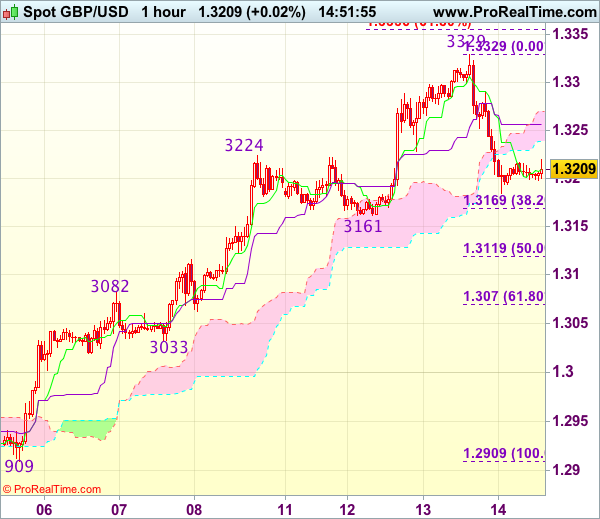
GBP/USD - 1.3209
Most recent candlesticks pattern : N/A
Trend : Near term up
Tenkan-Sen level : 1.3209
Kijun-Sen level : 1.3257
Ichimoku cloud top : 1.3269
Ichimoku cloud bottom : 1.3238
Original strategy :
Sell at 1.3285, Target: 1.3185, Stop: 1.3320
O.C.O.
Buy at 1.3160, Target: 1.3260, Stop: 1.3125
Position : -
Target : -
Stop : -
New strategy :
Sell at 1.3285, Target: 1.3185, Stop: 1.3320
O.C.O.
Buy at 1.3140, Target: 1.3250, Stop: 1.3105
Position : -
Target : -
Stop : -
As cable has remained under near term pressure, adding credence to our view that a temporary top has been formed at 1.3329 yesterday, hence consolidation with downside bias is seen for correction to 1.3180-85, then towards support at 1.3161, however, near term oversold condition should limit downside to 1.3130-35 and bring recovery later to the Kijun-Sen (now at 1.3257) and then towards resistance at 1.3290 but price should falter well below said resistance at 1.3329, bring another corrective decline later.
In view of this, whilst we are still looking to buy cable on further corrective fall, we would sell sterling on recovery as said resistance at 1.3290 should cap upside, bring another corrective decline later. Only break of said resistance at 1.3329 would abort and signal recent upmove is still in progress for headway to 1.3355-60 (61.8% projection of 1.2909-1.3224 measuring from 1.3161).
Daily Technical Outlook And Review: EUR/USD, GBP/USD, AUD/USD, USD/JPY, USD/CAD, USD/CHF, DOW 30, GOLD
A note on lower timeframe confirming price action...
Waiting for lower timeframe confirmation is our main tool to confirm strength within higher timeframe zones, and has really been the key to our trading success. It takes a little time to understand the subtle nuances, however, as each trade is never the same, but once you master the rhythm so to speak, you will be saved from countless unnecessary losing trades. The following is a list of what we look for:
- A break/retest of supply or demand dependent on which way you're trading.
- A trendline break/retest.
- Buying/selling tails ... essentially we look for a cluster of very obvious spikes off of lower timeframe support and resistance levels within the higher timeframe zone.
- Candlestick patterns. We tend to only stick with pin bars and engulfing bars as these have proven to be the most effective.
We typically search for lower-timeframe confirmation between the M15 and H1 timeframes, since most of our higher-timeframe areas begin with the H4. Stops are usually placed 1-3 pips beyond confirming structures.
EUR/USD
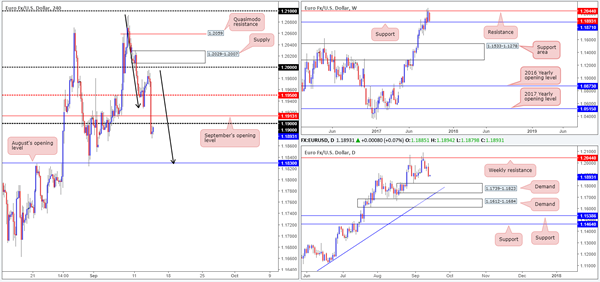
Across the board, the US dollar rallied against the majority of its trading peers on Wednesday amid tax reform talks, consequently pushing the single currency south. After crushing the 1.19 handle, the pair ended the day bottoming around the 1.1873 mark.
With yesterday's aggressive slide, technical traders are likely watching for September's opening level at 1.1913/1.19 handle to hold firm as resistance. Should this come to fruition, all eyes will likely then be on August's opening line at 1.1830, which happens to not only be positioned a few pips above daily demand at 1.1739-1.1823, it also converges with a H4 AB=CD bullish formation (see black arrows). However, for price to sell off and reach 1.1830, weekly support at 1.1871 would need to be weakened.
Suggestions: We feel the best thing to do right now is be patient. It would, in our technical view, be unwise to attempt a sell at 1.1913/1.19 when weekly price is so near to support. Should price push lower and challenge 1.1830, however, then great, we have a high-probability buy zone to trade. If not, we could see the unit extend back up to the mid-level point 1.1950 or quite possibly the large number 1.20.
Data points to consider: US Inflation figures and US Unemployment claims at 1.30pm GMT+1.
Levels to watch/live orders:
- Buys: 1.1830 region ([waiting for a H4 bullish candle to form – preferably in the shape of a full, or near full-bodied candle – is advised] stop loss: ideally beyond the candle's tail).
- Sells: Flat (stop loss: N/A).
GBP/USD:
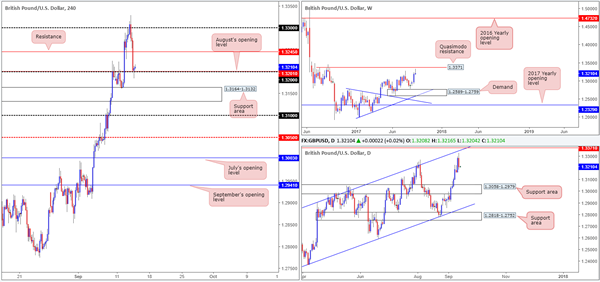
Disappointing UK employment data (+2.1% versus +2.3% expected) sent the British pound lower in early trading on Wednesday. This – coupled with a robust dollar eventually saw the pair challenge the 1.32 handle going into the closing bell. Meanwhile, over on the bigger picture, weekly price found a ceiling around 1.3328 ahead of the Quasimodo resistance level at 1.3371. Similarly, down on the daily chart price turned ahead of the channel resistance extended from the high 1.2903.
Suggestions: With cable supported by 1.32 right now, it's possible the unit will look to retest H4 resistance at 1.3245 today. This level has a high probability of bouncing price as it is effectively an ignored Quasimodo line. Be that as it may, we believe this is still a somewhat risky short for two reasons. Firstly, higher-timeframe action may look to push higher to connect with the said resistances. Secondly, we do not see much additional confirmation around the 1.3245 area. Well, not enough for us to place capital on the line anyway!
So, with the above notes in mind, we will remain flat for now.
Data points to consider: BoE takes the stage at 12pm. US Inflation figures and US Unemployment claims at 1.30pm GMT+1.
Levels to watch/live orders:
- Buys: Flat (stop loss: N/A).
- Sells: Flat (stop loss: N/A).
AUD/USD
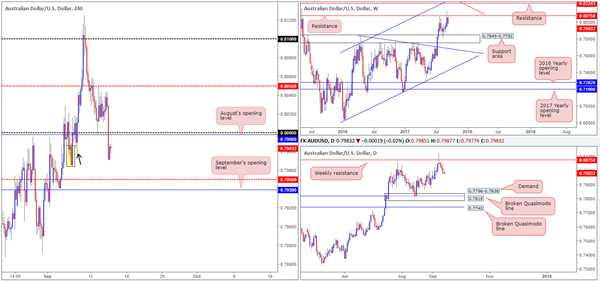
In recent trading, the commodity currency stormed through the key 0.80 handle/August's opening level at 0.7998. The move, influenced by US tax reform talks, saw the pair bottom at 0.7970.
For those who read Wednesday's report you may recall us highlighting possible shorting opportunities should a decisive H4 close be seen beyond 0.80. This is due to a couple of reasons:
Weekly price currently trading from resistance at 0.8075, which shows room to extend as far down as the support area pegged at 0.7849-0.7752.
Beyond 0.80, we believe the pair could end up trading as low as September's opening level at 0.7939. This is simply because there's a high probability that the H4 demand painted in yellow at 0.7965-0.7988 has already had its orders taken by the H4 tail seen marked with a black arrow at 0.7974.
Suggestions: A retest of 0.80, coupled with a H4 bearish candle (preferably in the form of a full, or near-full-bodied candle) would, in our view, be enough to warrant an intraday sell down to at least the 0.7950 neighborhood.
Data points to consider: Australian Employment figures at 2.30am, Chinese Industrial production at 3am. US Inflation figures and US Unemployment claims at 1.30pm GMT+1.
Levels to watch/live orders:
- Buys: Flat (stop loss: N/A).
- Sells: 0.80 region ([waiting for a H4 bearish candle to form – preferably in the shape of a full, or near full-bodied candle – is advised] stop loss: ideally beyond the candle's wick).
USD/JPY
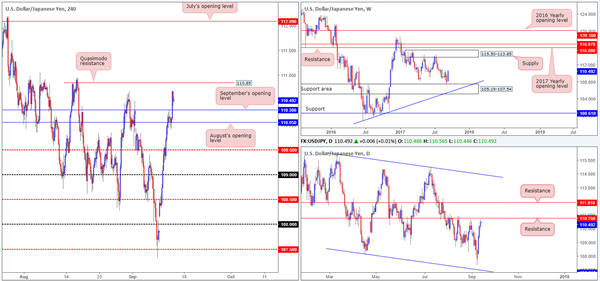
Propelled by recent US tax reform talks, the USD/JPY ripped through offers positioned at September's opening level drawn from 110.30. As you can see, this has opened up the path north for the H4 candles to test the Quasimodo resistance at 110.85. Also of particular interest, daily price is now trading within touching distance of resistance registered at 110.76. On the other side of the coin, however, weekly price is seen rallying from a support area penciled in at 105.19-107.54.
Suggestions: Watch the H4 Quasimodo resistance at 110.85 for a potential sell trade. We like this level because it sits just above daily resistance at 110.76. However, in view of weekly bulls trading from a support area, additional candle confirmation would be required before a trade can be initiated from here. Should this come to realization, we would likely be looking to trail the position down to 110.30 as an initial take-profit zone.
Data points to consider: US Inflation figures and US Unemployment claims at 1.30pm GMT+1.
Levels to watch/live orders:
- Buys: Flat (stop loss: N/A).
- Sells: 110.85 region ([waiting for a H4 bearish candle to form – preferably in the shape of a full, or near full-bodied candle – is advised] stop loss: ideally beyond the candle's wick).
USD/CAD
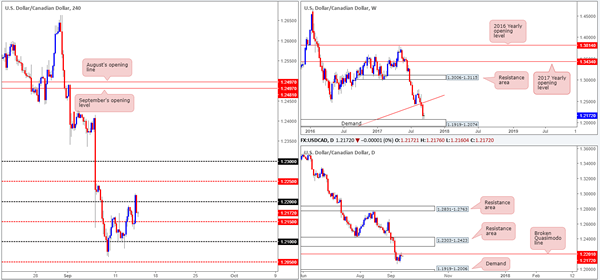
On Wednesday, we set a pending sell order at 1.22 with a stop-loss order positioned 20 pips above at 1.2220. Our basis for the trade was not only the round number, but also a H4 38.2% Fib resistance at 1.22, a daily broken Quasimodo line at 1.2201 and a H4 AB=CD bearish formation topping at 1.22. Unfortunately, our stop was taken out at the pip before turning lower. It's frustrating, but this happens.
Although weekly price recently connected with demand printed at 1.1919-1.2074, we still have a bearish bias towards this market. Not only because of the current daily broken Quasimodo line mentioned above at 1.2201, but also because of the pair's strong downtrend since May.
Suggestions: To become sellers, a H4 close beyond the mid-level support at 1.2150 is required. To our way of seeing things, this will help confirm bull weakness at the current weekly demand, and at the same time demonstrate bearish intent from the daily broken Quasimodo resistance. A retest at 1.2150, coupled with a lower-timeframe sell signal (see the top of this report), would be sufficient enough to trade short, targeting 1.21 as an INITIAL take-profit zone.
Data points to consider: US Inflation figures and US Unemployment claims at 1.30pm GMT+1.
Levels to watch/live orders:
- Buys: Flat (stop loss: N/A).
- Sells: Watch for H4 price to engulf 1.2150 and then look to trade any retest seen thereafter ([waiting for a lower-timeframe sell signal to form following the retest is advised] stop loss: dependent on where one confirms this level).
USD/CHF:
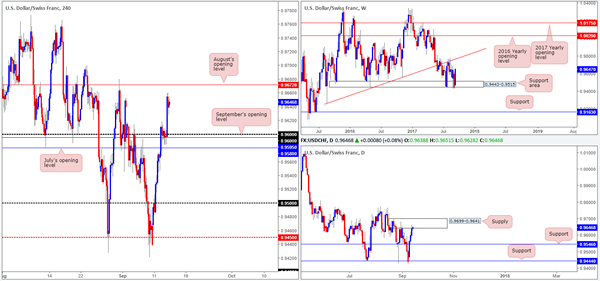
After finding support at September's opening level/0.96 handle at 0.9595/0.96 on Wednesday, the safe-haven pair extended gains to a high of 0.9659 on tax reform news. Filling the prior week's weekend gap, the H4 chart shows price now trading within a few pips of August's opening line at 0.9672. From a technical perspective, this week's advance has largely been due to the weekly support area coming in at 0.9443-0.9515. However, with daily supply at 0.9699-0.9641 now in the fight, a bearish presence may come into view.
Suggestions: Initial thinking brings us to August's opening level for possible selling opportunities, given that it is fixed within the aforementioned daily supply. There are, however, a few cautionary points to consider:
Weekly buying pressure seen from the current support area.
The daily supply may be weak due to it having already been tested.
There is little H4 confluence seen around August's opening level.
While August's opening level may very well hold price lower today, we feel it is just too much of a risk at the moment.
Data points to consider: US Inflation figures and US Unemployment claims at 1.30pm. SNB Interest-rate statement at 8.30am GMT+1.
Levels to watch/live orders:
- Buys: Flat (stop loss: N/A).
- Sells: Flat (stop loss: N/A).
DOW 30
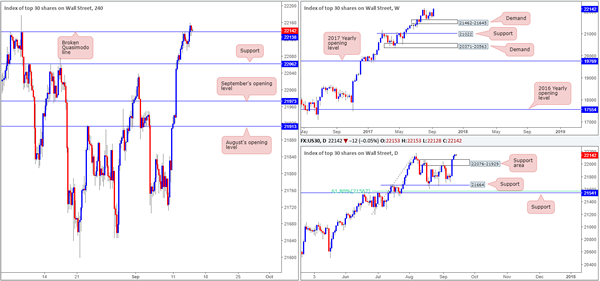
The DOW, as you can see on the H4 chart, edged its way above the Quasimodo resistance at 22138 on Wednesday and has maintained a bullish footing. As highlighted in yesterday's report, we believe this H4 barrier was the last remaining resistance stopping the index from achieving fresh record highs. So, with this line out of the picture and currently holding as a support, a long from here is high probability, in our opinion.
Suggestions: Keeping it nice and simply today, we're going to watch how H4 action responds at 22138 given that it is now support. To become a buyer, a H4 bullish candle needs to be seen, preferably in the shape of a full, or near-full-bodied candle. The beautiful thing about this setup is that there is effectively no clear take-profit target, meaning that we could potentially join, what seems to be, the never-ending bull run.
Data points to consider: US Inflation figures and US Unemployment claims at 1.30pm GMT+1.
Levels to watch/live orders:
- Buys: 22138 region ([waiting for a reasonably sized H4 bullish candle to form – preferably a full, or near-full-bodied candle – is advised] stop loss: ideally beyond the candle's tail).
- Sells: Flat (stop loss: N/A).
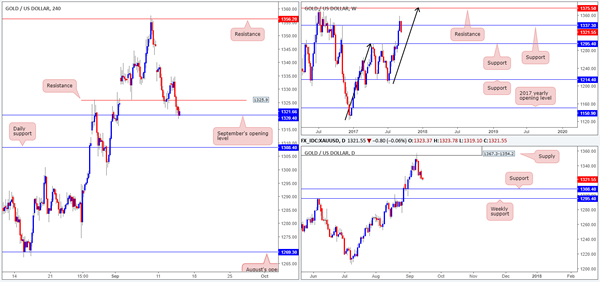
GOLD
The yellow metal, as you can see, failed to sustain Tuesday's gains on Wednesday. After topping at 1334.5, the unit headed south on strong dollar buying due to recent news on a US tax reform. H4 flow ran through bids at support drawn from 1325.9 and went on to challenge September's opening level coming in at 1320.4.
While there is absolutely no higher-timeframe support structures in view at the moment (the closest is daily support logged at 1308.4), the odds of a push lower is strong, right? While there is a chance that gold could push lower, it might be worth noting that the USDX weekly chart shows price trading around resistance at 11854. For those who do not know, there exists an inverse correlation between these two markets. Therefore, should US weekly candles hold firm at resistance and push lower, this could see the metal bid higher.
Suggestions: With the above notes taken on board, we feel it's too much of a risk to buy at this point. Nevertheless, a H4 close back above the H4 resistance at 1325.9 would, for us at least, confirm upside strength. And as such, this could be used as an entry trigger to long gold given the position of US weekly price at the moment.
Levels to watch/live orders:
- Buys: Watch for H4 price to engulf 1325.9 and then look to trade any retest seen thereafter (stop loss: ideally beyond the rejection candle's tail).
- Sells: Flat (stop loss: N/A).
Daily Technical Analysis: USD/JPY Bullish Momentum Faces Strong 111 Resistance Zone
Currency pair USD/JPY
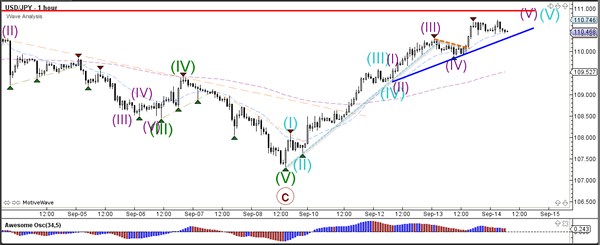
The USD/JPY bullish momentum broke above the resistance trend line (dotted brown) but price has a strong horizontal resistance level nearby (red). Price seems to be building 5 (blue) bullish waves within wave 1 or wave A.
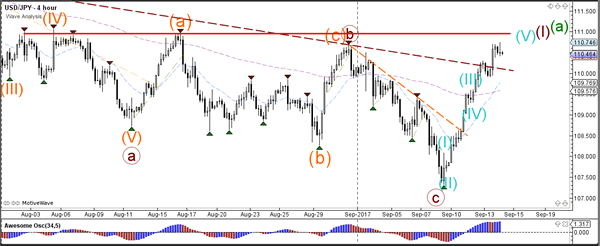
The USD/JPY is showing strong bullish momentum and is building 5 extended waves (purple). A break below support could indicate the start of a bearish correction.
Currency pair EUR/USD
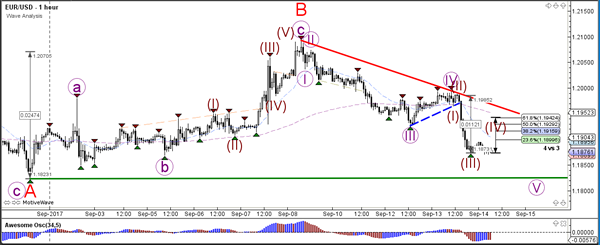
The EUR/USD broke below the support trend line (dotted blue) and extended the bearish price action. The wave structure is most likely indicating a wave C (red) within a larger wave 4 (blue). The Fibonacci levels of wave C vs A are most likely bouncing spots for further upside.
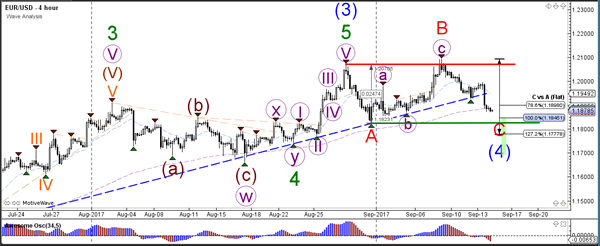
The EUR/USD broke below the minor support (dotted blue) and price is building 5 internal waves (brown) within wave 5 (purple). Price could bounce at the previous bottom (green line) of wave A for instance. A break of resistance (red) could indicate the start of a new uptrend.
Currency pair GBP/USD
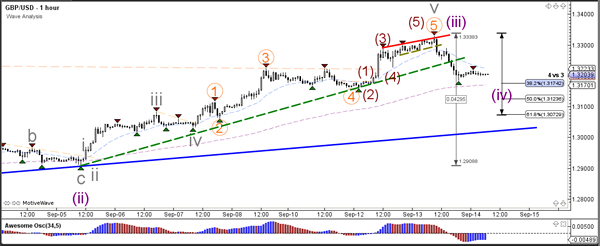
The GBP/USD broke below the support trend line (dotted green) and completed the 3rd wave (purple). Price could now be in a potential wave 4 (purple) retracement which could bounce at the Fibonacci levels of wave 4 vs 3.
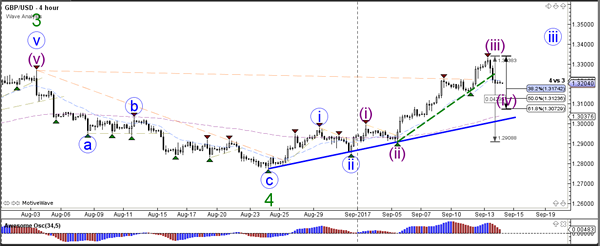
The GBP/USD did indeed complete multiple waves 5 at around 1.33. The retracement has broken below multiple support levels (dotted green) and is now testing the Fibonacci levels.
Trade Idea : EUR/USD – Sell at 1.1940 or buy at 1.1855
EUR/USD - 1.1887
Most recent candlesticks pattern : N/A
Trend : Near term down
Tenkan-Sen level : 1.1880
Kijun-Sen level : 1.1931
Ichimoku cloud top : 1.1978
Ichimoku cloud bottom : 1.1968
Original strategy :
Sell at 1.1940, Target: 1.1840, Stop: 1.1975
Position : -
Target : -
Stop : -
New strategy :
Sell at 1.1940, Target: 1.1840, Stop: 1.1975
O.C.O.
Buy at 1.1855, Target:1.1955, Stop: 1.1820
Position : -
Target : -
Stop : -
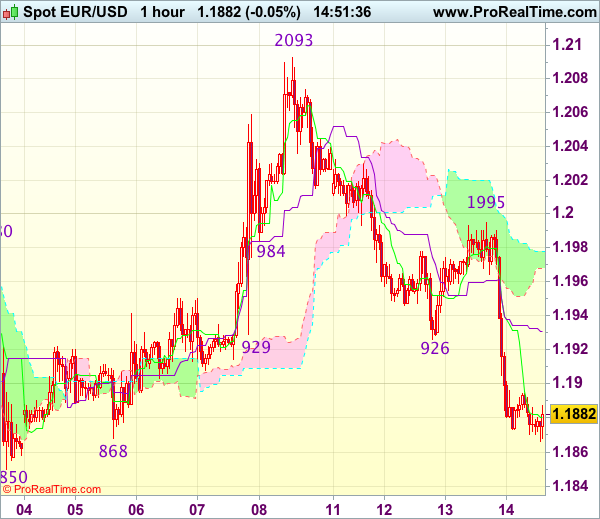
As the single currency has remained under pressure after yesterday’s selloff from 1.1995, adding credence to our view that the decline from 1.2093 top is still in progress, hence downside bias remains for this move to bring retracement of early upmove to 1.1850 support, however, loss of near term downward momentum would limit downside and reckon another previous support at 1.1823 would hold, bring rebound later.
In view of this, whilst we are still looking to sell euro on recovery, we are inclined to turn long on next decline as 1.1850 support should hold. Below 1.1823 would extend weakness to 1.1800 but still reckon downside would be limited. Above the Ichimoku cloud top (now at 1.1978) would abort and signal low is formed instead, bring a stronger rebound to said resistance at 1.1995 first.
European Open Briefing: Asian Equity Markets Were Mostly Flat On Thursday
Global Markets:
- Asian stock markets: Nikkei lost 0.31 %, Shanghai Composite fell 0.17 %, Hang Seng down 0.47 %, ASX 200 fell 0.11 %
- Commodities: Gold at $1326.79 (-0.09 %), Silver at $17.78 (-0.45 %), WTI Oil at $49.23 (-0.14 %), Brent Oil at $55.02 (-0.25%)
- Rates: US 10-year yield at 2.18, UK 10-year yield at 1.14, German 10-year yield at 0.40
News & Data:
- (AUD) Employment Change 54.2 vs 17.5 K expected
- (AUD) Unemployment Rate 5.6 % vs 5.6 % expected
- (CNY) Industrial Production y/y 6.0 % vs 6.6 % expected
- (CNY) Fixed Asset Investment ytd/y 7.8 % vs 8.2 % expected
- (USD) PPI m/m 0.2 % vs 0.3 % expected
- (USD) Core PPI m/m 0.1 % vs 0.2 % expected
- (USD) Crude Oil Inventories 5.9 M vs 4.1 M expected
- (GBP) Average Earnings Index 3m/y 2.1 % vs 2.3 % expected
- (GBP) Claimant Count Change -2.8 K vs 0.8 K expected
- (GBP) Unemployment Rate 4.3 % vs 4.4 % expected
- (CHF) PPI m/m 0.3 % vs 0.2 % expected
Markets Update:
Asian Equity markets were mostly flat on Thursday trading down from 10-year highs after disappointing economic data out of China and investors awaiting a rate decision from the Bank of England. Markets also digested the rise in U.S. Treasury yields overnight following tax reform headlines out of Washington, although the dollar's advance paused.
USD/JPY is currently seen trading at 110.45 down from the highs of 110.70. The pair had a very small dip in late NY/early Asia with NBC tweeting that North Korea was seen to be prepping for a missile launch. However, the dollar continues to extend gains against the Yen, gaining over 0.3 percent on Wednesday.
The Australian Dollar had a very active session, following a slight drop towards 0.7970 ahead of the Jobs report, the Aussie jumped as high as 0.8016 against the US Dollar after positive jobs data. AUDUSD is currently seen trading at around 0.8000 losing some of its earlier gains as Movements in the Aussie dollar are influenced by China data due to Australia's dependence on exports.
EUR/USD is currently seen trading at 1.1875 losing around 0.1 percent earlier in the session, following a 0.7 percent drop the previous day. The dollar index measured against a basket of six major currencies is currently valued at 92.47 after touching 92.530 overnight, its highest since Sept. 5.
Upcoming Events:
- 07:30 GMT – (CHF) Libor Rate
- 07:30 GMT – (CHF) SNB Monetary Policy Assessment
- 11:00GMT – (GBP) MPC Official Bank Rate Votes
- 11:00GMT – (GBP) Monetary Policy Summary
- 11:00GMT – (GBP) Official Bank Rate
- 12:30 GMT – (USD) CPI m/m
- 12:30 GMT – (USD) Core CPI m/m
- 12:30 GMT – (USD) Unemployment Claims
- 15:30 GMT – (EUR) German Buba President Weidmann Speaks
- 22:30 GMT – (NZD) Business NZ Manufacturing Index
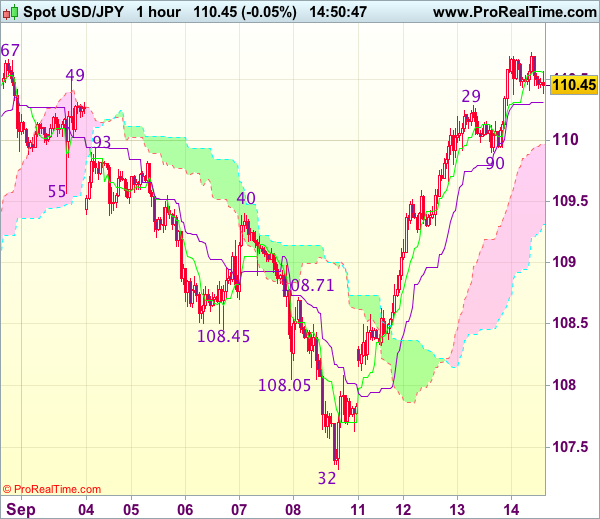
Trade Idea : USD/JPY – Buy at 109.65
USD/JPY - 110.45
Most recent candlesticks pattern : N/A
Trend : Up
Tenkan-Sen level : 110.56
Kijun-Sen level : 110.32
Ichimoku cloud top : 109.96
Ichimoku cloud bottom : 109.31
Original strategy :
Buy at 109.65, Target: 110.65, Stop: 109.30
Position : -
Target : -
Stop : -
New strategy :
Buy at 109.65, Target: 110.65, Stop: 109.30
Position : -
Target : -
Stop : -
As the greenback has maintained a firm undertone after this week’s rally, suggesting bullishness remains for the rise from 107.32 low to extend further gain towards previous resistance at 110.95-05, however, break there is needed to retain upside bias and encourage for headway to 111.30, having said that, near term overbought condition should prevent sharp move beyond another previous resistance at 111.71, bring retreat later.
In view of this, would not chase this rise here and would be prudent to buy dollar on subsequent pullback as 109.50-60 should limit upside. Below previous resistance at 109.40 would risk test of the lower Kumo (now at 109.31) but only break there would abort and signal top is formed instead, bring weakness to 109.00 first.
BoE Preview
The Bank of England faces a dilemma when it meets on Thursday between getting inflation in check and supporting the flagging post-Brexit economy.
With the central bank significantly overshooting its 2% inflation target – CPI rose to 2.9% in August – the answer may appear simple but with policy makers divided, that is clearly not the case.
The depreciation of sterling has played a major role in the inflation rise over the last year and with the currency having bottomed last October, it is plausible that once the base effects drop out of the annual comparison, inflation will fall closer to target. But can policy makers rely on that?
As we can see from recent voting, there is a growing belief that this cannot be relied upon. The important question therefore becomes, will enough policy makers decide they can't rely on it before the data starts to correct itself?
With only two policy makers – Ian McCafferty and Michael Saunders – having voted at the previous meeting to raise interest rates and a ninth member having since joined the Monetary Policy Committee, it seems unlikely that the hike threshold will be passed this week.
That said, the pound did not necessarily rally over the last couple of weeks on the expectation that the BoE will raise interest rates on Thursday, rather on the expectation that it is getting closer. The inflation reading on Tuesday further fuelled the expectation while Wednesday's wage data tempered it slightly.
What Can We Expect on Thursday?
While a rate hike at the meeting is very unlikely, central banks have surprised us in the past and given how other central banks (ECB, Bank of Canada) are exploring tighter monetary policy, it remains a possibility, albeit a small one I would say.
What traders are most interested in is what impact the August inflation number had on those policy makers that have been borderline hike voters but remained with the majority until now. There is also one new policy maker on the committee this month – Sir David Ramsden – and another that only joined in July – Silvana Tenreyro – who's views we still know little about.
It may not take as much as we thought to sway the vote in favour of a rate hike, at which point I would expect to see a sharp move higher in the pound, as that is not priced in.
What's more likely is the voting will either be unchanged – with only McCafferty and Saunders voting for a hike – or perhaps one more policy maker will join them. This may even be enough to provide some upside for the pound in the near term.
The minutes will be of interest to traders, particularly if they allude to inflation becoming a concern to policy makers or some policy makers being tempted to vote for a hike. That would suggest any further uptick in inflation going forward could result in higher rates.
Australia’s Unemployment Rate Remained Steady In August, Job Growth Surged The Most In Nearly 2 Years In The Same...
For the 24 hours to 23:00 GMT, the AUD declined 0.42% against the USD and closed at 0.7985.
LME Copper prices declined 1.1% or $74.5/MT to $6527.0/MT. Aluminium prices traded flat at $2083.0/MT.
In the Asian session, at GMT0300, the pair is trading at 0.8005, with the AUD trading 0.25% higher against the USD from yesterday's close, following robust Australian jobs report.
Early morning data indicated that Australia's seasonally adjusted unemployment rate remained unchanged at 5.6% in August, meeting market expectations. Further, the number of people employed in Australia climbed by 54.2K in August, recording the biggest jump since October 2015 and following a revised advance of 29.3K in the previous month. Meanwhile, markets had anticipated the number of people employed to advance 20.0K.
On the contrary, the nation's consumer inflation expectations declined to 3.8% in September, after recording a level of 4.2% in the previous month.
Elsewhere in China, Australia's largest trading partner, industrial production climbed 6.0% on an annual basis in August, rising at its weakest pace in nine months and undershooting market expectations for a rise of 6.6%. In the previous month, industrial production had recorded a rise of 6.4%. Moreover, the nation's retail sales posted its slowest rise in six months, after it climbed 10.1% YoY in August, compared to market consensus for a rise of 10.5%. In the previous month, retail sales had recorded a rise of 10.4%.
The pair is expected to find support at 0.7969, and a fall through could take it to the next support level of 0.7934. The pair is expected to find its first resistance at 0.8042, and a rise through could take it to the next resistance level of 0.8080.
The currency pair is showing convergence with its 20 Hr moving average and trading below its 50 Hr moving average.

Euro-Zone’s Industrial Output Rebounded As Expected In August
For the 24 hours to 23:00 GMT, the EUR declined 0.65% against the USD and closed at 1.1893.
On the data front, the Euro-zone's seasonally adjusted industrial production rebounded 0.1% MoM in July, meeting market expectations and following a sharp drop of 0.6% in the previous month.
Separately, Germany's final consumer price index (CPI) registered a rise of 1.8% on an annual basis in August, confirming the preliminary print. The CPI had risen 1.7% in the previous month.
Data released in the US indicated that mortgage applications rose 9.9% in the week ended 08 September, jumping to its strongest level in 10 months and following a gain of 3.3% in the prior week. Further, the nation's producer prices rose slightly less-than-expected by 0.2% on a monthly basis in August, compared to a drop of 0.1% in the prior month. Meanwhile, the nation's budget deficit widened less-than-anticipated to a level of $108.0 billion in August, compared to market consensus for a deficit of $119.5 billion. The nation had registered a budget deficit of $42.9 billion in the previous month.
In the Asian session, at GMT0300, the pair is trading at 1.1878, with the EUR trading 0.13% lower against the USD from yesterday's close.
The pair is expected to find support at 1.1834, and a fall through could take it to the next support level of 1.1791. The pair is expected to find its first resistance at 1.1958, and a rise through could take it to the next resistance level of 1.2039.
Amid no major macroeconomic releases in the Euro-zone today, investors will focus on the US consumer inflation for August and weekly initial jobless claims data, both due to release later in the day.
The currency pair is trading below its 20 Hr and 50 Hr moving averages.

UK’s Unemployment Rate Lowest Since 1975 In The Three Months Through July But Wage Growth Remained Sluggish In The...
For the 24 hours to 23:00 GMT, the GBP declined 0.61% against the USD and closed at 1.3215, after the latest labour market report painted a bleak picture of Britain's wage growth.
Data showed that UK's average earnings including bonus recorded a rise of 2.1% on an annual basis in the three months to July, falling short of market consensus for an advance of 2.3%, thus suggesting that consumers might further retrench as earnings have failed to keep pace with rising inflation. The average earnings including bonus had registered a rise of 2.1% in the April-June period.
However, the nation's ILO unemployment rate unexpectedly eased to 4.3% in the May-July 2017 period, dropping to its lowest level in forty-two years, while markets were expecting the ILO unemployment rate to remain steady at 4.4%. Further, the number of people employed in the nation advanced more-than-anticipated by 181.0K in the three months through July, rising by the most since the end of 2015. Market participants had envisaged for an increase of 154.0K, after registering a gain of 125.0K in the April-June period.
In the Asian session, at GMT0300, the pair is trading at 1.3203, with the GBP trading 0.09% lower against the USD from yesterday's close.
Overnight data revealed that the nation's RICS house price balance surprisingly climbed to 6.0 in August, compared to market expectations for a flat reading. House price balance had recorded a level of 1.0 in the previous month.
The pair is expected to find support at 1.3149, and a fall through could take it to the next support level of 1.3095. The pair is expected to find its first resistance at 1.3293, and a rise through could take it to the next resistance level of 1.3383.
Trading trend in the Pound today is expected to be determined by the Bank of England's interest rate decision, due later today. The central bank is widely expected to leave interest rates unchanged.
The currency pair is trading below its 20 Hr and 50 Hr moving averages.
