
Sample Category Title
Trade Idea Wrap-up: EUR/USD – Sell at 1.1940
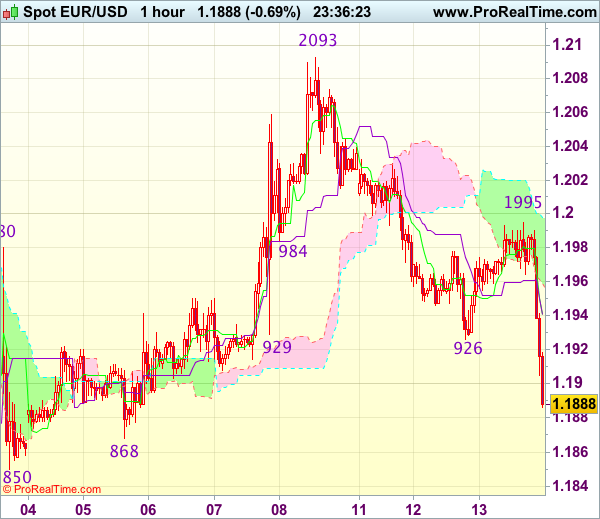
EUR/USD - 1.1895
Most recent candlesticks pattern : N/A
Trend : Near term down
Tenkan-Sen level : 1.1940
Kijun-Sen level : 1.1940
Ichimoku cloud top : 1.1998
Ichimoku cloud bottom : 1.1959
New strategy :
Sell at 1.1940, Target: 1.1840, Stop: 1.1975
Position : -
Target : -
Stop : -
As the single currency has dropped again after meeting renewed selling interest at 1.1995 earlier today, suggesting the selloff from 1.2093 top is still in progress, hence downside bias remains for this move to bring retracement of early upmove to 1.1868 support, break there would extend weakness to 1.1850, however, near term oversold condition should prevent sharp fall below another previous support at 1.1823 and reckon 1.1800 would hold from here.
In view of this, would not chase this fall here and would be prudent to sell euro on recovery as 1.1940-50 should limit upside. Above 1.1975-80 would signal an intra-day low is formed, bring rebound to 1.1995-00 first.
Trade Idea Update: USD/JPY – Buy at 109.65
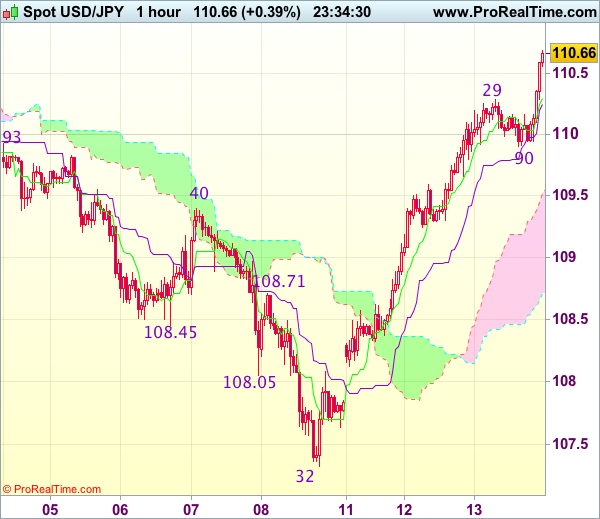
USD/JPY - 110.61
Most recent candlesticks pattern : N/A
Trend : Up
Tenkan-Sen level : 110.30
Kijun-Sen level : 110.25
Ichimoku cloud top : 109.52
Ichimoku cloud bottom : 108.71
Original strategy :
Buy at 109.45, Target: 110.45, Stop: 109.10
Position : -
Target : -
Stop : -
New strategy :
Buy at 109.65, Target: 110.65, Stop: 109.30
Position : -
Target : -
Stop : -
As the greenback has surged again in NY morning, adding credence to our bullish view that recent rise from 107.32 low is still in progress and may extend further gain towards previous resistance at 110.95-05, however, break there is needed to retain upside bias and encourage for headway to 111.30, having said that, near term overbought condition should prevent sharp move beyond another previous resistance at 111.71, bring retreat later.
In view of this, would not chase this rise here and would be prudent to buy dollar on subsequent pullback. Below the Kijun-Sen (now at 110.25) would bring test of support at 109.90 but reckon the upper Kumo (now at 109.52) would contain downside and bring another rally later
Dollar Shrugs off Soft U.S. PPI, Pressures Yen
USD/JPY has posted gains in the Wednesday session. In North American trade, the pair is trading at 110.63, up 0.45% on the day. The pair has posted two straight winning days, and is up 2.0% this week. On the release front, Japanese data beat expectations, but this was not enough to stem the dollar's rally. The BSI Manufacturing Index jumped 9.4 points in the second quarter, its strongest reading in two years. Japanese PPI improved to 2.9%, just shy of the estimate of 3.0%. In the US, inflation numbers improved in August, but fell short of the estimates. PPI improved to 0.2%, shy of the estimate of 0.3%. As well, Core CPI gained 0.1%, short of the forecast of 0.2%. On Thursday, we'll get a look at US CPI and unemployment claims.
The yen continues to lose ground, as investors have quickly put the Korean hot spot behind them, at least for the time being. In recent weeks, risk appetite has waned, as North Korea as inflamed tensions by firing missiles over Japan and testing nuclear devices, much to the consternation of the US, Japan and South Korea. As a safe-haven asset, we could see investors quickly return to the reliable yen if the war of words between US President Trump and North Korean President Kim Jong-un escalates. If the uneasy calm between North Korea and South Korea continues, the dollar could punch above the 111 level, which was last reached in August.
Despite a strong economy, US inflation levels remain stubbornly weak, well below the Federal Reserve's inflation target of 2.0%. This was underscored on Wednesday, as PPI and Core PPI missed their estimates in August, although both releases did rebound compared to the July readings. The US labor market remains very strong, but wage pressure has been limited, despite the fact that many businesses cannot fill job openings. Weak inflation has hampered the Fed's plans to raise interest rates a third time this year, and the odds of a December rate hike are currently pegged at 41%, as the markets are increasingly doubtful that the Fed will make a move before next year. If the August CPI numbers beat expectations, the likelihood of a December hike should move closer to 50%.
Dollar Breaks 92 Level as Rivals Weaken; Pound Drops Below 1.33 as Wage Growth Disappoints
During the European trading, the focus turned back to the economic calendar and specifically to the US PPI figures and the UK labor data, leaving geopolitical issues out of the spotlight for the moment. The dollar crossed above the 92-key level as risk appetite returned and developments on the US fiscal front, such as on tax reform, seemed to give reasons to investors to buy the dollar.
The dollar surged to 92.27 against its major rivals, ignoring the weaker-than-expected US PPI figures for the month of August. In particular, headline producer prices rose by 0.5 percentage points to 2.4% y/y (0.2% m/m), while the core equivalent increased by 0.2 percentage points to 2.0% (0.2% m/m). Expectations were for the headline index to increase by 2.5% y/y and the core index by 2.1%. However, the markets are eyeing tomorrow the US CPI numbers, which are also closely watched by the Fed, for more evidence on the future inflation path.
Dollar/yen touched a fresh two-week high of 110.45.
The pound could not extend its gains made during the Asian session as UK average earnings in July disappointed markets, growing below the inflation rate. Including bonuses, average earnings rose by 2.1% matching June's percentage increase, while forecasts were for a growth of 2.3%. The unemployment rate continued falling in August though, retreating from the 4.4% in July to a 42-year low of 4.3%. This is likely to bring a headache to BOE policymakers tomorrow when they meet to decide on interest rates as wages do not respond satisfactorily to better labor conditions.
In Strasbourg, Jean-Claude Junker, the President of the European Commission, called for EU governments to reap the benefits of closer EU integration now that the "window of opportunity" is still open. He also asked all members to join the common currency, saying that for the euro to be a symbol of unity "should be more than the currency of a select group of countries". Finally, he suggested the replacement of the bloc's bailout fund into a European Monetary Fund and the introduction of a new EU minister of Finance in an attempt to help weaker non-euro economies to adopt the currency and mitigate potential economic shocks.
In the meantime, Eurostat figures on Wednesday showed that industrial production in the Eurozone remained robust in July, growing from 2.8% y/y (upwardly revised from 2.6%) in June to 3.2% y/y despite missing the forecast of 3.4%. In another report, the agency indicated that employment change in the second quarter remained flat at 1.6% y/y (upwardly revised from 1.5%), exceeding expectations of a 1.4% growth.
Following the above, the euro showed little reaction, moving sideways around $1.1980, though afterwards, the pair fell to a one-week low of 1.1909 on the back of a stronger dollar.
The Energy Information Administration's weekly report on US crude inventories showed crude stocks rising by 5.9 million barrels in the week to September 8. This outstripped expectations for a rise by 3.2m barrels and came in above the 4.6m gain that was recorded in the preceding week. WTI gave up part of the gains that were made earlier in the day after the release of the report, though it was still trading 0.9% up on the day – at $48.67 a barrel – during afternoon European trading hours. In the meantime, Brent crude was 0.4% up, at $54.49 per barrel.
Following the EIA report, dollar/loonie approached a one-week high of 1.2209 before it slips to 1.2192 later on.
Regarding gold, the precious metal dropped to a two-week low of $1,323.26 per ounce as risk-on sentiment was back on track.
Investors Remain Negative on Sterling Despite Hitting 1-Year High against the Dollar
Expectations that the Bank of England will take a more hawkish stance at its policy meeting this week have lifted sterling from two-month lows ploughed at the end of August, offsetting concerns about a slowing economy and a lack of progress in the Brexit negotiations.
Stronger-than-expected inflation data on Tuesday fuelled those expectations as UK consumer prices rose by an annual rate of 2.9% in August, just shy of the BoE's upper limit of 3%, at which point the Governor Mark Carney would be required to write a letter to the UK finance minister explaining the overshoot. The pound hit a one-year high of $1.3328 earlier today but those gains were tempered after the latest UK employment data showed average weekly earnings missed expectations. UK wages rose by just 2.1% in the three months to July, underlining the predicament for the Bank of England where an unemployment rate at a 42-year low of 4.3% is not spurring higher pay growth, and in turn, causing a squeeze on household's disposable incomes.
Another dilemma for the Bank is a weakening economy. Slowing consumer and business spending have pushed the UK to the bottom of the G7 growth league in first half of the year. The slowdown was anticipated by the Bank of England and is the main reason why it has been reluctant to raise rates even though inflationary pressures are clearly on the up.
However, the Bank has said there are limits to its tolerance of inflation overshoot and speculation has been increasing that the tolerance level has been reached for more of the BoE's monetary policy committee (MPC) members. In June, the Bank saw its tightest vote since 2011 when three members dissented. The figure fell to two in August following the departure of one of the hawks, Kirstin Forbes. But a growing number of market participants think the Bank's Chief Economist, Andy Haldane, will join Ian McCafferty and Michael Saunders in voting for a 25bps rate hike on Thursday.
Economists are not convinced though that a UK rate rise is nearing and are not projecting an increase in borrowing costs before 2019. Traders see a different story however and the market-implied odds of a rate hike before the end of 2018 have been rising. This has been positive for the pound, which has been looking surprisingly bullish against the US dollar since April. The pound has also perked up against the euro recently, hitting one-month high this week.
However, analysing the pairs more closely, sterling's gains look overstated. The pound's 7.5% gain versus the dollar this year is more to do with the greenback's weakness than improved fundamentals for the UK economy. Against the euro, sterling has in fact been on a downtrend since May and this month's rebound is more likely to be a technical correction than a trend reversal.
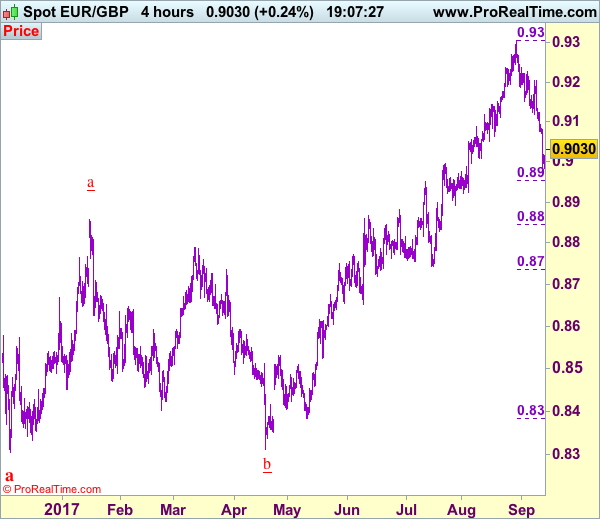
The Bank of England pays more attention to the sterling Effective Exchange Rate Index, which fell to a 10-month low when the euro peaked at an 8-year high of 0.9306 on August 29 (when excluding last October's flash crash). The index has recovered somewhat since then but is still slightly down on the year (in contrast to the pound/dollar pair). This would worry BoE policymakers as fresh falls in sterling's broader value could drive inflation even further above the Bank's 2% target.
But despite the Bank's task of justifying low interest rates becoming increasingly difficult, most analysts don't foresee a majority of MPC members voting for a hike in the coming months, especially as, now that the committee is back to its full nine members, the dovish Governor would have the deciding vote in the event of a 50-50 split.
This explains why many investors remain bearish on the pound, particularly against the euro, which itself is benefiting from the prospect of tighter policy by the European Central Bank. Morgan Stanley predicted last month that the pound will hit parity with the euro in 2018. This view isn't shared by most other investment banks, though many have lowered their forecasts for pound/euro, while raised them slightly for pound/dollar. The most recent Reuters poll conducted in the first week of September points to a similar picture. Median forecasts for pound/dollar in a year's time was unchanged at $1.30, but a majority of economists raised their forecasts for euro/pound to 0.92 pounds.
The MPC vote composition at tomorrow's meeting will be crucial in setting the trend for the pound as a 6-3 vote would fuel rate rise expectations whereas a 7-2 vote could kill the current mini rally. Judging by Carney's previous comments, concerns about waning consumer confidence and the negative impact on businesses from the continued Brexit uncertainty will likely outweigh the unease about the upswing in inflation. The MPC will probably want to wait and see whether inflation will drop back once the initial increases from the pound's post-Brexit depreciation start to drop out of the calculation. In the absence of a pick-up in wage growth, there is little to suggest that the current spike in inflation is not temporary.
Is BoE Any Closer to Raising Interest Rates?
What's More Important to the BoE, Inflation or the Economy?
The Bank of England faces a dilemma when it meets on Thursday between getting inflation in check and supporting the flagging post-Brexit economy.
With the central bank significantly overshooting its 2% inflation target - CPI rose to 2.9% in August - the answer may appear simple but with policy makers divided, that is clearly not the case.
The depreciation of sterling has played a major role in the inflation rise over the last year and with the currency having bottomed last October, it is plausible that once the base effects drop out of the annual comparison, inflation will fall closer to target. But can policy makers rely on that?
As we can see from recent voting, there is a growing belief that this cannot be relied upon. The important question therefore becomes, will enough policy makers decide they can't rely on it before the data starts to correct itself?
With only two policy makers - Ian McCafferty and Michael Saunders - having voted at the previous meeting to raise interest rates and a ninth member having since joined the Monetary Policy Committee, it seems unlikely that the hike threshold will be passed this week.
That said, the pound did not necessarily rally over the last couple of weeks on the expectation that the BoE will raise interest rates on Thursday, rather on the expectation that it is getting closer. The inflation reading on Tuesday further fuelled the expectation while Wednesday's wage data tempered it slightly.
What Can We Expect on Thursday?
While a rate hike at the meeting is very unlikely, central banks have surprised us in the past and given how other central banks (ECB, Bank of Canada) are exploring tighter monetary policy, it remains a possibility, albeit a small one I would say.
What traders are most interested in is what impact the August inflation number had on those policy makers that have been borderline hike voters but remained with the majority until now. There is also one new policy maker on the committee this month - Sir David Ramsden - and another that only joined in July - Silvana Tenreyro - who's views we still know little about.
It may not take as much as we thought to sway the vote in favour of a rate hike, at which point I would expect to see a sharp move higher in the pound, as that is not priced in.
What's more likely is the voting will either be unchanged - with only McCafferty and Saunders voting for a hike - or perhaps one more policy maker will join them. This may even be enough to provide some upside for the pound in the near term.
The minutes will be of interest to traders but the reality, particularly if they allude to inflation becoming a concern to policy makers or some policy makers being tempted to vote for a hike. That would suggest any further uptick in inflation going forward could result in higher rates.
Elliott Wave Analysis: USDJPY and AUDUSD
Good day traders! Today we are going to take a better look at USDJPY and AUDUSD.
USDJPY is making a bullish case for itself, as we see price trading in an impulse. We see wave 5) as part of this bullish structure trading near completion; meaning once it fully unfolds a new three-wave move lower may come in play. That said, we also have Divergence seen on the pair, which inidcate a possible reversal.
USDJPY, 1H
Aussie is ticking lower after earlier retest of 0.8040 level. Pair did not break above blue wave a swing high yet, so we assume that corrective rally is still unfolding, but it may be an irregular if price of current wave b will breach below Sep 12 low.
AUDUSD, 1H
Trade Idea: EUR/GBP – Sell at 0.9095
EUR/GBP - 0.9031
Original strategy :
Sell at 0.9065, Target: 0.8955, Stop: 0.9105
Position : -
Target : -
Stop : -
New strategy :
Sell at 0.9095, Target: 0.8955, Stop: 0.9135
Position : -
Target : -
Stop : -
As the single currency has recovered after holding above this week’s low at 0.8982, suggesting minor consolidation above this level would be seen and another bounce to 0.9060-70 cannot be ruled out, however, reckon upside would be limited to 0.9095-00 and bring another decline later, below said support at 0.8982 would signal the selloff from 0.9307 top is still in progress for retracement of recent upmove to 0.8950-55 (38.2% Fibonacci retracement of 0.8384-0.9307), below there would extend weakness to 0.8920-25 but reckon near term oversold condition would limit downside and 0.8890-00 would hold.
In view of this, would not chase this fall here and we are looking to sell euro on recovery as 0.9095-00 should limit upside and bring another decline. Above previous support at 0.9119 would defer and suggest low is formed instead, bring a stronger rebound to 0.9135-40, however, still reckon upside would be limited to 0.9170 and resistance at 0.9203 should remain intact, bring another decline later.
Our preferred count is that, after forming a major top at 0.9805 (wave V), (A)-(B)-(C) correction is unfolding with (A) leg ended at 0.8400 (A: 0.8637, B: 0.9491 and 5-waver C ended at 0.8400. Wave (B) has ended at 0.9413 and impulsive wave (C) has either ended at 0.8067 or may extend one more fall to 0.8000 before prospect of another rally. Current breach of indicated resistance at 0.9043 confirms our view that the (C) leg has ended and bring stronger rebound towards 0.9150/54, then towards 0.9240/50.
Trade Idea: USD/CAD – Sell at 1.2240
USD/CAD - 1.2139
Trend: Down
Original strategy :
Sell at 1.2240, Target: 1.2080, Stop: 1.2300
Position: -
Target: -
Stop: -
New strategy :
Sell at 1.2240, Target: 1.2080, Stop: 1.2300
Position: -
Target: -
Stop:-
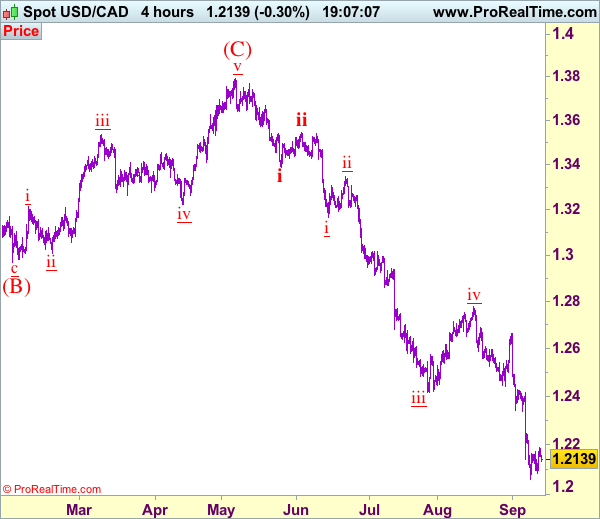
Near term sideways trading above recent low at 1.2061 (last week’s low) is likely to continue and although another bounce to 1.2200 cannot be ruled out, reckon resistance at 1.2245 would limit upside and bring another decline later, below 1.2082 would bring a retest of said support at 1.2061, break there would signal recent decline is still in progress and may extend further weakness towards psychological support at 1.2000 but loss of downward momentum should prevent sharp fall below 1.1950-60, bring rebound later. We are keeping our count that wave v as well as wave (C) ended at 1.3794 and impulsive wave (i ii, i ii) is now unfolding with minor wave iii ended at 1.2414, followed by wave iv correction ended at 1.2778, wave v has reached our indicated downside target at 1.2100 and may extend to 1.2000.
In view o this, would not chase this fall here and would be prudent to sell on recovery as 1.2245 should limit upside. Above 1.2300 would would defer and risk a stronger rebound to 1.2335-40 but only break of resistance at 1.2429 would signal low is formed, bring retracement of recent decline to 1.2490-00.
To recap, wave B from 1.3066 is unfolding as an a-b-c and is sub-divided as a: 1.2192, b: 1.2716 and wave c is a 5-waver with i: 1.1983, ii: 1.2506, extended wave iii with minor iii at 1.0206, wave iv ended at 1.0781 and wave v as well as wave iii has ended at 0.9931, hence the subsequent choppy trading is the wave iv which is unfolding as (a)-(b)-(c) with (a) leg of iv ended at 1.0854, followed by (b) leg at 1.0108 and (c) leg as well as the wave iv ended at 1.0674. The wave v is sub-divided by minor wave (i): 0.9980, (ii): 1.0374, (iii): 0.9446, (iv): 0.9913 and (v) as well as v has possibly ended at 0.9407, therefore, consolidation with upside bias is seen for major correction, indicated target at 1.3700 and 1.4000 had been met and further gain to 1.4700 would be seen later.
Low Wage Growth Caps Sterling Comeback
- European equity indices record small gains in an uneventful trading session. The risk rebound which started at the end of last week, stalled. US stock markets open mixed to slightly lower.
- North Korea has vowed to redouble efforts to acquire nuclear weapons that can strike the US mainland, pledging that America would face the "greatest pain it ever experienced" after the UN imposed its toughest sanctions against the rogue nation.
- Saudi Arabia, the world's biggest crude exporter and the main driver behind OPEC policies is now pushing for monitoring of exports, rather than just production, at a Sept. 22 meeting of oil producers in Vienna. Oil exports from member countries have declined so far, but by a significantly smaller margin than production cutbacks.
- Britain's unemployment rate hit its lowest since 1975 (4.3%) but wages (2.1% Y/Y) slipped further behind the cost of living, taking some of the urgency out of a Bank of England debate on when interest rates might rise.
- EC President Juncker called for the bloc to expand its economic links from Asia Pacific to Latin America, highlighting the EU's ambition to champion free trade in the wake of President Donald Trump's "America First" policies. He called on EU governments to seize a window of opportunity from Brexit and economic growth to forge a tighter union.
- EMU industrial production rose by 0.1% M/M in July, after contracting (-0.6% M/M) in June. It's a weak start to 3Q, though the sector seems to be heading for another positive quarter -- as evidenced by the buoyant soft data.
- US producer prices rose in August, albeit less than expected, reinforcing the view in the market that Fed officials will take a more cautious stance as they try to determine the pace of future rate rises. The producer price index – a key measure of industrial inflation –nudged 0.2% M/M and 2.4% Y/Y higher in July.
Rates
Correction core bonds yields stalls ahead of US eco data
Global core bonds traded within narrow sideways ranges today. The risk rebound since Friday afternoon shifted in a lower gear and so did the correction higher of the dollar and core bond yields. EMU/US eco data remain confined to second tier numbers with outdated EMU industrial production bang in line with expectations and US PPI rising, but slightly less than forecast. Investors are clearly waiting for new impetus from the US side of the story with CPI numbers (tomorrow), retail sales (Friday) and the FOMC meeting (next Wednesday) lining up. ECB Praet is scheduled to speak after European closure. He generally keeps close to Draghi's comments and is a member of the dovish wing inside the ECB.
At the time of writing, changes on the German yield curve range between -0.7 bps (30-yr) and +0.7 bps (2-yr). US yield differences vary between +0.6 bps (2-yr) and -0.2 bps (30-). On intra-EMU bond markets, 10-yr yield spread changes versus Germany range between -2 bps and +2 bps.
The German Finanzagentur tapped the on the run 10-yr Bund (€3B 0.5% Aug2027). The auction met again with tepid demand. Total bids amounted €3.85B, slightly below the €3.99B average at the previous 4 Bund auctions. The Bundesbank set aside €0.55B for secondary market operations, resulting in an official bid cover of 1.6. The auction had a rather large, 3 cent, tail. The Italian Treasury launched a new 7-yr BTP (€4B 1.45% Nov2024) and tapped the on the run 3-yr BTP (€2.5B 0.35% Jun2020) and 20-yr BTP (€1.5B 2.25% Sep2036). The combined amount sold was the maximum of the intended €6.5-8B target range with a strong (for Italian standards) auction bid cover of 1.57. The US Treasury ends its refinancing operation tonight with a $12B 30-yr Bond auction. The WI trades currently around 2.77%.
Currencies
Dollar rebound stalls awaiting news
The overall risk rebound stalled and so did the comeback of the dollar. Eco data were few and if any (US PPI), they very close to consensus. Interest rates or risky assets also failed to provide guidance for USD trading. EUR/USD holds in the mid 1.19 area. USD/JPY hovers near 110.
European investors were looking for additional input to extend the risk recovery and the rebound of the dollar. However, there were no important eco data in EMU and interest rates/interest rate differentials also failed to give guidance. Europe equities couldn't find inspiration in record closing levels for the major US indices yesterday evening. EUR/USD hovered sideways just below the 1.20 mark. USD/JPY struggled not to fall below 110, awaiting a signal from the US.
US data were of no big help to set up directional positions. US headline final demand PPI rose 0.2% M/M and 2.4% Y/Y (2.5% was expected). The deviation from consensus was insignificant also for other core measures. The dollar tried a shy downside attempt, but the move stalled almost immediately.
The easy part of an overdue risk-rebound, including a comeback of the dollar, has run its course. A more protracted USD comeback needs support from a further improvement in global sentiment or strong US data, but none of these factors materialize at this stage, leaving the dollar in no man's land. EUR/USD trades in the 1.1960 area. USD/JPY trades just north of 110. That said, the dollar easily maintains the gains of Monday and Tuesday, suggesting that further gains are possible if supportive news kicks in.
Low wage growth caps sterling comeback
Sterling jumped sharply higher yesterday as an unexpected rise in UK inflation put a BoE rate hike again on the radar. Today's UK labour data failed to clarify the interest rate debate. The discrepancy between activity and wage data persisted. The unemployment rate dropped to 4.3%, the lowest level since 1975 and employment growth remained strong. However, wage growth didn't accelerate at all. At 2.1% Y/Y, real wages move further into negative territory. This combination leaves Carney and Co with a dilemma. Can they prepare for a rate hike to contain inflation when real disposable income comes under ever growing pressure. Sterling traders didn't know what card to play. Sterling lost a few ticks after the release, but maintained most of yesterday's gains. EUR/GBP trades in the 0.9025/30 area. Cable dropped from 1.33+ levels to the mid 1.32 area and trades currently again at around 1.3275. The countdown to tomorrow's BoE policy assessment has started.