Sample Category Title
Loonie Trading On Weaker Footing In The Morning Session
For the 24 hours to 23:00 GMT, the USD declined 0.15% against the CAD and closed at 1.2162.
Macroeconomic data revealed that Canada's Teranet/National Bank house price index climbed 0.6% in August, after recording a rise of 2.0% in the previous month.
In the Asian session, at GMT0300, the pair is trading at 1.2177, with the USD trading 0.12% higher against the CAD from yesterday's close.
The pair is expected to find support at 1.2132, and a fall through could take it to the next support level of 1.2087. The pair is expected to find its first resistance at 1.2221, and a rise through could take it to the next resistance level of 1.2265.
Going ahead, market participants will keep a close watch on Canada's new housing price index data for July, set to release later in the day.
The currency pair is showing convergence with its 20 Hr moving average and trading above its 50 Hr moving average.

Market Update – Asian Session: China Data Weaker Than Expected
Asia Summary
Asian equity markets opened slightly lower, before swinging into muted gains, then back again. The onshore yuan fell for a 5th consecutive day, while the PBOC weakened the yuan daily reference rate for the 3rd consecutive day. China again used 7, 14 and 28 day reverse repos with a CNY100B injection. China MOFCOM expressed its displeasure with President Trump for blocking deal between Lattice Semi and Canyon Bridge Capital.
There was a deluge of data out of China, with fixed assets ex rural and industrial production coming in lower than expected. After the data National Bureau of Stats spokesperson said yuan appreciation shows steady China economy and China will help companies enhance ability to weather FX fluctuations. NBS also indicated that the base effect has inflated PPI. Analysts picked up on this and warned that this when washed through will be disappointing and possibly dampen global growth outlook. Australia again reported a significant jump in employment change, +54.2K, much higher than the 20K expected, both part time and full time employment saw growth. The A$ jumped about 40 pips on the news, before slightly falling on the weaker China data.
Key economic data
(AU) AUSTRALIA AUG EMPLOYMENT CHANGE: 54.2KE V 20.0KE; UNEMPLOYMENT RATE: 5.6% V 5.6%E
(CN) CHINA AUG RETAIL SALES Y/Y: 10.1% V 10.5%E; YTD Y/Y: 10.4% V 10.4%E
(CN) CHINA AUG FIXED ASSETS EX RURAL YTD Y/Y: 7.8% V 8.3% PRIOR
(CN) CHINA AUG INDUSTRIAL PRODUCTION Y/Y: 6.0% V 6.6%E; YTD Y/Y: 6.7% V 6.8%E
(CN) CHINA AUG YTD FOREIGN DIRECT INVESTMENT (FDI) YUAN-DENOMINATED TERMS Y/Y: -0.2% V -1.2% PRIOR
(AU) Australia Sept Consumer Inflation Expectation Survey: 3.8% v 4.2% prior
(NZ) New Zealand Sept ANZ Consumer Confidence Index: 129.9 v 126.2 prior; M/M: 2.9% v 0.6% prior
Speakers and Press
China/Hong Kong
(CN) China National Stats Bureau (NBS): Yuan appreciation shows steady China economy; Will help companies enhance ability to weather FX fluctuations; base effect has inflated PPI
(CN) China MOFCOM: Very concerned by Trump's blocking of China deal; security checks shouldn't be used as a protectionism tool
Korea
(KR) South Korea said to be considering aid to North Korea through international organization - Korean press
(KR) S&P affirms not considering South Korea sovereign rating downgrade due to N. Korea; sees a low risk of war
(KR) China may have halted North Korea textile trading before the recently announced UN sanctions – Japanese Press
Australia/New Zealand
(NZ) New Zealand Labour Party (opposition): Will not introduce new taxes before 2021; alters tax working group plans before Sept 23rd elections
(AU) Australia Port of Newcastle Aug Coal Exports 12.5Mt, -11.9% m/m
Other
(US) President Trump: "China has a business tax rate of 15%. We should do everything possible to match them in order to win with our economy. Jobs and wages!" - tweet
Asian Equity Indices/Futures (00:00ET)
Nikkei -0.3%, Hang Seng -0.5%; Shanghai Composite -0.2%, ASX200 -0.2%, Kospi +0.2%
Equity Futures: S&P500 -0.1%; Nasdaq100 -0.1%, Dax -0.1%, FTSE100 -0.1%
FX ranges/Commodities/Fixed Income (00:00ET)
EUR 1.1894-1.1871; JPY 110.73-110.41; AUD 0.8016-0.7973; NZD 0.7263-0.7239
Dec Gold -0.1% at $1,326/oz; Oct Crude Oil -0.1% at $49.23/brl; Sept Copper -0.1% at $2.98/lb
(US) DOE CRUDE: +5.9M V +3.5ME; GASOLINE: -8.4M V -3ME; DISTILLATE: -3.2M V -1.5ME (biggest gasoline inventory drop since at least 1990)
(CN) China Govt preparing to sell $2B in bonds this month - financial press citing sources in Hong Kong
USD/CNY *(CN) PBOC SETS YUAN REFERENCE RATE AT: 6.5465 V 6.5382 PRIOR (3rd consecutive weaker setting)
(CN) PBOC injects combined CNY100B in 7,14 and 28-day reverse repos v injects CNY70B prior
(NZ) New Zealand sells NZ$100M v NZ$100M indicated in 2.5% 2040 I/L Bonds; avg yield 2.3569%
(JP) Japan MoF sells ¥3.65T in 3-month bills; avg yield -0.1394%
(JP) Japan MoF sells ¥803.9B v ¥1.0T indicated in 0.6% 20-yr JGBS; avg yield 0.5600%; bid-to-cover 4.15x
Equities notable movers
Australia/New Zealand
MQA.AU To exercise a pre-emptive right to acquire an additional 4.86% indirect interest in APRR for €440M, launches A$450M capital raising
MYR.AU Reports FY17 (A$) adj Net 67.9M v 69.4M y/y; EBITDA 198.1m v 204.2M y/y; Rev 3.20B v 3.25B y/y; +2.4%
Hong Kong/China
700.HK Exec: Have made creators of WeChat groups responsible for managing information within their forums and the behaviour of members; new regulations pose challenge for firm to hook users ; +1.1%
1398.HK China Official: hopes Spain handles proceedings against ICBC Europe in money-laundering case in a fair way; -1%
Japan
3105.JP, BLDP Collaborated with Nisshinbo Holdings to offer PEM Fuel Cell product using non-precious metal catalyst; +25%
Asian Stocks Held Steady This Morning
Market movers today
In the US, CPI inflation for August will attract more attention than usual given that they will give the Fed its last impression of underlying price pressure before the FOMC meeting on 19-20 September. Out of the past five months, CPI headline has fallen in three and the weak numbers seem to be very broad based. In August, we estimate energy contributed around 0.1pp to the headline figure on top of our expectation of an increase in core CPI of 0.1% m/m. Thus, we estimate CPI headline to come in at 0.2% m/m (1.7% y/y, unchanged from July) and CPI core at 0.1% m/m (1.5% y/y vs 1.7% in July). Note that the fall in CPI core y/y is driven by an increase of 0.3% m/m in August last year, which falls out of the yearly increase in August this year.
In the UK, the Bank of England (BoE) meeting will be in focus. We expect BOE to keep the Bank Rate unchanged at 0.25% with an unchanged vote count of 7-2. It is one of the small meetings without an updated Inflation Report and a press conference, so we have to look for any changes to the policy stance in the minutes. It is not our expectation that the BoE will change its tone significantly, as the economy has developed more or less in line with the expectations set out in the latest Inflation Report of 3 August but the BoE may address the weaker GBP. We still expect the bank to remain on hold throughout the Brexit negotiations, which is also what markets have priced in.
Selected market news
Asian stocks held steady this morning, despite weaker-than-expected Chinese industrial output (6.0% y/y in August) and investment (7.8% YTD) data released this morning. Wall Street edged up to a record high yesterday, while US Treasury yields climbed to 2-1/2-week highs on an ongoing improvement in broader investor risk sentiment.
In his annual State of the European Union speech, Commission chief Juncker sketched out a vision of a post-2019 EU where ideally all member countries should adopt the euro at some point, with a eurozone finance minister to co-ordinate economic policy across the bloc. However, he also rejected French proposals of a special eurozone budget, as there are other measures available to help counter economic shocks. The French president Macron will present his ideas for reforming the eurozone on 26 September, two days after the German election. German politicians, including Angela Merkel, has recently voiced support for such reforms, but much will depend on the actual German government composition, which will probably only be known in end-October/mid-November (see also German Election Monitor No. 1: Next euro area election unlikely to rock the boat, 29 August).
In the US, we got news that Republicans leaders expected to release more details on tax reform on 25 September. The hope is to complete a budget by mid-October carrying tax language, which then needs to pass Congress, see POLITICO. The difficulty remains that Republicans must not only agree on taxes, but also need to agree on a budget to make changes to tax legislation without being filibustered in Senate. Although Trump has begun talking more with Democrats lately, it seems unlikely the Republican leaders want to do a tax reform with the Democrats, in our view.
Disappointing August Data Evidenced That Chinese Growth Peaked In 1H17
August data further evidenced that China's economic growth has peaked in the first quarter. Following the sharper-than-expected slowdown in growth in July, the latest set of macroeconomic data also surprised to the downside. The moderation was a result of the government's tighter monetary policy in an attempt to curb excessive investment in certain areas, such as real estate. Renminbi's appreciation against US dollar since the beginning of the year probably has weighed on exports. This leads the PBOC to loosen capital control which has been adopted over the past years to prevent renminbi from severe depreciation.
Industrial production expanded +6% y/y in August, missing consensus of +6.6% and July's +6.4%. The deceleration in IP growth was unexpected. Indeed, the strong manufacturing PMI had led some to forecast a higher-than-consensus growth. The official manufacturing PMI rose to 51.7 in August, compared with consensus of 51.3 and July's 51.4, as driven by strong production and new orders. The Caixin/Markit index also soared to a 6-month high of 51.6 on robust demand. Retail sales growth moderated to +10.1% y/y, form +10.4% in July. The market had anticipated an improvement to +10.5%. Urban fixed assets investment rose +7.8% in the eight months through August, decelerating from +8.3% in the first 7 months of the year. The slowdown came in much more than expectations of +8.2%
Inflation
Due last week, China's CPI and PPI surprised to the upside. Headline CPI improved to +1.8% y/yin August from +1.4% a month ago. The market had anticipated a rise to +1.6%. The acceleration was mainly driven by one-off factors such as the rises in egg and vegetable prices due, respectively, to polluted egg incidents overseas and flood. Excluding volatile food and energy prices, core CPI picked up to +2.2% y/y in August, from July's +2.1%. PPI inflation accelerated to 6.3% y/y, from +5.5% in July. This came in much higher than consensus of +5.7%. the increase was driven by the rally in metal prices. The government's upcoming output curtailment in steel production has frontloaded production of the metal. This has raised the demand, and hence the prices, of base metals (such as nickel and iron ore) related to steel production. Meanwhile, the government's plan to ban imports of scrap metals, including copper, from the end of 2018, has lifted demand for the refined ones.
The August trade report sent mixed messages. Trade surplus narrowed to US$ 42B from 46.7B in July, as the growth in exports was overshadowed by that of imports. Exports increased +5.5% y/y, moderating from +7.2% in July. Import growth accelerated to +13.3% in august, from +11% in July. This scenario, weaker exports growth but strong imports growth, was indeed “predicted” in the new exports order and imports sub-indices in official PMI report. PBOC announced last Friday to cut the FX exchange forward reserve ratio from 20% to 0%. The rule was implemented in 2015 when renminbi received massive selloff after the government abruptly depreciated its currency by -2% on August 11, 2015. The move signaled that the government is less concerned about capital outflow as renminbi has steadily risen against the US dollar over the past several months, amidst the latter's broad-based weakness. It also suggested that the government does not want to see renminbi to go much higher as it can affect exports, as evidenced in the August trade data.
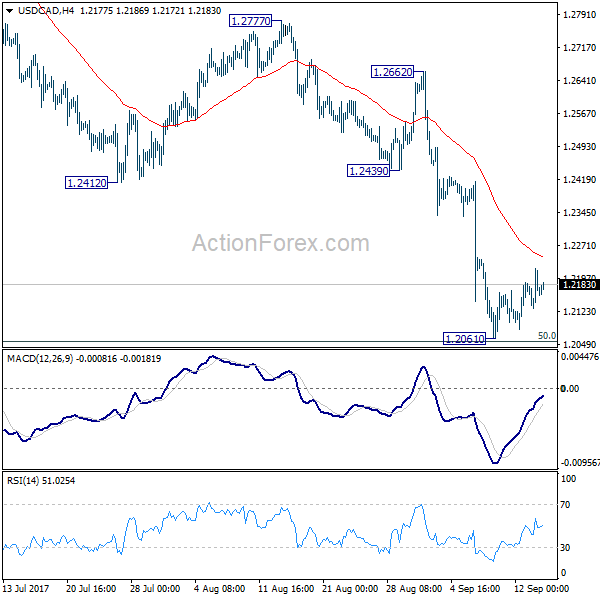
USD/CAD Daily Outlook
Daily Pivots: (S1) 1.2130; (P) 1.2174; (R1) 1.2219; More....
USD/CAD is staying in consolidation from 1.2061 temporary low and intraday bias remains neutral. We'll stay cautious on strong support from 1.2048 long term fibonacci level to bring sustainable rebound. But still, break of 1.2412 support turned resistance is needed to be the first sign of trend reversal. Otherwise, outlook will remain bearish. Firm break of 1.2048 will pave the way to next fibonacci level at 1.1424.
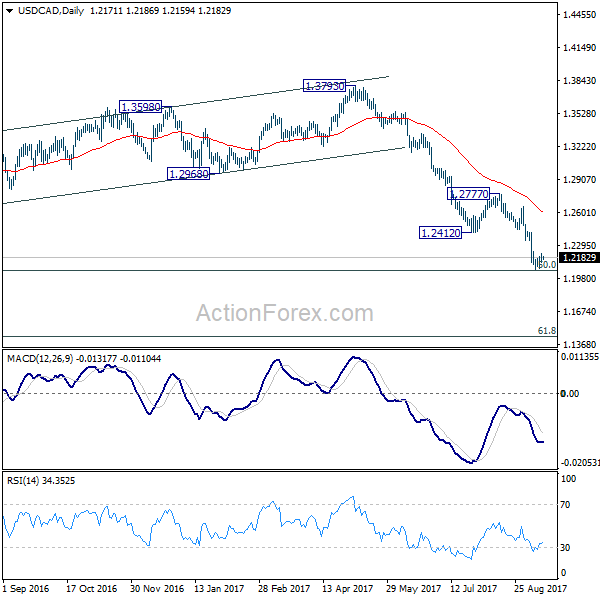
In the bigger picture, current downside acceleration is raising the chance that whole long term rise from 0.9406 (2011 low), and that from 0.9056 (2007 low) is completed at 1.4689. Focus is now on 50% retracement of 0.9406 to 1.4869 at 1.2048. As long as this level holds, we'd still favor that case that fall from 1.4689 is a correction. However, firm break of 1.2048 will indicate that fall fro 1.4689 is at least a medium term down trend and should target 61.8% retracement at 1.1424 and below.
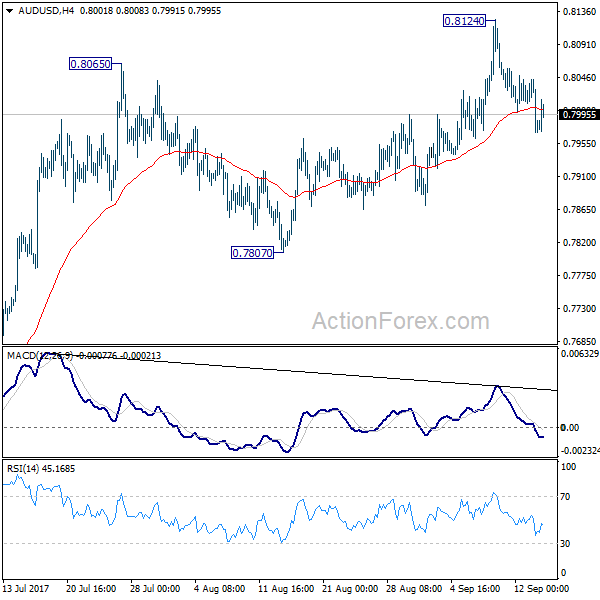
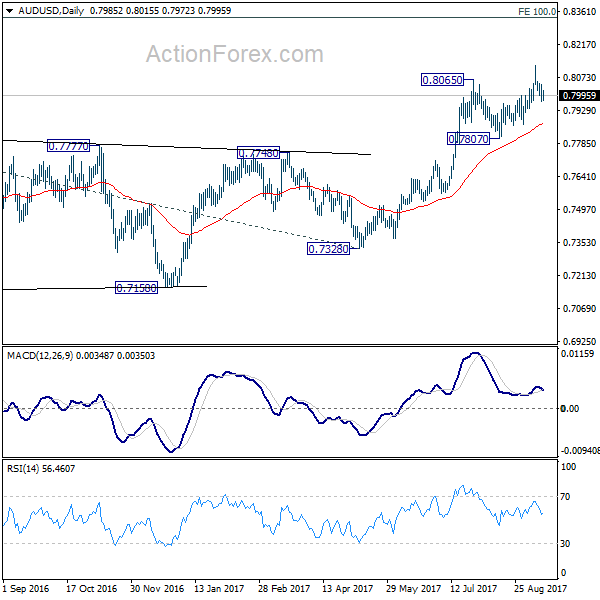
AUD/USD Daily Outlook
Daily Pivots: (S1) 0.7955; (P) 0.8000; (R1) 0.8029; More...
AUD/USD's corrective trading from 0.8124 is still in progress but it's staying well above 0.7807 support. Intraday bias remains neutral first and another rise is in favor. Above 0.8124 will target 100% projection of 0.6826 to 0.7833 from 0.7328 at 0.8335 next. However, considering bearish divergence condition in 4 hour MACD, firm break of 0.7807 will indicate near term reversal and turn bias back to the downside for 0.7328 key support.
In the bigger picture, rise from 0.6826 medium term bottom is still in progress. At this point, there is no confirmation of trend reversal yet and we'll continue to treat such rebound as a corrective pattern. But in any case, break of 55 month EMA (now at 0.8090) will target 38.2% retracement of 1.1079 to 0.6826 at 0.8451. Break of 0.7807 support is needed to to be the first sign of completion of the rebound. Otherwise, further rise is now in favor.
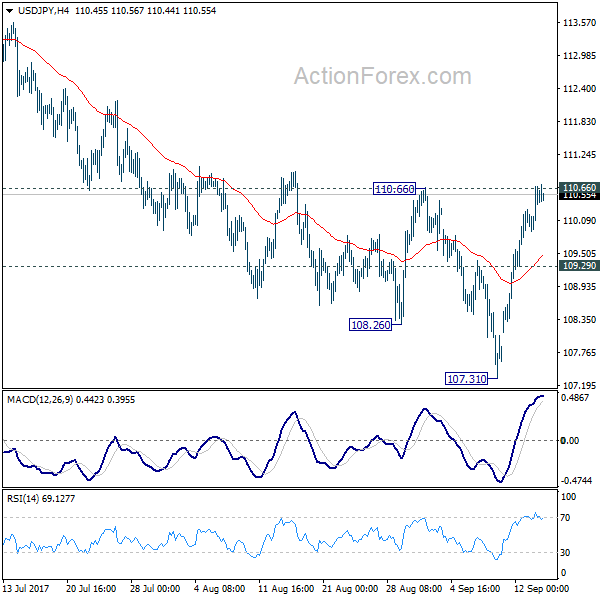
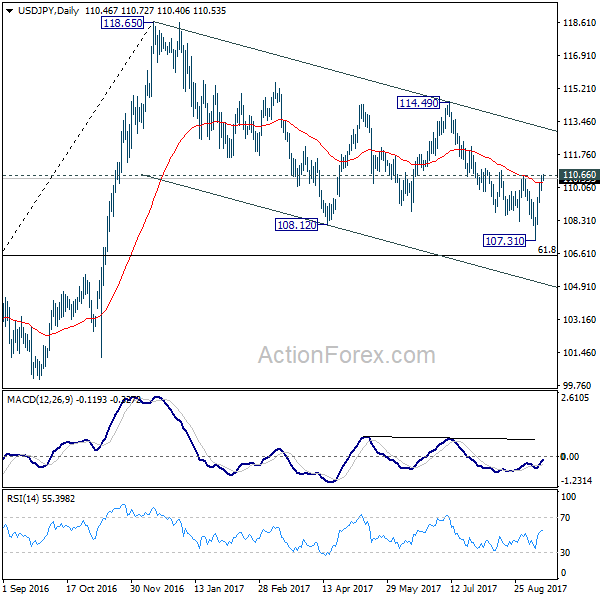
USD/JPY Daily Outlook
Daily Pivots: (S1) 110.02; (P) 110.36; (R1) 110.81; More...
USD/JPY's rebound from 107.31 extended overnight and breached 110.66 resistance. But it cannot sustain above this level yet. Intraday bias remains neutral for the moment. Below 109.29 minor support will turn bias back to the downside for 107.31. Break of 107.31 will extend the whole fall from 118.65 to 61.8% retracement of 98.97 to 118.65 at 106.48 first. We'd look for support from there to bring rebound. Meanwhile, firm break of 110.66 will confirm short term bottoming and turn bias back to the upside for 114.49 resistance.
In the bigger picture, rise from 98.97 (2016 low) is now seen as the second leg of the corrective pattern from 125.85 (2015 high). It's unclear whether this this second leg has completed at 118.65 or not. But medium term outlook will be mildly bearish as long as 114.49 resistance holds. And, there is prospect of breaking 98.97 ahead. Meanwhile, break of 114.49 will bring retest of 125.85 high. But even in that case, we don't expect a break there on first attempt.
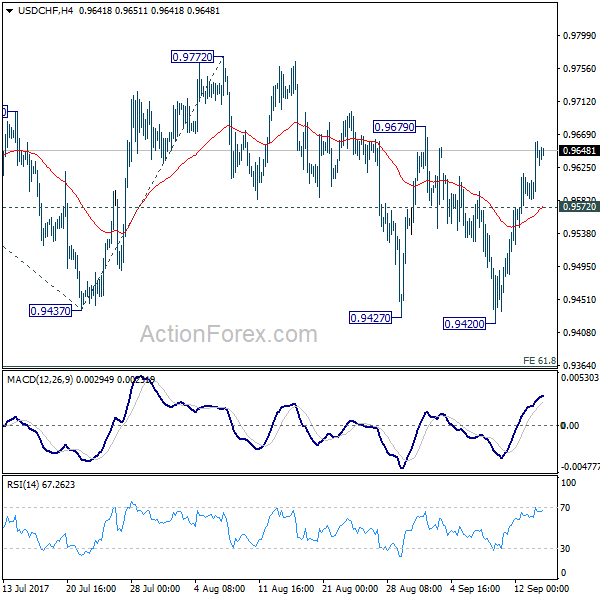
USD/CHF Daily Outlook
Daily Pivots: (S1) 0.9596; (P) 0.9628; (R1) 0.9673; More....
While the rebound from 0.9420 is strong, USD/CHF is still limited below 0.9679 resistance. Intraday bias remains neutral with near term bearish outlook. Another fall remains in favor. Below 0.9572 minor support will turn bias to the downside for 0.9420 low first. Sustained break of 0.9420 will target 61.8% projection of 1.0099 to 0.9437 from 0.9772 at 0.9363 first. However, break of 0.9679 will indicate near term reversal and turn bias to the upside for 0.9772 resistance for confirmation.
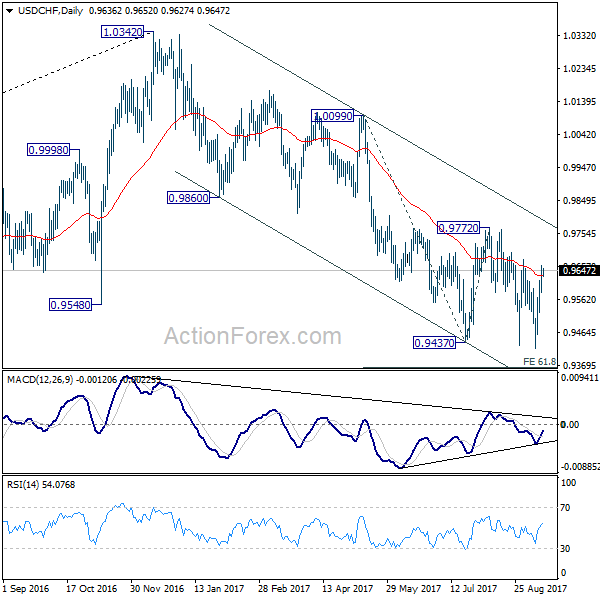
In the bigger picture, current development suggests that 0.9443 key support (2016 low) could be taken out firmly as down trend form 1.0342 extends. There are various interpretation of the price actions. But in any case, medium term outlook will stay bearish as long as 0.9772 resistance holds. Current down trend could extend to 38.2% retracement of 0.7065 (2011 low) to 1.0342 (2016 high) at 0.9090. However, break of 0.9772 will indicate that USD/CHF has successfully defended 0.9443 again and turn outlook bullish for 1.0099 resistance.
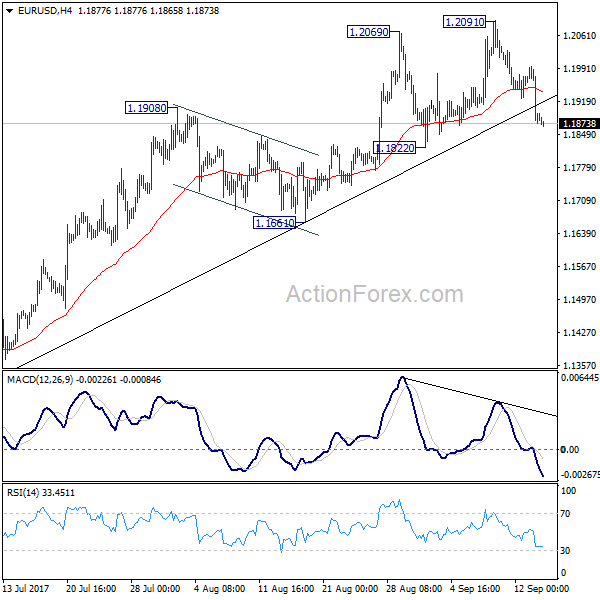
EUR/USD Daily Outlook
Daily Pivots: (S1) 1.1840; (P) 1.1917 (R1) 1.1962; More...
EUR/USD's pull back from 1.2091 extends lower but it's staying above 1.1822 support. Intraday bias neutral with bullish near term outlook. That is, another rise is in favor. Break of 1.2091 will extend larger rise from 1.0339 and target next key fibonacci level at 1.2516. But considering bearish divergence condition in 4 hour MACD, break of 1.1822 will confirm short term topping and bring deeper fall back to 1.1661 support and below.
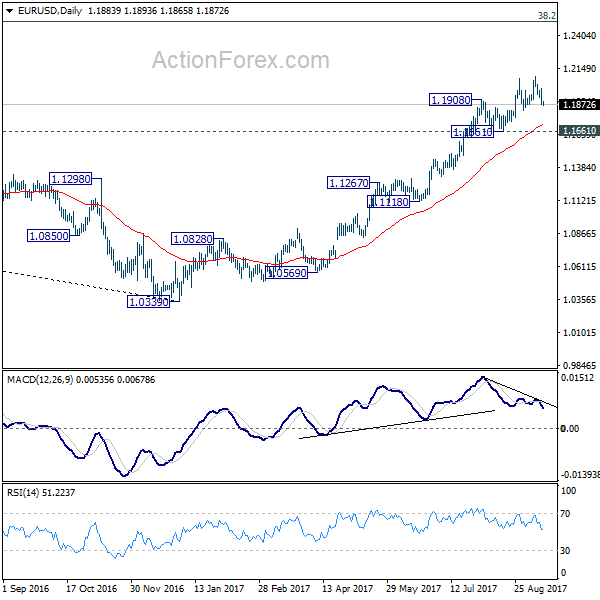
In the bigger picture, rise from medium term bottom at 1.0339 is still in progress for 38.2% retracement of 1.6039 (2008 high) to 1.0339 (2017 low) at 1.2516. However, it should be noted that there is no confirmation of trend reversal yet. That is, such rebound from 1.0399 could be a correction. And the long term fall fro 1.6039 (2008 high) could resume. Hence, we'd be cautious on strong resistance from 1.2516 to limit upside. But after all, break of 1.1661 is needed to indicate medium term topping. Otherwise, outlook will remain bullish in case of pull back.
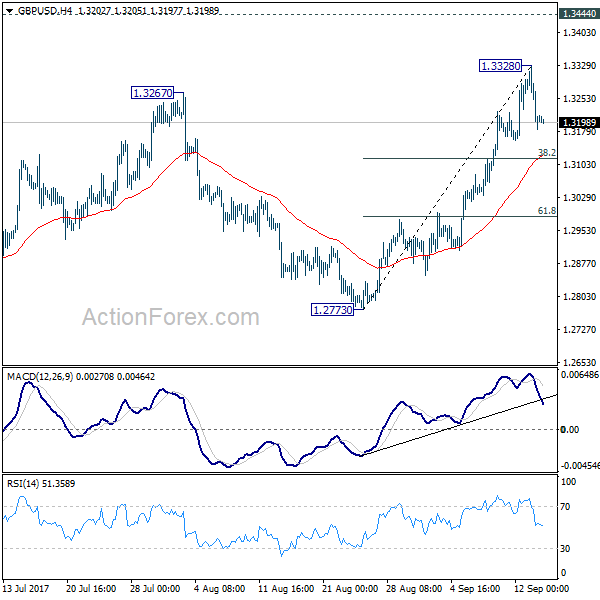
GBP/USD Daily Outlook
Daily Pivots: (S1) 1.3150; (P) 1.3240; (R1) 1.3297; More...
GBP/USD retreated after forming a temporary top at 1.3328. Intraday bias is turned neutral first. Outlook outlook is unchanged. Another rise could be seen in GBP/USD and above 1.3328 will target 1.3444 key resistance next. At this point, we'd maintain that price actions from 1.1946 are still seen as a corrective pattern. Hence, we'd expect strong resistance from 1.3444 to limit upside to bring larger down trend reversal eventually. Firm break of 38.2% retracement of 1.2773 to 1.3328 at 1.3116 will raise the chance of reversal and turn bias to the downside for 61.8% retracement at 1.2985. However, on the upside, firm break of 1.3444 will carry larger bullish implication and target 1.3835/5016 resistance first zone first.
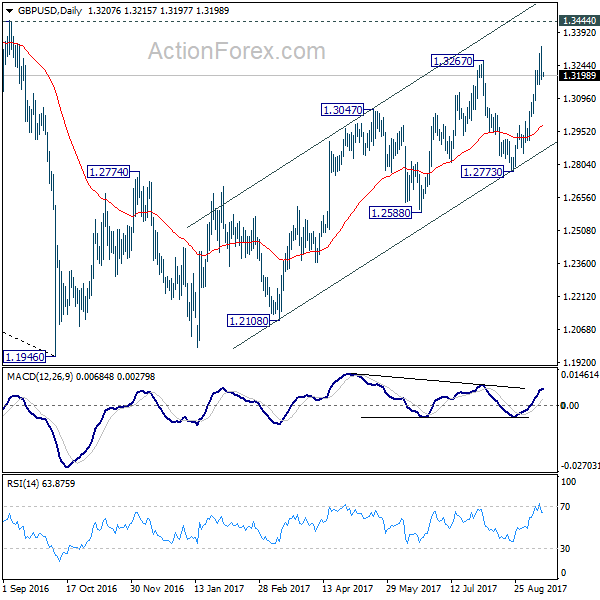
In the bigger picture, overall, price actions from 1.1946 medium term low are seen as a corrective pattern. While further rise cannot be ruled out, larger outlook remains bearish as long as 1.3444 key resistance holds. Down trend from 1.7190 (2014 high) is expected to resume later after the correction completes. And break of 1.2773 support will be the first sign that such down trend is resuming. However, considering bullish convergence condition in monthly MACD, firm break of 1.3444 will argue that whole down trend from 2.1161 (2007) has completed. And stronger rise would be seen back to 38.2% retracement of 2.1161 to 1.1946 at 1.5466.