Sample Category Title
Eco Data 9/8/17
[php_everywhere] [/php_everywhere]
Eco Data 9/7/17
[php_everywhere] [/php_everywhere]
Eco Data 9/6/17
[php_everywhere] [/php_everywhere]
Eco Data 9/5/17
[php_everywhere] [/php_everywhere]
Eco Data 9/4/17
[php_everywhere] [/php_everywhere]
Summary 9/4 – 9/8
Monday, Sep 4, 2017
[php_everywhere] [/php_everywhere]
Tuesday, Sep 5, 2017
[php_everywhere] [/php_everywhere]
Wednesday, Sep 6, 2017
[php_everywhere] [/php_everywhere]
Thursday, Sep 7, 2017
[php_everywhere] [/php_everywhere]
Friday, Sep 8, 2017
[php_everywhere] [/php_everywhere].
Weekly Economic and Financial Commentary: Slower Trend in Hiring but Consumers Still Confident
U.S. Review
Slower Trend in Hiring but Consumers Still Confident
- Employers added 156,000 new jobs in August, while the unemployment rate ticked up to 4.4 percent. Average hourly earnings rose a tick and are up 2.5 percent over the past year.
- Manufacturing activity strengthened in August, with the ISM index rising to a six-year high of 58.8.
- The Consumer Confidence Index rose to 122.9 in August on improved views of current and expected conditions.
- Headline and core PCE inflation rose 0.1 percent in July. Core inflation is up only 1.4 percent over the past year, which is the smallest increase since late 2015.
Slower Trend in Hiring but Consumers Still Confident
Payroll growth slowed in August with employers adding 156,000 jobs. It is worth noting that the initial print for August payrolls has historically seen the largest upward revisions between the first and third release. Over the past five years, August payrolls have been revised up by an average of 46,000, suggesting the extent of the slowdown may be overstated. That said, job growth for June and July was also revised lower by a total of 41,000 jobs and indicates that the trend in hiring has genuinely eased. The unemployment rate rose to 4.4 percent amid a drop in the household measure of employment. The labor force participation rate was unchanged at 62.9 percent.
On an industry basis, the composition of hiring was favorable. Manufacturers added 36,000 jobs, consistent with the leap in the ISM manufacturing employment component to a six-year high. Gains were also strong in construction (+28,000) and professional & business services (+40,000). Weakness was more evident in lower-wage sectors such as retail (+1,000) and leisure & hospitality (4,000). Despite the favorable composition of job growth, average hourly earnings rose just 0.1 percent in August, keeping the 12-month change in wages at 2.5 percent.
The labor market remains fairly tight despite the recent slowdown, which has helped to bolster consumer confidence. The Conference Board's measure rose 2.9 points in August from an already elevated reading. August's gain was mostly driven by more favorable views of current business conditions and the labor market. A larger share of respondents viewed jobs as "plentiful" while fewer viewed jobs as "hard to get." The difference between these two series, known as the labor differential, suggests that the downward trend in the unemployment rate should resume.
The expectations component also rose in August, as more consumers thought income would increase over the next six months. Greater optimism about future income followed a solid month of realized gains. Personal income rose 0.4 percent in July, led by a 0.5 percent rise in wages and salaries. While July's gain marks a welcome rebound after income was flat in June, income growth still looks tepid compared to the first few months of the year; over the past three months, nominal income has grown at a 3.0 percent annualized rate.
Spending trailed just behind income growth in July, rising 0.3 percent. While this was a shade less than what markets were expecting, it followed an upward revision to June. Moreover, low inflation has helped support real spending. After an unchanged reading in June, PCE inflation rose just 0.1 percent in July.
While low inflation has benefitted real income and spending gains of late, it remains a headache for the Fed. Both headline and core inflation are up only 1.4 percent over the past year. That marks the weakest 12-month change in core inflation since December 2015. Unlike then, however, the dollar has been weakening and commodity prices have been largely stable, which has made it harder for the Fed to consider the weakness transitory.
U.S. Outlook
Factory Orders • Tuesday
With a help from a surge in aircraft bookings, factory orders jumped 3.0 percent in June and in so doing notched the biggest gain in eight months. The aircraft surge lifted overall durables 6.4 percent, its biggest sequential increase since July 2014. As it happens, it was a jump in aircraft orders back in 2014 that was behind the surge at that time as well. The experience in 2014 should make us circumspect about what to expect on Tuesday. The record surge in July 2014 was followed by a record decline in August 2014 when durables tumbled 18.4 percent on the month. Likewise, we expect factory orders to contract 3.2 percent in July as we expect aircraft orders to decline on the month.
Purchasing manager surveys have shed a few points lately, but most still remain firmly in expansion territory. On that basis, we take the back-to-back declines in nondurable goods with a grain of salt, but will also be wary if July brings a surge on the nondurable side.
Previous: 3.0% Wells Fargo: -3.2% Consensus: -3.2% (Month-over-Month)
Trade Balance • Wednesday
Strong export growth drove the trade deficit lower in June. The decline in the trade deficit in June was the combination of a $2.4 billion increase in exports of goods and services and a $396 million decline in imports. There was broad-based strength on the export side of the ledger in June, with exports of capital goods, agricultural products, automobiles and parts, and industrial supplies and materials all posting gains during the month.
The advance estimate of real GDP growth in Q2-2017 showed that real net exports contributed positively (0.2 percentage points) to overall growth in the second quarter. Given the strong monthly momentum, real exports likely will rise further in the third quarter. In contrast, real imports of goods edged up only 0.1 percent in both May and June. Unless the recent trends in exports and imports completely reverse in the next month or two, real net exports likely will not exert much headwinds on real GDP growth in Q3.
Previous: -$43.6B Wells Fargo: -$44.5B Consensus: -$44.6B
ISM Non-Manufacturing • Wednesday
The ISM non-manufacturing composite index dropped 3.5 points to 53.9 in July, as service sector activity retreated to the lowest point in almost a year. The details of last month's report were less than encouraging, as the largest decline was in the forward-looking new orders index, which dropped 5.4 points to 55.1. The slowdown in business activity was notable in July, as it was caused by a larger share of firms reporting declining activity.
We expect the ISM non-manufacturing index to rebound in August. The rebound we expect is largely a payback story, following the sharp decline to 53.9 in July from 57.4 in June. We expect all the underlying components of the index to remain above the 50 demarcation line as the incoming data point to continued expansion in the index.
Previous: 53.9 Wells Fargo: 55.3 Consensus: 55.4
Global Review
Mixed Numbers on Japan, Strong GDP in Canada
- Industrial production in Japan declined 0.8 percent on a month-over-month basis in July, but output remains up 4.7 percent from where it was a year ago. Earlier in the week Japanese retail sales for July showed a 1.1 percent increase, which was better than expected.
- In this week's International Review on page 4, we discuss the much-better-than expected second quarter GDP report in Canada and what it signals for next week's rate decision from the Bank of Canada.
Solid Q2 GDP in Canada
Canada's economy expanded at an annualized rate of 4.5 percent in the second quarter, besting market expectations of a 3.7 percent gain. For the second consecutive period Canada's economy outpaced the rest of the G-7 economies.
In recent months, the year-over-year GDP growth numbers have crested above 4.0 percent. As the middle chart shows, that is the fastest annual growth Canada has seen in roughly a decade. The faster growth is catching forecasters and financial markets somewhat by surprise. Even the Bank of Canada (BoC), which has been known to overshoot its growth estimates from time-to-time, is forecasting only 2.8 percent GDP growth for 2017 as a whole, according to projections in its July Monetary Policy Report. Growth would need to slow meaningfully in the second half of the year to come in with anything below 3.0 percent.
Canada's households continue to boost the economy, with spending growing at an annualized rate of more than 4.5 percent each of the first two quarters of the year. We were already concerned about high consumer debt levels in Canada, and today's report increases that concern. Consumer spending was so strong in Q2 that the personal savings rate slipped below 5.0 percent in the first half of the year, after having remained above 5.0 percent in 2016. Household debt as a share of GDP was 101.4 percent as of the end of 2016—up from less than 80 percent a decade ago.
Business investment, which had been under pressure in 2015 and 2016 due to depressed commodity and oil prices, has rebounded in recent quarters, although admittedly the 1.9 percent growth rate for business investment in the second quarter marks a significant slowdown relative to the 10.5 percent surge in the first three months of the year. The Ivey PMI, a proxy for business activity, came in at 60 for the month of July. A number above 50 is consistent with continued expansion.
Business inventories ratcheted up another $14 billion after a $10.3 billion increase in the prior quarter. While the quickening demand environment in Canada may justify the stockpiling, we suspect a slower pace of inventory accumulation in the second half may be a drag on GDP growth.
After being a drag on overall growth in Q1, net exports boosted growth in the second quarter, adding seven-tenths of a percentage point to the overall top-line growth rate for the period.
Bank of Canada Meeting Next Week Is Live
The BoC lifted its overnight rate to 0.75 percent at its July meeting and has since maintained a tightening bias. Prior to Thursday's report, we would have said that the next hike could come as soon as the October meeting.
While that is still our base case scenario, we would be remiss not to acknowledge there is some risk policy-makers could act at their scheduled meeting this coming Wednesday. CPI inflation at 1.2 percent is still near the low end of the target range, meaning they are not compelled to act now.
Global Outlook
Bank of Canada Meeting • Wednesday
The Bank of Canada (BoC) elected to increase its benchmark policy rate in July by 25 basis points, marking the first increase since 2010. The change in policy came amid broad improvement in the Canadian economy. Real GDP has steadily accelerated since late 2015, led by improvements in the labor market and strong consumer spending. Core inflation had been slowing since mid- 2016 but has since begun to bottom out around 1.5 percent.
Despite the more steady inflation readings of late, core inflation remains near the lower bound of the BoC's 1-3 percent target range. In addition, the BoC is faced with the challenge of tightening policy enough to prevent increasing household debt imbalances without tightening too rapidly and causing a sharp economic disruption. As a result, we do not expect a rate hike at the meeting next week, but another hike could come as early as October.
Previous: 0.75% Wells Fargo: 0.75% Consensus: 0.75%
European Central Bank Meeting • Thursday
All eyes will be on the European Central bank (ECB) when it meets this week to discuss possible changes to its bond-buying program. Earlier this year, hawkish comments from ECB policymakers led to a brief sell-off in European sovereign bonds, leading some to believe that a tighter monetary policy was just around the corner.
The Eurozone recovery has become increasingly self-sustaining amid steady employment gains and improving business sentiment. Despite the firming growth environment, core inflation has been listless around 1 percent for the past two years. Our forecast looks for real GDP in the Eurozone to grow 2.1 percent in 2017 which would be the strongest annual average growth rate since 2007. We believe improving economic conditions and gradually accelerating prices will spur the ECB to continue tapering its bond purchases in the months ahead and cease buying bonds altogether in the first half of next year.
Refinancing Rate: 0.00% Wells Fargo: 0.00% Consensus: 0.00%
U.K. Industrial Production • Friday
Economic growth in the United Kingdom has slowed from its cyclehigh reached in 2014, but the deceleration has not been as sharp as originally feared in the wake of Brexit. That said, production in investment-oriented sectors of the economy remains soft amid the uncertainty surrounding the ongoing Brexit negotiations. Industrial production declined sharply in Q1 and, after two relatively flat readings to start Q2, finally saw a 0.5 percent jump in June.
The Bloomberg consensus expects another monthly increase in industrial production in July. The weaker sterling has likely provided a boost to the U.K. manufacturing sector. Real exports of goods and services have accelerated from the pace seen in the second half of last year. Stronger growth in the global economy, especially in the Eurozone, to which the United Kingdom sends 40 percent of its exports, is likely also boosting trade activity.
Previous: 0.5% Consensus: 0.2% (Month-over-Month)
Point of View
Interest Rate Watch
Evolution of Credit Flows
Over the last year we have witnessed an evolution of the economic fundamentals for growth, inflation, monetary policy and market expectations for federal policy actions. For financial markets this evolution has been accompanied by changes in credit flows.
Inflation and Policy Expectations and Global Capital Flows
Inflation has risen less than expected by policy makers and as a result, marketdetermined interest rates have risen less than the consensus. Meanwhile the election of President Trump has altered policy expectations.
In response to lower-than-anticipated inflation, global Treasury purchases have risen as illustrated in the top graph. Meanwhile, global investors have sought equity opportunities and interest in corporate debt continues to be very steady. Continued economic growth and anticipated policy actions have certainly prompted global investors to seek U.S. financial assets.
Caution on Commercial Real Estate
Demand for commercial real estate loans has diminished as the economic cycle matures (bottom graph) while banks have tightened credit standards for the same credit. Multifamily residential has fallen, intimating that the apartment construction boom is ending as vacancy rates for apartments have risen over the last two years.
Profit Margins and Equity Capital
The late cycle decline of non-financial profit margins is typical of every economic cycle. The pattern reflects the problem that nominal top line growth, proxied by the combination of real GDP growth and inflation, has not significantly altered over the last three years and yet labor and interest expense has risen for many corporations.
As a result, equity returns have diminished raising a concern that the profit incentives have diminished for adding to capital and labor inputs to improve economic growth ahead. Here is where the lack of progress on fiscal policy may have a negative impact on growth going forward.
Credit Market Insights
Financial Stress of Natural Disasters
Natural disasters such as the recent flooding in Houston can be a major source of financial stress, particularly for homeowners who suffer property damage.
Homeowners insurance does not typically cover flood damage. While The Federal Emergency Management Agency (FEMA) requires that mortgage-holders who live in special flood hazard areas purchase flood insurance, this requirement is not wellenforced and only applies to homes with a greater-than one in four chance of flooding over the course of a 30-year mortgage. In Harris County, which includes Houston, only 15 percent of housing units have flood insurance, according to data from FEMA and the American Community Survey.
Government assistance can also step in, but the scope is limited. Grants from FEMA's Individual Assistance Program, meant to help with home repair, are capped at $33,000, for instance.
After a disaster, many homeowners are therefore left to bear a sizeable portion of the cost of damage to their homes. This increases the vulnerability of affected individuals to financial shocks and can reduce their ability to cover loan payments. The president's disaster declaration for the Houston area imposes an automatic 90-day moratorium on foreclosures for homes with FHA-insured mortgages, allowing some relief, but mortgage defaults and foreclosures may tick up after this period. Credit quality more generally is also likely to deteriorate in Houston in the near-term.
Topic of the Week
A Heavy Blow to Houston & The U.S.
Hurricane Harvey inflicted significant damage along the Texas Gulf Coast, with flooding accounting for most of the damage. Homes, businesses and automobiles all suffered catastrophic losses, of which insurance will only pick up a small part. While it is still too soon to compile a precise estimate, total losses are likely to be in the ballpark of $90 billion. Damages to homes will likely total close to $40 billion and losses of automobiles and other household items will be in the neighborhood of $5 billion. With an economy of more than $550 billion annually, business interruption will likely total at least $28 billion. Adding in damages to commercial property and public infrastructure, the total rises to $90 billion.
Because most of the damage was caused by flooding and not wind, many of the losses are uninsured. Federal disaster relief payments will help offset part of this but homeowners will ultimately bear much of this loss.
Houston's economy is enormous. The region is home to nearly 7.8 million people and has added 824,000 people since 2010. That gain eclipses the entire population of Charleston, South Carolina. The Greater Houston GDP tops $550 billion, which equates to about 3 percent of the nation's GDP. Moreover the region has accounted for 6.6 percent of the nation's GDP growth since 2010.
The loss of economic activity from such a rapidly growing area is likely to show up in the national economic data. Houston is the number one market for new single-family permits and also accounts for about 3 percent of existing home sales. Both are likely to take a hit in coming months but should rebound vigorously in 2018. Motor vehicle sales, retail sales and employment will all likely be negatively impacted as well.
With much of its economy tied to the capital-intensive energy business, Houston will get up and running fairly quickly. Rebuilding will take much longer, however, as insurance and federal aid will need to be sorted out. Zoning requirements may also be tightened in efforts to reduce the risks from future storms.
The Weekly Bottom Line: Feeling The Impact Of Harvey
U.S. Highlights
- Substantial positive revisions to Q2 US GDP indicated stronger momentum going into the third quarter than previously thought, with Hurricane Harvey expected to shave 0.1-0.4 ppts. off growth in Q3.
- Inflation continued to be stubbornly elusive in July but we still expect a hike by the Fed in December, given that inflation will likely strengthen in the coming months.
- Global economies continue to strengthen alongside the US, with China's Caixin manufacturing PMI expanding to its highest level in six months in August, led by strong foreign demand for goods.
Canadian Highlights
- Hurricane Harvey is impacting Canada via higher gasoline prices and lower crude oil prices. On average, prices at the pump have jumped by 10 cents per litre this week, while the WTI-WCS spread widened by 20% to $11.75.
- Real GDP grew by 4.5% in the second quarter, marking the best 4-quarter performance since 2006. Growth of 0.3% in June provides a strong handoff for Q3.
- The CFIB Business Barometer fell for a third consecutive month in August, suggesting that the robust pace of growth is unlikely to last.
U.S. - Inflation Remains Elusive in Q3
It was a busy week for data this week in the US, with investors looking for clues on how the economy is performing and whether it warrants further tightening. Substantial positive revisions to Q2 US GDP indicated stronger momentum going into the third quarter than previously thought, with Q2 growth revised up to a robust 3.0% annualized. However, Hurricane Harvey, which made landfall in Southeast Texas last week, looks to be a transitory obstruction for the economy in Q3. The storm is expected to shave 0.1-0.4 ppts. off growth but a similar acceleration in Q4 should leave the second half of the year unchanged on balance. Harvey will also necessitate the passage of a disaster assistance package by the federal government. On that note, until further details surrounding policy and tax reform materialize, investors will remain fixated on economic data.
Evidence to support the Fed's tightening path was mixed as the week progressed. July's personal income & spending report highlighted the pivotal role of the consumer in the economic recovery, with strength in real spending apparent. But the missing piece of the puzzle continues to be inflation, which has been stubbornly elusive during this recovery. And this was compounded by Friday's jobs report that indicated relatively subdued wage growth -a trend that does not bode well for the inflation outlook (Chart 1). We still expect a hike by the Fed in December, but expect that inflation will materialize in the coming months. Manufacturing activity displayed pronounced strength in hiring in August while the positive ISM reading for the month prefaces continued strength in the sector going forward (Chart 2). As such, investor confidence in the American economy remains intact, which alongside weaker inflation has supported US equities.
Asian economies have also shown increased momentum lately. Case in point, China's Caixin manufacturing PMI expanded to its highest level in six months in August, led by strong demand for exports. That's a welcome development given concerns regarding the economy's slowing growth this year and the role that government debt has had in stimulating growth. Other Asian economies echoed this constructive tone, leading the MSCI Asia Pacific Index to a level just shy of a decade high.
European equities also reaped the benefits of improving economic data. Despite August's strong inflation reading in the Eurozone, the ECB is expected to leave its policy stance unchanged at next week's meeting. The committee's monetary policy path is complicated by the differing rates of recovery within the Eurozone. Germany and Northern Europe have displayed strong growth, while Southern economies including Greece and Italy are still grappling with slow employment growth and an elevated euro that is proving to be a barrier to export growth.
With a relatively quiet data release schedule for next week, investors will turn their attention to the array of speeches being made by FOMC members. Of central importance will be their views on the soft inflation and wage prints in recent data. Ultimately, we do not expect these developments to dissuade the Fed from beginning balance sheet normalization in the coming weeks, but some improvement on the inflation front is likely to be needed before another rate hike by the Fed.
Canada - Feeling The Impact Of Harvey
This week started off with Hurricane Harvey in the spotlight, as it barreled across Southeast Texas and Louisiana causing massive flooding and destruction in the area. While far removed from the devastation, Canada was not left unscathed by the tropical storm. Harvey has wreaked havoc on the energy industry - shutting in roughly a tenth of production and a third of all U.S. oil refining capacity - with the outages affecting the Canadian economy. The most visible impact has been on gasoline prices, which have risen on average by about 10 cents per litre since Monday, reaching the highest level seen in two years. The increase has been even more pronounced in some Canadian cities. Canada imports some refined products from the U.S., and the market is tightly integrated, suggesting no relief for drivers over the near-term. In fact, further increases expected over the weekend could push pump prices up to a 3-year high. It is too early to tell how long the flooding in Texas will persist, or how long refineries will be shut down. But, it is safe to believe that drivers will be facing elevated pump prices for several weeks.
Another impact has been on the Canadian oil sands, which have seen a drop in demand from the Gulf coast refineries. This has weighed on the price they receive for their heavy oil. The spread between Western Canadian Select - the benchmark for heavy oil - and WTI (which fell as expectations for lower refinery demand outweighed the oil production shutdowns) widened by 25% to $11.75 this week, marking the largest discount since March. Moreover, U.S. supplies of oil sands diluent (which is used to dilute bitumen so it can flow through pipelines) has been curtailed given a pipeline shutdown. Roughly a third of diluent used by oil sands producers comes from south of the border. While demand for Canadian oil may be weak in the near term, it will likely rebound once refining resumes.
On a brighter note, the highlight of the week for the Canadian economy was yet another stellar GDP report. Although backward looking, it showed that the economy expanded by a whopping 4.5% in the second quarter, marking the fourth straight quarter of robust growth. In fact, this is Canada's best four-quarter performance since 2006. What's more, economic activity grew by a solid 0.3% in June, providing a strong handoff for the third quarter.
That said, a repeat performance of the first half of the year is unlikely going forward. The small business barometer showed that optimism among businesses fell in August for a third consecutive month. This is typically a leading indicator, with these recent declines and weakness in forward looking indicators pointing to a deceleration in economic activity. Indeed, early tracking does suggest that economic growth will slow in the third quarter. However, it is expected to remain at an above-trend pace near 3%, which could push the economy into excess territory. Following the GDP report, odds of a rate hike in September edged up. However, given that there has been no communication from the Bank of Canada since its last meeting, we would be surprised to see a move next week. We do expect the rate hiking cycle to continue though, with a 25 basis point hike in October, followed by two more in 2018.
Canada: Upcoming Key Economic Releases
Canadian International Trade - July
Release Date: September 6, 2017
Previous Result: -$3.60bn
TD Forecast: -$3.30bn
Consensus: -$3.35bn
The goods trade deficit is forecast to narrow modestly to $3.3bn in July on a combination of weaker import and export activity. CAD appreciation should act as a driving force behind the pullback on both sides of the ledger after the loonie soared by roughly 4.5% during the month, though there are also a few one off events which could make for a noisy report. Gold bullion imports surged by 40% m/m in June and a full correction should single handedly shave $400m from the deficit. The stronger Canadian dollar should feed through to softer trade activity where FX passthrough is most prominent, namely agriculture and other unrefined resources, of which Canada is a net exporter. Motor vehicle exports should come under pressure in light of declining US demand, a pullback in Canadian production and downward pricing pressures. Imports however should remain well supported by a resilient Canadian consumer.
Canadian Employment - August
Release Date: September 8, 2017
Previous Result: 10.9k, unemployment rate: 6.3%
TD Forecast: 10k, unemployment rate: 6.3%
Consensus: 15k, unemployment rate: 6.3%
The Canadian economy is forecast to add 10k jobs in August, little changed from the prior month but subdued in comparison to the lofty pace in Q2. Job growth should skew towards public and private employees, which would coincide with a pullback in self-employment after a strong two months. Last month's 35k gain in full time employment was in line with the six-month trend and while we could see some moderation from these levels, there is no catalyst to suggest an outright correction. The unemployment rate should hold steady at 6.3%, a record low for the current cycle, though the risks lean a 6.4% print should last month's pullback in labour force participation correct. Wage growth, currently sitting at a subdued 1.2% y/y, should a modest pickup on the heels of the tightening in labour market conditions and muted base-effects from last August.
Dollar Mixed After Jobs Miss Ahead of BoC and ECB
Mixed economic data and political turmoil has hurt USD
The US dollar is mixed against majors after staging a comeback late in the week. The USD regained some ground even though the biggest indicator in the market the U.S. non farm payrolls (NFP) report disappointed by adding less than the expected number of jobs (156,000 versus 180,000) but the data point that had more significance was the low pace of growth of wages at 0.1 percent. A third rate hike for US interest rates could be pushed back to next year if inflation does not pick up convincing the Federal Reserve.
The Canadian dollar was of the biggest movers against the USD. Canadian GDP for the second quarter destroyed expectations with a 4.5 percent quarterly growth when a slight slowdown was expected. The strength of the economy has put a second rate hike to the Canadian benchmark rate firmly on the table. The Bank of Canada (BoC) will be publishing a rate statement on Wednesday, September 6 at 10:00 am EDT.
The EUR kept losing ground as the week passed with reports of the council not having a final decision on its plans for tapering quantitive easing. The lack of communication has allowed the USD to appreciate versus the single currency ahead of its September monetary policy meeting. The European Central Bank (ECB) will publish its benchmark rate on Thursday, September 7 at 7:45 am EDT. ECB President Mario Draghi will offer a press conference at 8:30 am EDT. There is a sense of urgency as the ECB Governing council will hold its first formal talk on the subject leaving just two meetings before the end of the year.
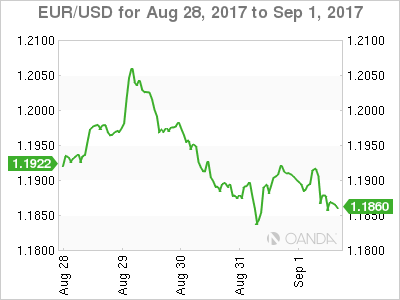
The EUR/USD dropped 0.154 percent in the last five days. The single currency is trading at 1.1868 near weekly lows after the USD managed to recover from losses earlier in the week when the pair touched 1.20 only to start sliding downward as positive US data was released. The U.S. non farm payrolls (NFP) was the most anticipated indicator this week and it disappointed with a headline jobs miss and soft wage growth in the United States.
The Trump administration has used hardball tactics ahead of the second round of NAFTA renegotiations that are taking place in Mexico City. Although the treaty itself leaves the door open for any member to exit the deal by giving six months notice, there are winners and losers of the deal in all three countries. American businesses would be hurt by a sudden end to the agreement, although their gain came from the job losses suffered in America that propelled Mr. Trump into the White House. American companies are hard at work lobbying for the deal to be reshaped for the modern world, but instead are getting anxious at Trump's tweets threatening to end NAFTA. The three nations have signed non-disclosure agreements on the negotiations leaving the market to speculate on the talks as they happen.
The comments from European Central Bank (ECB) President Mario Draghi were thought to be one of the most awaited during the Jackson Hole summit in late August, but failed to bring any light into what the next steps would be for the central bank. With their September monetary policy meeting close at hand, some communication around the timeline of the tapering of quantitive easing. Little word could mean no plans to launch the tapering program in September, leaving it up once again for a December monetary policy with a major decision like in previous years. The ECB will post its rate statement on Thursday, September 7 at 7:45 am EDT and will be followed by a press conference with Mr. Draghi at 8:30 am EDT.
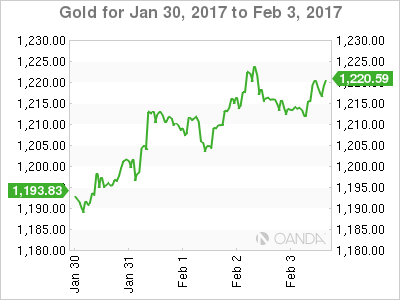
Gold rose 2.44 percent this week. The yellow metal is trading at $1,323.70. The commodity was the biggest winner of a soft August employment report. The lack of a strong wage growth component is putting into question the U.S. Federal Reserve's plans for a third rate hike in 2017 and helping gold reach higher. The metal had its second best month in August only after January. The threat of North Korea as well as the turmoil in Washington and the impact of Hurricane Harvey had the dollar under pressure from geopolitical events. Macro indicators offered little help with Jackson Hole comments offering no support of the USD and although the ADP jobs report and an improvement on second quarter GDP were offset by the miss of the NFP report.
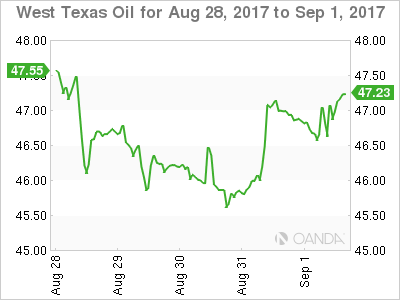
US Oil prices dropped 1.054 percent this week. The price of West Texas Intermediate is trading at $47.04 after the impact of Hurricane Harvey has caused a glut of crude oil, while limiting the capacity to refine it into gasoline making the price of the distillate soar. The Department of Energy has released 4.5 million barrels of the US strategic reserve destined to be refined in Louisiana to try to keep prices stable until refineries in Texas can reopen.
US oil interests are also under threat as the NAFTA trade talks take place in Mexico City. The treaty has allowed US producers to sell refined products back to Canada and Mexico, but could end up being caught in a tariff war if Trump decides to walk off the negotiating table.
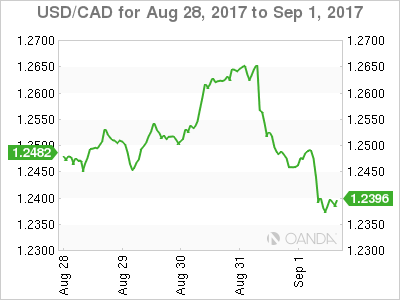
The USD/CAD fell 0.712 percent in the last five days. The currency pair is trading at 1.2384 near weekly lows. The Canadian dollar took advantage of the ills that affect the USD and combined with strong economic indicators appreciated during the week.
The Canadian economy surprised to the upside with a 4.5 percent GDP growth in the second quarter being expectations of a 3.7 percent increase. This makes Canada the best performing country in the G7 and has put a rate hike before the end of the year firmly on the table. The Bank of Canada (BoC) is set to deliver its rate statement on September 6, which could be too early with market analyst favouring the October monetary policy meeting which could give the central bank enough time to see what its American and European counterparts will be launching in September. Bond markets are pricing in a 37.8 percent probability of a rate hike in September, up from yesterday's 20.9 percent. The October rate hike has a 86.8 percent chance according to fixed income prices.
The Bank of Canada (BoC) will release its rate statement on Wednesday, September 6 at 10:00 am EDT. The better than expected second quarter GDP has increased the probability of a rate hike in September, but the majority of analysts still view October as a more likely scenario. The Canadian benchmark rate sits at 0.75 percent and still 25 basis points below where the rate was in early 2015 before the BoC made two proactive rate cuts.
Market events to watch this week:
Monday, September 4
- 4:30 am GBP Construction PMI
Tuesday, September 5
- 12:30 am AUD Cash Rate
- 12:30 am AUD RBA Rate Statement
- 4:30 am GBP Services PMI
- 9:30 pm AUD GDP q/q
Wednesday, September 6
- 8:30 am CAD Trade Balance
- 10:00 am CAD BOC Rate Statement
- 10:00 am CAD Overnight Rate
- 10:00 am USD ISM Non-Manufacturing PMI
- 9:30 pm AUD Retail Sales m/m
- 9:30 pm AUD Trade Balance
Thursday, September 7
- 7:45 am EUR Minimum Bid Rate
- 8:30 am EUR ECB Press Conference
- 8:30 am USD Unemployment Claims
- 11:00 am USD Crude Oil Inventories
- Tentative CNY Trade Balance
Friday, September 8
- 4:30 am GBP Manufacturing Production m/m
- 8:30 am CAD Employment Change
*All times EDT
Take the ISM with a Grain of Salt
The 58.8 reading for ISM signals the fastest pace of manufacturing growth in six years. The factory sector is undoubtedly on an upswing, but August can be a head-fake. Watch for inventories to boost growth in H2.
After Lame Jobs Report, ISM Does Not Disappoint
After the dud employment report earlier this morning, the latest print for the ISM manufacturing index offers a little more excitement. Manufacturing activity in August rose to its highest level (58.8) since 2011, according to the Institute for Supply Management.
Most months, the ISM release becomes available prior to the almighty jobs report, but when the stars align such that the first Friday of the month happens to fall on the 1st, the jobs number hits the wire an hour and a half before the ISM. That can matter because the employment component of the ISM can offer clues about the direction and magnitude of hiring. In this case, advance knowledge might not have helped.
The consensus overshot the extent of job growth for August, but expectations might have been even greater if we had advance knowledge that the ISM would shoot higher and the employment component would soar to a six-year high of 59.9.
Admittedly, manufacturing jobs have gone 10 months without a decline and the 36,000 increase reported in August was the biggest monthly increase in four years. So, maybe this ISM report is not such a red herring after all.
Remember What Kipling Said about Triumph and Disaster
Before we get too far ahead of ourselves celebrating the great manufacturing renaissance, it bears noting that the August print for ISM last year was an aberration and this may be as well. August has proven to be a difficult month for seasonal adjustment at the Labor Department and perhaps the ISM has had similar issues. Last year in August the ISM suddenly and unexpectedly fell below 50, signaling contraction, but a month later the ISM jumped to 51.7 and has not returned to contraction territory since.
Tell Me an Inventory Story
As we wrote in a recent special report, "Inventories: The Tail That Wages the Dog in Q3?", after an uncharacteristically calm stretch, inventory dynamics may play a big role in the third quarter. There are some clues in today's ISM about the current state of inventory dynamics. In fact the two largest overall moves in the month were in the inventories component, which jumped 5.5 points, signaling the fastest pace of stockpiling in seven years and customer inventories, which dropped 8.0 points to 41.0 which suggests customer inventories are too low—the lowest in fact that we've seen in six years. The takeaway in our view is that there is a bulge getting ready to work its way through the supply chain and as that plays out we expect inventories to be additive to topline GDP growth in the second half of 2017. Of course, Hurricane Harvey will introduce an additional degree of variability which we will be monitoring.