
Sample Category Title
Market Update – Asian Session: North Korea Successfully Tests Hydrogen Bomb
Asia Summary
Asian equity markets opened mostly to the downside with North Korea conducting its sixth-ever nuclear test on Sunday, which according to Japanese officials resulted in seismic readings that were 10 times more powerful than the country's previous test a year ago. North Korean state media claimed the country has developed a hydrogen bomb that could attach to an intercontinental ballistic missile. The test was met with widespread condemnation across the globe. US Defense Secretary Mattis said the US has many military options to deal with the latest provocations, but that it was not seeking total annihilation of the country. President Trump scheduled a meeting with military leaders to discuss the situation, while also tweeting the US is 'considering, in addition to other options, stopping all trade with any country doing business with North Korea.' Analysts in general think that the market impact this time around will linger longer than previous as provocations have become more frequent and more successful. Though lacking a major event should return to normal in the near term.
On the whole markets traded off N. Korea with earnings season mostly over and no major economic data. In China metals continue to rally and gasoline prices in the US continue to climb on supply concerns after Hurricane Harvey. US markets will be closed Monday for a holiday, on Friday US nonfarm payrolls increased 156K in August after a downwardly revised 189K gain (was 209K) in July, below the 180K consensus.
Key economic data
(JP) JAPAN AUG MONETARY BASE Y/Y: 16.3% V 15.6%E; MONETARY BASE END OF PERIOD: ¥469.2T V ¥468.3T PRIOR
(AU) AUSTRALIA Q2 BUSINESS INVENTORIES Q/Q: -0.4% V 0.3%E; CORPORATE OP PROFIT Q/Q: -4.5% V -4.0%E
(AU) AUSTRALIA AUG ANZ JOB ADVERTISEMENTS M/M: 2.0% V 1.6% PRIOR
Speakers and Press
China/Hong Kong
(CN) China Securities Regulatory Commission (CSRC) announces draft rules designed to give stock exchanges more power in regulating the market - Shanghai Securities News and Securities Time
(CN) Former PBoC Adviser Yu Yongding urges achieving free float of yuan currency rate as soon as possible - Chinese Press
(CN) China shadow banking sector grew by an annualized 36% between 2010 and the end of 2016, to reach a total CNY122.8T - Nomura
Korea
(KR) Follow Up: USGS: Magnitude 5.1 ‘mining explosion’ detected East-Northeast of Sungjibaegam, North Korea – US financial press
(KR) South Korea Fin Min Kim: facing increased geopolitical risks; market impact from North Korea wont be short term
(KR) South Korea Environment Ministry conditionally approves THAAD environment report
(KR) South Korea President Moon: To seek maximum sanctions and pressure on North Korea; agree with Japan PM Abe to a stronger response against North Korea
Japan
(JP) Japan Chief Cabinet Sec Suga: On the call Abe and Putin agreed North Korea situation is grave; Japan and China to increase North Korea pressure on various levels
Asian Equity Indices/Futures (00:00ET)
Nikkei -1.0%, Hang Seng -0.5%; Shanghai Composite +0.1%, ASX200 -0.5%, Kospi -0.8%
Equity Futures: S&P500 -0.4%; Nasdaq100 -0.5%, Dax -0.4%, FTSE100 -0.2%
FX ranges/Commodities/Fixed Income (00:00ET)
EUR 1.1890-1.1857; JPY 109.93-109.26; AUD 0.7973-0.7930; NZD 0.7145-0.7144
Dec Gold +0.6% at $1,338/oz; Oct Crude Oil +0.3% at $47.42/brl; Sept Copper +0.6% at $3.14/lb
(US) According to AAA, on Sunday average retail gasoline price rise 1% to $2.621/gallon from $2.59 on Saturday; +10.9% w/w
(CN) PBoC skips OMO v skipped 7 and 14-day prior; Drains net CNY140B v CNY50B prior (3rd consecutive skip)
USD/CNY (CN) PBOC SETS YUAN REFERENCE RATE AT: 6.5668 V 6.5909 PRIOR (6th consecutive stronger setting)
(KR) Bank of Korea (BOK) sells KRW430B in 6-month bonds at 1.34%
(KR) South Korea sells KRW1.56T vs. KRW1.55T target in 5-year Govt bonds; Yield: 2.005% v 1.970% prior
(TH) Thailand sells combined THB20.7B in 3-month and 1-yr bills
Equities notable movers
Australia/New Zealand
RAP.AU Reaffirms commitment for a follow-up SMARTCOUGH-C Study; +23.9%
ADO.AU Signed agreement to sell 100% stake in Diasource unit for €15.9M; CEO Jef Vangenechten to resign; +22.2%
88E.AU Flow testing on ICEWine number 2 resumed on Aug 31st; -20.9%
Risk Aversion Spreads After Latest Missile Test
- Gold touches new high on safe haven flows;
- US and Canada bank holiday's likely weigh on volumes;
- ECB stages another mini intervention ahead of Thursday's decision.
Financial markets are back in risk aversion mode on Monday after the latest nuclear test from North Korea on Sunday triggered the usual safe haven rush.
Gold touched new 10-month highs earlier in the session before finding resistance around last November's peak. The yellow metal is currently around 0.7% higher on the day and continues to hold around the day's high which suggests safe haven appetite has not waned as the Asian session has progressed.
Often these knee jerk reactions to such provocation don't last too long but with these tests happening more frequently and the US responding with threats of aggression, these “risk off” periods may last a little longer. Gold has benefited greatly from this heightened geopolitical risk over the last month or two, breaking out of the $1,200-$1,300 range it had spent most of the year trading within in the process. It last traded around these highs throughout the second half of last year and found a lot of technical resistance between here and $1,375, which we may well see again.
With markets in risk off mode, equities are expected to struggle at the open, with futures pointing to losses between a quarter and a half of one percent. The yen and the Swiss franc are also getting their usual safe haven boost to complete the set.
The bank holiday's in the US and Canada today will likely result in a much quieter session on Monday, particularly given the lack of economic events that typically accompanies them. There are a few pieces of data from around Europe being released this morning including the UK construction PMI, Spanish unemployment and eurozone investor confidence but after that it goes very quiet.
The rest of the week will be anything but quiet though, with numerous central banks scheduled to meet. The most notable of these will be the ECB, which meets on Thursday. This week's meeting was widely believed to be the one at which the central bank will announce further tapering of its QE program but with policy makers becoming increasingly uncomfortable with the euro exchange rate, they may now hold off on the announcement until later in the year.
The timing of Friday's comments from an ECB “source” alluding to a delay in a tapering decision seems far more than a coincidence, coming minutes after the jobs report release which weighed on the dollar and appeared on course to push EURUSD through 1.20 once again. With these mini interventions from the ECB becoming a bit of a habit, it will be interesting to see if traders start to become nervous around these levels or decide to test the central bank's resolve.
Acceleration Of Nuclear Test Reinforces Kim’s Brinkmanship Diplomacy
Korean peninsula tensions have escalated further as North Korea confirmed the sixth nuclear test on Sunday, following a missile launch over Japan on August 29. In response to the growing threat of its closest neighbor (and ethnic brother), South Korea has earlier today conducted a missile drill and pledged to implement contingency measures to stabilize the economy in case of drastic deterioration. In the US, Defense Secretary James Mattis warned of "massive military response" to North Korea's intimidation, echoing President Donald Trump's comment 'all options are on the table' following the rogue regime missile launch last week. While US' warnings imply that a military strike against North Korea cannot be ruled out, we believe the chance is low as it is the least preferred option for all major stakeholders.
North and South Korea
As one of the world's poorest countries without the ability to be self-sufficient, North Korea has been adopting brinkmanship diplomacy over the past 28 years (suspected to have begun nuclear developments in 1989) to sustain its international position and acquire international aids on food and money. Guardian (https://www.theguardian.com/world/2015/may/29/north-korea-nuclear-brinkmanship) has made a good summary of its routine:
Step 1: North Korea wants or needs something, most often food or petroleum.
Step 2: North Korea generates tension and gains international attention.
Step 3: Countries initially ignore the activity and attribute it to North Korea merely 'acting up'.
Step 4: North Korea increases tension through increasingly violent acts or extreme rhetoric.
Step 5: The world finally pays attention and agrees to discuss a resolution.
Step 6: North Korea agrees to stop its nuclear and missile programs in exchange for what it needs or wants: food, petroleum or other aid.
Step 7: Once the aid is received, North Korea soon finds – or invents – a way to justify breaking its commitment.
Step 8: Repeat
Therefore, the ultimate intention of North Korea's nuclear development is not to engage in military conflicts but to survive. South Korea is not ready for war either, casualty and economic crisis to be brought by war would be massive
China:
As the biggest trading partner of North Korea, it is estimated that 90% of North Korea's imports
(mainly machinery, food, oil and refined petroleum products) are from China. China and Russia are allegedly supporting the rogue regime's nuclear developments. China is also the biggest destination of North Korea's exports. China has been reluctant to impose sanctions on North Korea and is believed to continue trading with its neighbor under secret channels despite the sanctions.
Besides being ideological comrades, China's support of North Korea has more important strategic reasons - both on facilitating its rise as the leader in Asia Pacific and counterbalancing the US in the world arena. Trump's pressure on China to act more on the denuclearization of North Korea has evidenced China's major role in North Korea's problem. As a bargaining chip for China in international relations, it is believed that China supports North Korea's nuclear development as long as it does not evolve into military conflict. The consequence of a war is highly uncertain. Basing on the assumption that North Korea would be defected by the military of the US and its allies, refugee problem would be a headache to China, given its close proximity to North Korea. The impacts on Asia Pacific international relations can be huge. Some believe that an enlarged South Korea (after conquering the North) would make the US alliance in the region more powerful, while other believe the US' influence in the region would reduce as a major threat is eliminated. Only time will tell which view is correct but China, as well as the US, won't want to risk.
US
The stances of the US and President Trump can be different. Traditionally, the US has been adopting 'strategic patience', while insisting denuclearization of North Korean, on the Korean peninsula issue. The then-president Barack Obama's announcement of a 'pivot to Asia' in 2011, followed by proposal of the Trans-Pacific Partnership, was aimed at reassuring its Asian allies of the US' commitment to the region. However, Trump's swift withdrawal from TPP as soon as he has been in office, together with his close relations with Russia, has made his stance on North Korea's problem more ambivalent. While Trump has been keen on exchanging war of words with Kim jong-un, he is not ready for a real military strike when he is not yet capable of handling domestic politics well.
While we believe the chance of actual military strike is remote, ongoing missile tests by North Korea would cause financial market volatility. Therefore, safe-haven assets such as Japanese yen, Swiss franc and gold would be attractive during times of intensified tensions.
Daily Technical Analysis: EURUSD, GBPUSD, USDJPY, USDCHF
EURUSD
The EURUSD attempted to push higher last week topped at 1.2070 but whipsawed to the downside and closed lower at 1.1863. Overall I remain bullish but as long as stay below 1.2000 price is still in a valid bearish correction phase. The bias is neutral in nearest term. Immediate support is seen around 1.1823. A clear break and daily close below that area could trigger further bearish pressure testing 1.1750 – 1.1700 region. On the upside, a clear break above 1.2000 psychological level would potentially end the current bearish correction.
GBPUSD
The GBPUSD was indecisive last week. Price has been moving sideways without clear direction between 1.2980 – 1.2870 as you can see on my daily chart below and we need a clear break from that range area to see clearer direction. The bias is neutral in nearest term. A clear break and consistent movement above 1.2980 could trigger further bullish pressure testing 1.3030 before targeting 1.3125 region. On the downside, a clear break and daily close below 1.2870 would expose 1.2700 area or lower. Overall I remain neutral.
USDJPY
The USDJPY attempted to push lower last week slipped below 108.70 but whipsawed to the upside and closed higher at 110.25. Price has been moving sideways without clear direction between 108.70 – 111.00 range area for 5 weeks as you can see on my daily chart below. The bias is neutral in nearest term. Immediate support is seen around 108.70. A clear break and daily close below that area could trigger further bearish pressure testing 108.00 – 107.50 region or lower. Immediate resistance is seen around 110.50 followed by 111.00. Overall I remain neutral and prefer to stand aside for now.
USDCHF
The USDCHF attempted to push lower last week slipped below 0.9450 key support but whipsawed to the upside and closed higher at 0.9645. The bias is neutral in nearest term but the bullish pin bar formation printed on daily chart last week after a false break below 0.9450 still suggests a potential bullish view. Immediate resistance is seen around 0.9700. A clear break and daily close above that area could trigger further bullish pressure testing 0.9765 – 0.9807 key resistance which is a good place to sell. Immediate support is seen around 0.9525. A clear break and daily close below that area would trigger further bearish pressure retesting 0.9450 key support. I prefer to stand aside for now.
North Korea Makes Gold And Silver Fly, But Beware The RSI
A thermonuclear North Korea has traders buying precious metals this morning, but be cautious of overbought RSI's.
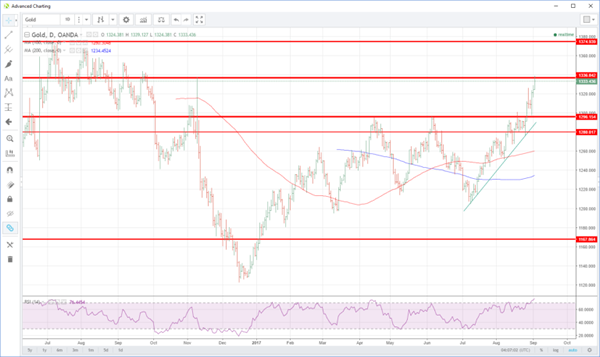
Gold gapped higher this morning as North Korea's hydrogen bomb test yesterday, and heightened rhetoric from the U.S. saw traders rushing for safe havens. Having closed in New York at 1324.00, gold has rushed to a high of 1339.00 before subsiding to a still impressive 1334.00 in early trading. Friday's price action was constructive anyway following a less than impressive Non-Farm Payrolls figure and a weaker dollar following the number. The only story in town this week though will be the ramping up in tensions on the Korean Peninsula with North Korea's possible achievement of thermonuclear capability and aggressive rhetoric from the U.S. both a worrying escalation that comes in a very Central Bank rate announcement week.
GOLD
Gold's technical picture is impressive having retraced and held its 1296.00 breakout level. This is now strong support and a key longer term pivot level. Gold flirts with its next key resistance at 1337.00 having peeked above it this morning. A close above is significant technically, opening up further gains to the 1375.00 highs last seen in July 2016.
We would caution though that the daily RSI is now in a solid overbought territory. This implies that although the technical picture remains strong, some consolidation may now be necessary for further meaningful gains to be made.
SILVER
Silver closed just below its key resistance at 17.7600 on Friday and North Korea has ensured it has burst through that level this morning, touching 17.9000 in early trading.
Like Gold, the technical picture remains constructive as we trade at 17.8325 mid-Asia session. The charts are now clear of resistance until the April high around 18.6570, with support at 17.3900 and comfortably above its 100 and 200-day averages and trend line support on the chart below.
That said, Silver's RSI is also approaching very overbought territory, implying that some consolidation may be required around these levels to catch its breath again.
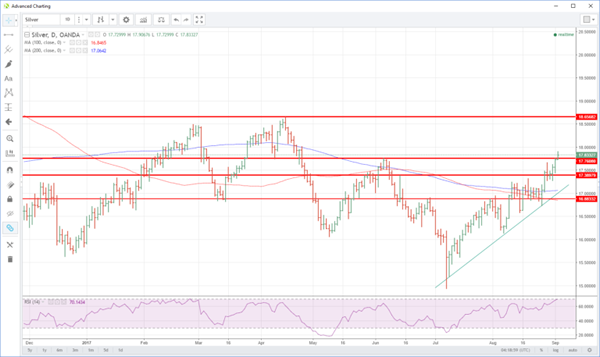
Geopolitical headlines will override technicals potentially and traders should be aware that Gold and Silver may move suddenly and unpredictably on them as the week progresses.
Geopolitical Tension Is Set To Dominate Market Sentiment And Trading Today
North Korea conducted its sixth nuclear test which registered as a magnitude 6.3 earthquake on Sunday, which it said was of an advanced hydrogen bomb for a long-range missile, prompting the threat of a “massive” military response from the United States if it or its allies were threatened.
South Korea's military said on Monday its air forces and the army carried out a missile drill early in the day in response to North Korea's nuclear test, adding the drills targeted the area where the test had been carried out.
President Trump responded via twitter: ‘the US is considering … stopping all trade with any country doing business with North Korea', pressuring countries including China and India to reduce trade with the ‘rogue nation', as he described it.
Yen Edges Higher. The Japanese yen strengthened nearly 0.5% against the greenback and other currencies as North Korea's latest and most powerful nuclear test provoked the usual knee-jerk shift to safe havens.
Gold Hits 10-Month High. Gold prices hit their highest in nearly 10 months early on Monday after North Korea's nuclear test drove investors out of risky assets. Spot gold reached its strongest since Nov. 9 at $1,336.79 per ounce.
Weekly Technical Outlook And Review: EUR/USD, GBP/USD, AUD/USD, USD/JPY, USD/CAD, USD/CHF, DOW 30, GOLD
A note on lower timeframe confirming price action...
Waiting for lower timeframe confirmation is our main tool to confirm strength within higher timeframe zones, and has really been the key to our trading success. It takes a little time to understand the subtle nuances, however, as each trade is never the same, but once you master the rhythm so to speak, you will be saved from countless unnecessary losing trades. The following is a list of what we look for:
- A break/retest of supply or demand dependent on which way you're trading.
- A trendline break/retest.
- Buying/selling tails ... essentially we look for a cluster of very obvious spikes off of lower timeframe support and resistance levels within the higher timeframe zone.
- Candlestick patterns. We tend to only stick with pin bars and engulfing bars as these have proven to be the most effective.
We typically search for lower-timeframe confirmation between the M15 and H1 timeframes, since most of our higher-timeframe areas begin with the H4. Stops are usually placed 1-3 pips beyond confirming structures.
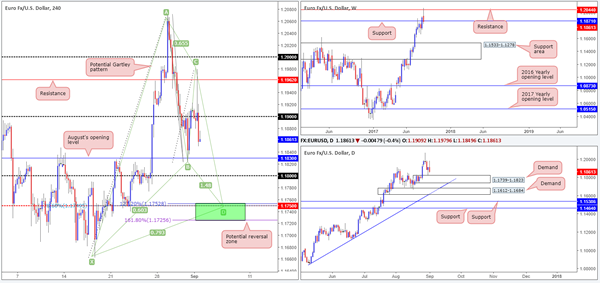
EUR/USD
Weekly gain/loss: – 58 pips
Weekly closing price: 1.1861
After seeing the EUR/USD shake hands with the weekly resistance level at 1.2044, a strong succession of sell orders reigned over this market last week. As a result of this, the week ended with price marginally closing beyond weekly support pegged at 1.1871. Inversely, we also saw the USDX weekly support at 11854 hold firm and print a weekly indecision candle going into the close. Although a close has been seen below support on the EUR, it may be worth waiting for the piece to print a somewhat deeper move beyond this line before presuming that all bids are consumed here.
Down on the daily timeframe, we can see that demand at 1.1739-1.1823 came into play on Thursday (USDX daily supply also came into view on Thursday at 11969-11938). A violation of this area could send the unit down to a demand positioned at 1.1612-1.1684, which happens to fuse nicely with a trendline support fixed from the low 1.0839.
On Friday, the H4 candles moved aggressively higher in the immediate aftermath of a soft US job’s report. However, despite this, the pair was unable to sustain gains beyond resistance at 1.1962, and ended the day closing back below the 1.19 handle.
Suggestions: Apart from breaching the 1.19 handle, H4 price also opened up the trapdoor for the major to challenge August’s opening level seen nearby at 1.1830, followed closely by the 1.18 boundary. Technically speaking though, our desk has absolutely no interest in these levels, as lurking just below is a H4 Harmonic Gartley reversal zone (PRZ) marked in green at 1.1725/1.1752. Not only does this area boast a H4 mid-level support at 1.1750 and a 161.8% H4 Fib ext. point at 1.1725 (taken from the high1.2070), it is also located around the lower limits of the daily demand mentioned above at 1.1739-1.1823.
As far as we see things, there are two options here:
Place a pending order at 1.1750 and position the stop below the X point of the Harmonic formation at 1.1660.
Wait for H4 price to connect with the PRZ and let the H4 candles prove buyer intent. Personally, we look for at least a full, or near-full-bodied bullish to materialize before pulling the trigger. Should this come to fruition, stops can either be placed beyond the candle’s tail (aggressive), or a few pips outside of the PRZ.
Data points to consider: No high-impacting news events on the docket today (US banks are closed in observance of Labor Day).
Levels to watch/live orders:
- Buys: 1.1725/1.1752 ([waiting for a reasonably sized H4 bullish candle to form – preferably a full, or near-full-bodied candle – is advised] stop loss: ideally beyond the candle’s tail).
- Sells: Flat (stop loss: N/A).
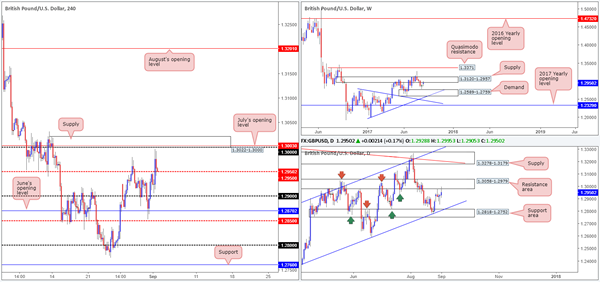
GBP/USD:
Weekly gain/loss: + 74 pips
Weekly closing price: 1.2950
From the weekly timeframe, we can see that the British pound retained a minor bid tone last week despite trading around the underside of a supply base coming in at 1.3120-1.2957. Should the USDX weekly support at 11854 continue to bid prices higher this week, this could bolster weekly sellers from the current supply zone, and eventually send the unit back down to demand penciled in at 1.2589-1.2759.
In conjunction with the weekly timeframe, daily price recently connected with a resistance area at 1.3058-1.2979 which has, so far, done a superb job in holding back the bulls. Given its strong history dating back to mid-May, we feel this zone will continue to hold and ultimately push cable down to the support area seen below at 1.2818-1.2752 that converges with a channel support line taken from the low 1.2365.
Friday’s lower-than-expected US job’s print helped lift H4 price above the mid-level resistance barrier at 1.2950. As can be seen from the chart, the piece missed the large psychological boundary 1.30 by a hair, before mildly trimming gains into the closing bell.
Despite price not connecting with 1.30 on Friday, this number is still of interest. Not only because it is a large psychological level that the majority of the market is likely watching and is positioned within both of the said higher-timeframe resistances, but also due to it converging with a H4 supply at 1.3022-1.3000 and July’s opening level at 1.3003.
Suggestions: Watch for H4 price to challenge the noted H4 supply. In the event that the market prints a reasonably sized full, or near-full-bodied H4 bearish candle from this region, a sell from here is valid, in our opinion, with a target objective set at 1.2950 as an initial take-profit level.
Data points to consider: UK construction PMI at 9.30am GMT+1. US banks are closed in observance of Labor Day.
Levels to watch/live orders:
- Buys: Flat (stop loss: N/A).
- Sells: 1.3022-1.3000 ([waiting for a reasonably sized H4 bearish candle to form – preferably a full, or near-full-bodied candle – is advised] stop loss: ideally beyond the candle’s wick).
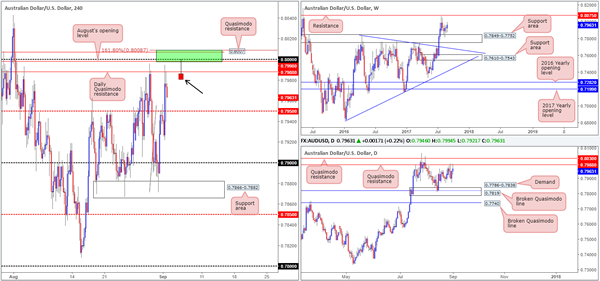
AUD/USD:
Weekly gain/loss: + 35 pips
Weekly closing price: 0.7963
Since weekly price linked with the support area at 0.7849-0.7752 three weeks ago, the commodity currency has remained reasonably well-bid. The next objective, assuming that price continues to push north, can be seen around resistance drawn from 0.8075. Before weekly action can reach the noted resistance, however, it may be worth noting that daily price must first consume both Quasimodo resistances seen at 0.7980/0.8030.
A disappointing US job’s report on Friday saw H4 candle action run through the mid-level resistance at 0.7950 and touch gloves with the daily Quasimodo resistance mentioned above at 0.7980. Although this daily line could potentially drag the pair lower today, we really like the look of the large psychological level planted just above it at 0.80, due to the following nearby converging structures:
August’s opening level at 0.7998.
A H4 Quasimodo resistance level at 0.8007.
A H4 161.8% Fib ext. point at 0.8008.
Suggestions: A short from the green H4 sell zone is, in our technical opinion, appealing, given its confluence. To trade this area though, we would ideally want to see H4 price whipsaw through the current daily Quasimodo resistance and test the zone in the shape of a pin bar, and ultimately close on/near its low (as drawn on the H4 chart). The reason we require this candle confirmation is due to both the risk of a fakeout being seen up to the daily Quasimodo resistance at 0.8030, and weekly price currently showing room to extend up to weekly resistance at 0.8075.
Data points to consider: No high-impacting news events on the docket today (US banks are closed in observance of Labor Day).
Levels to watch/live orders:
- Buys: Flat (stop loss: N/A).
- Sells: 0.8008/0.7998 ([ideally we want to see price whipsaw through the current daily Quasimodo resistance and test the zone in the shape of a H4 pin bar] stop loss: either beyond the candle’s wick or above 0.8008).
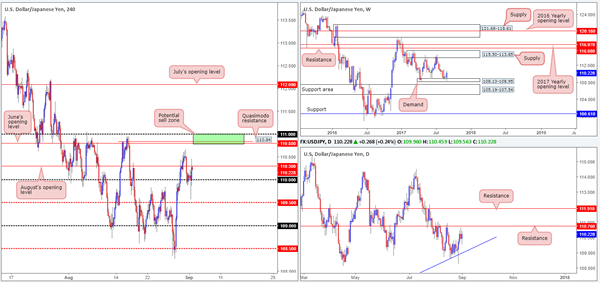
USD/JPY:
Weekly gain/loss: + 90 pips
Weekly closing price: 110.22
During the course of last week’s trading, USD/JPY bulls went on the offensive from weekly demand at 108.13-108.95 and printed a strong-looking weekly bullish engulfing candle. The move from this area could encourage further buying this week and propel the unit up to within striking distance of a supply area formed at 115.50-113.85.
Last week’s upside move, nevertheless, has placed the daily candles within shouting distance of a resistance level pegged at 110.76. Capping upside twice during the month of August, and boasting reasonably strong history, we feel price will, at the very least, bounce lower from here. Should a push above the line be seen, however, this would likely expose another resistance marked at 111.91.
A quick recap of Friday’s session on the H4 timeframe shows price spiked through the 110 handle following lower-than-expected US job’s figures, reaching a low of 109.56, before rejoining the 110 level. Following this, the pair received a minor boost on robust US manufacturing PMI data, consequently bringing price up to August’s opening level at 110.30 into the close.
Suggestions: At current price, we see very little to hang our hat on as far as technical setups go. A little higher up on the curve, nevertheless, June’s opening level at 110.80 shows promise owing to it converging closely with a H4 Quasimodo resistance level at 110.84, the 111 handle and the daily resistance noted above at 110.76 (green area – 111/110.80).
Unfortunately, trading short from this area would entail selling into potential weekly buyers from demand mentioned above at 108.13-108.95. With that being the case, additional confirmation in the form of a reasonably sized H4 bearish candle (preferably a full, or near-full-bodied bearish candle) would be required to show seller interest, before pulling the trigger.
Data points to consider: No high-impacting news events on the docket today (US banks are closed in observance of Labor Day).
Levels to watch/live orders:
- Buys: Flat (stop loss: N/A).
- Sells: 111/110.80 ([waiting for a reasonably sized H4 bearish candle to form – preferably a full, or near-full-bodied candle – is advised] stop loss: ideally beyond the candle’s wick).
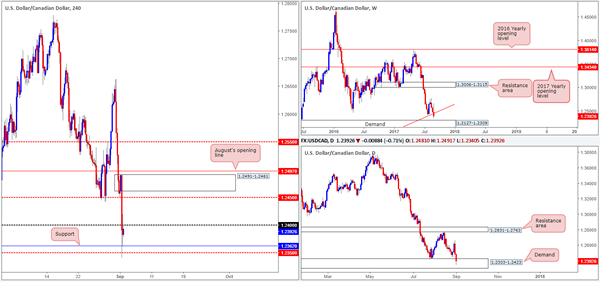
USD/CAD:
Weekly gain/loss: – 88 pips
Weekly closing price: 1.2392
The USD/CAD managed to retain its offered tone last week, after weekly price hammered its way through a long-term weekly trendline support extended from the low 0.9633. Technically speaking, this has likely set the stage for further selling this week at least until we reach weekly demand penciled in at 1.2127-1.2309.
The story on the daily timeframe reveals that the bears did not make a stand until Thursday’s segment, after topping around the 1.2662 neighborhood. The drop from here, shaped by two reasonably decisive bearish candles, brought the unit into the jaws of a demand base drawn from as far back as June 2015 at 1.2303-1.2423.
The result of Friday’s disappointing US job’s report saw price aggressively extend below both the H4 mid-level support at 1.2450 and1.24 handle. It was only once the piece connected with H4 support at 1.2362/H4 mid-level support at 1.2350 did we see price begin mildly paring losses.
Suggestions: To our way of seeing things right now, a H4 close above 1.24 would confirm upside to 1.2450/H4 supply at 1.2491-1.2461. In addition, this move would likely confirm strength from the current daily demand area. On the flip side, a rejection at 1.24 could lead to price retesting 1.2350, and quite possibly the 1.23 boundary (1.23 [not seen on the screen] is positioned just beneath daily demand, and also denotes the top edge of the weekly demand).
Preferably, we would love to be sellers in this market given the pair’s underlying trend. However, selling into daily demand and H4 support is just too risky for our liking. In regard to longs, we would not feel comfortable buying this market above 1.24 due to weekly price showing room to drive lower. To that end, the only place of interest is the 1.23 handle due to its location on the higher timeframes. For us, we would look to place stops below the H4 low @ 1.2276 formed on the 24th June 2015, and target 1.2350 as an initial take-profit level.
Data points to consider: No high-impacting news events on the docket today (US and Canadian banks are closed in observance of Labor Day).
Levels to watch/live orders:
- Buys: 1.23 region (stop loss: 1.2274).
- Sells: Flat (stop loss: N/A).
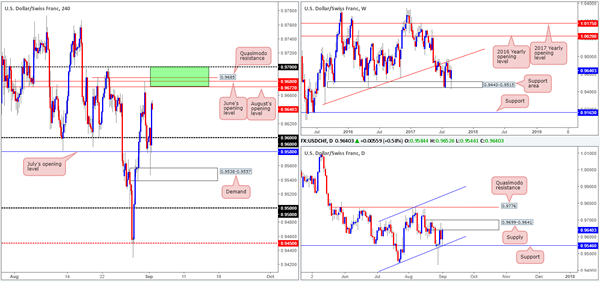
USD/CHF:
Weekly gain/loss: + 81 pips
Weekly closing price: 0.9640
Weekly price turned higher last week after crossing swords with a support area at 0.9443-0.9515, consequently clawing back the majority of the prior week’s losses. Seeing as the USDX also bounced from weekly support at 11854, dollar buying on the Swissy could lead to price retesting the trendline resistance extended from the low 0.9257.
Daily price on the other hand is somewhat restricted at the moment. To the upside, we have supply lodged at 0.9699-0.9641 (daily supply also seen on the USDX at 11969-11938) that held price lower on Thursday. And to the downside, there’s nearby support marked at 0.9546, which converges nicely with a channel support line etched from the low 0.9438.
The impact of Friday’s less-than-stellar US job’s report sent H4 price storming through July’s opening level at 0.9580 to a demand printed at 0.9538-0.9557. Despite the dismal numbers, the pair easily clawed back immediate losses and rose above the 0.96 handle to a high of 0.9652 on the day.
Suggestions: As of current price, we are particularly fond of the green area marked on the H4 chart at 0.97/0.9672. Comprised of June/August’s opening levels at 0.9680/0.9672, a H4 Quasimodo resistance level at 0.9685, a psychological boundary at 0.97 and being positioned within the upper limits of the current daily supply, a bounce lower from here is likely on the cards. The only grumble we have, however, is knowing that weekly price can potentially stretch as far north as the aforementioned trendline resistance! For that reason, we would only recommend executing a sell position between 0.97/0.9672 if H4 candle confirmation is present (preferably in the shape of a full, or near-full-bodied bearish candle).
Data points to consider: No high-impacting news events on the docket today (US banks are closed in observance of Labor Day).
Levels to watch/live orders:
- Buys: Flat (stop loss: N/A).
- Sells: 0.97/0.9672 ([waiting for a reasonably sized H4 bearish candle to form – preferably a full, or near-full-bodied candle – is advised] stop loss: ideally beyond the candle’s wick).
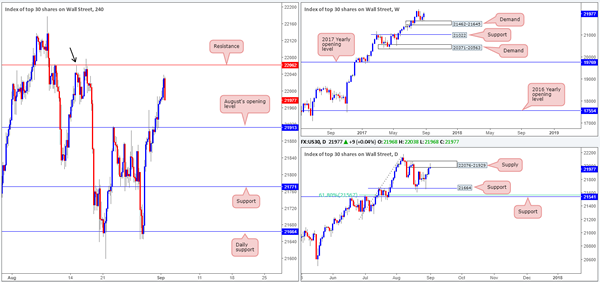
DOW 30:
Weekly gain/loss: + 159 points
Weekly closing price: 21977
Recent dealings show US equities extended its bounce from weekly demand at 21462-21645 last week, finishing near its highs. With little overhead resistance to contend with on the weekly timeframe, a fresh record high could be achieved this week!
On the other side of the field, nevertheless, daily flow recently crossed paths with supply at 22076-21929, and chalked up a nice-looking selling wick into the week’s end. While this supply boasts strong momentum and could send the index lower this week, let’s not forget where weekly price is trading from!
After retesting August’s opening level at 21913 as support on Thursday, the H4 candles extended north on Friday, and managed to clock a high of 22038 before trimming gains into the closing bell. Sited within the upper limits of the aforesaid daily supply, the next area to the upside is a H4 resistance level at 22062 (also denotes a Quasimodo resistance left shoulder marked by the black arrow).
Our suggestions: A difference of opinion is currently being seen on the higher timeframes. On the one hand, the weekly chart shows price is ready for higher levels, and on the other hand, daily movement is capped by a supply. This leaves traders in a somewhat precarious position on the H4 timeframe. A long at 21913 is high-probability according to the weekly scale, but ill-advised from a daily perspective. In a similar fashion, going short from the H4 resistance at 22062 would have you selling into potential weekly buyers, but alongside possible daily flow!
Given the above factors, our team will remain on the sidelines for the time being.
Data points to consider: No high-impacting news events on the docket today (US banks are closed in observance of Labor Day).
Levels to watch/live orders:
- Buys: Flat (stop loss: N/A).
- Sells: Flat (stop loss: N/A).
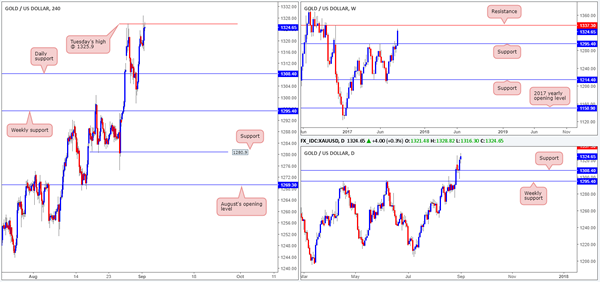
GOLD:
Weekly gain/loss: + $33.4
Weekly closing price: 1324.6
In recent trading, the yellow metal stormed above weekly resistance at 1295.4 and concluded trade closing just ahead of weekly resistance at 1337.3 that stretches all the way back to late 2010!
A quick recap of Friday’s movement on the H4 timeframe shows price challenged Tuesday’s high at 1325.9, but failed to muster enough strength to close beyond the number. As we highlighted in Friday’s report, this is, we believe, the last major obstacle stopping price from gravitating north up to the said weekly resistance.
Our suggestions: A H4 close above Tuesday’s high, followed up with a retest and a H4 bullish candle in the shape of either a full, or near-full-bodied bullish candle would, in our view, be enough to validate a long, targeting the weekly resistance mentioned above at 1337.3.
Levels to watch/live orders:
- Buys: Watch for H4 price to engulf 1325.9 and then look to trade any retest seen thereafter ([waiting for a reasonably sized H4 bull candle to form following the retest is advised] stop loss: ideally beyond the candle’s tail).
- Sells: Flat (stop loss: N/A).
Oil Recovers As U.S. Refining Takes Of It’s Waterwings
U.S. refining makes a rapid comeback in a supportive development for WTI in particular.
Oil traded positively on Friday with WTI, in particular, the star, pulling itself up off the floor as U.S. refining production restarts in earnest following the passing of Hurricane Harvey. With the storm having passed, it appears that damage to refining capacity is minimal and with only 5.50% now offline from fully 25% a week ago, traders are hopeful that crude backlogs will be cleared, taking the pressure of both WTI and gasoline futures. The Brent/WTI spread has also closed from a six dollar premium to an only four dollars this morning.
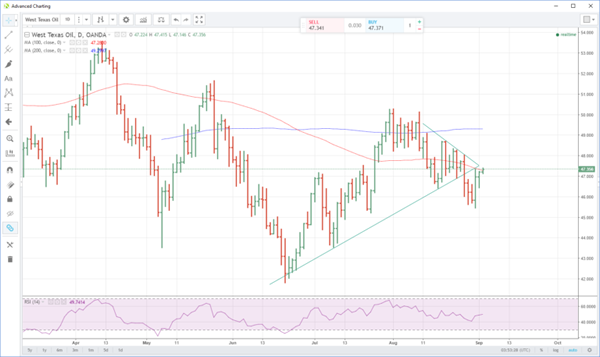
WTI
WTI spot trades unchanged in Asia at 47.50 having regained its 100-day moving average at 47.30 in a positive technical development. Support is at 46.50 with resistance at 48.70.
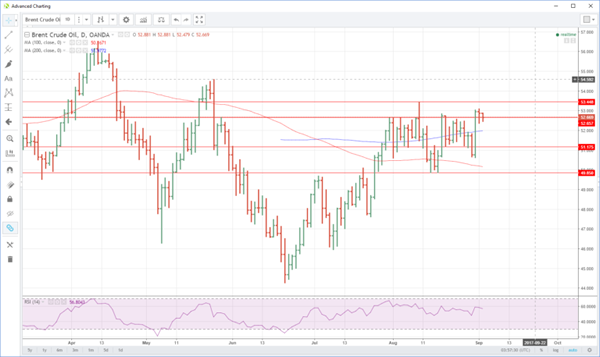
BRENT
Brent spot continues to trade constructively to start the week, opening at its previous longer term resistance at 52.70. It now appears poised to attack resistance at 53.50 which could begin a move to the 55.00 area. Support appears at 52.40 initially.
Both contracts will be vulnerable to North Korean headlines this week, with any signs of escalation from this weekend's events potentially giving the oil a significant tailwind.
GBP/JPY Daily Outlook
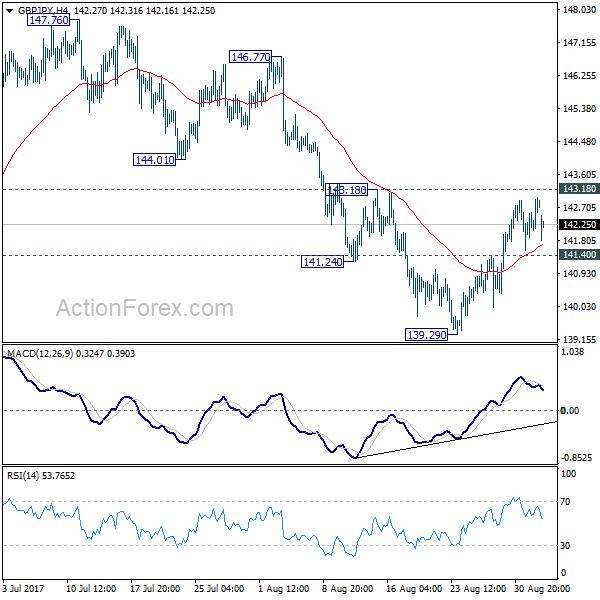
Daily Pivots: (S1) 142.16; (P) 142.57; (R1) 143.20; More
GBP/JPY gaps lower today but stays in range of 141.40/143.18. Intraday bias remains neutral first. Deeper decline is mildly in favor as long as 143.18 resistance holds. Below 141.40 minor support will turn bias back to the downside first. Break of 139.29 will target 135.58 key support level. At this point, price actions from 148.42 are seen as a sideway consolidation pattern. Hence, we'll expect strong support from 135.58 to contain downside and bring rebound. Meanwhile, break of 143.18 will indicate short term reversal and turn bias back to the upside.
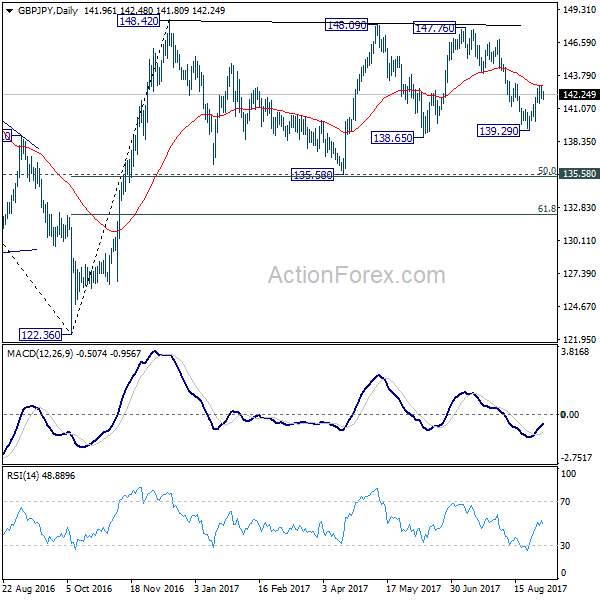
In the bigger picture, the sideway pattern from 148.42 is still unfolding. In case of deeper fall, we'd expect strong support from 135.58 and 50% retracement of 122.36 to 148.42 at 135.39 to contain downside. Medium term rise from 122.36 is expected to resume later. And break of 38.2% retracement of 196.85 to 122.36 at 150.43 will carry long term bullish implications. However, firm break of 135.58/39 will dampen the bullish view and turn focus back to 122.36 low.
Japanese Yen and Swiss Franc Gap Up as North Korea Significantly Scaled Up Military Threat
Yen and Swiss Franc gap up as the week starts while Dollar and Aussie trade broadly lower. Nikkei tumbles in early trading and is down -170 pts at the time of writing. Gold resumes recent rally and surges to as high as 1343.5. Korea tension resurfaces as North Korea conducted a sixth nuclear test on Sunday. It's believed that this one, an advanced hydrogen bomb or a long-range missile, is of a significantly larger scale and more powerful, as an Pyongyang described the underground explosion in a televised statement that it's a "perfect success in the test of a hydrogen bomb for an ICBM". And, "the creditability of the operation of the nuclear warhead is fully guaranteed." It's even claimed that the detonation of the bomb triggered an initial magnitude 6.3 earthquake in the northern part of North Korea. The United Nations Security Council was set to meet later on today to discuss fresh sanctions against the country.
US Defense Secretary James Mattis had a meeting with President Donald Trump, Vice President Mike Pence and other top national security advisers. Mattis briefed Trump on each of the "many military options" and warned of a "massive military response, a response both effective and overwhelming" to any threat from North Korea. Trump condemned that the "words and actions" of North Korea "continue to be very hostile and dangerous" to the US.
US Trump: South Korea appeasement will not work
Trump also named other countries in his tweets regarding the issue. He said that Pyongyang "has become a great threat and embarrassment to China, which is trying to help but with little success." Trump also warned that the US is " is considering, in addition to other options, stopping all trade with any country doing business with North Korea." That clearly refers to China, which continue to be a key economic partner of North Korea despite supporting the economic sanctions. Besides, Trump also said that "South Korea is finding, as I have told them, that their talk of appeasement with North Korea will not work, they only understand one thing!" Trump also hinted at withdrawing from the US-Korea Free Agreement agreements earlier.
South Korea: Destruction of war should not be repeated in this land
Taking about South Korea, President Moon Jae-in's office issued a statement emphasizing that "South Korea is a country that experienced a fratricidal war. The destruction of war should not be repeated in this land". And Moon pledged that "we will not give up and will continue to push for the denuclearization of the Korean Peninsula through peaceful means working together with our allies." The country said today that it's preparing fresh military drills with US in response to situation. And it's reported that President Moon, initially opposed the so called Thaad (terminal high-altitude area defense) system, appears to have soften his stance. And South Korea is poised to approve further deployment of the US Thaad system.
Japan Abe talked twice with Trump during the weekend
Japan's prime minister Shinzo Abe held two phone calls with Trump discussing the situation. Abe told reporters after the call that "President Trump and I shared the view that we cannot overlook North Korea's reckless act and that the international community must show its resolve by applying stronger pressure than had so far been used". Separately, Abe seemed to have agreed with "Russian President Vladimir Putin to cooperate on North Korean as both agreed that "North Korea's reckless act is a serious threat"
Elsewhere
Japan monetary base rose 16.3% yoy in August. Australia TD securities inflation rose 0.1% mom in August. Australia company operate profits dropped -4.5% qoq in Q2. Eurozone will release Sentix investor confidence and PPI in European session. UK will release construction PMI. US and Canada will be on holiday today.
Three central banks to meet this week: RBA, BoC, ECB
Looking ahead, we have a busy week ahead. Besides the BOC meeting scheduled on Wednesday, we have the RBA meeting on Tuesday and the ECB meeting on Thursday. The strong GDP data from Canada lifted the chance of a rate hike by BoC this week to 50%, according to overnight index swaps market pricing. However, considering that BoC has just raised interest rate by 25bps to 0.75% back in July, September seems to be too early for another move. Nevertheless, Canadian Dollar would likely stay firm at the initial part of the week. And buying will jump in again if BoC signals in the statement that it's ready to move again in October.
There have been rumors that the ECB would delay its QE tapering due to the recent rally in the single currency. Indeed, the late selloff in Euro last week was due to report that ECB would not act until December. However, we believe euro's strength of late has more been due to the unattractiveness of other currencies, especially the greenback and sterling. We expect the ECB to warn of euro's strength but maintain the rhetoric that it stands ready to extend/expand asset purchases, if needed. The central bank might begin formal discussion in October.
Throughout the week, we would be receiving a number of speeches from Fed presidents, beginning with Governor Brainard, Minneapolis' Kashkari (voter) and Dallas' Kaplan (voter) all speaking on Tuesday, followed by Cleveland's Mester (nonvoter), New York Fed President Dudley and Kansas City's George (nonvoter) on Thursday and Philadelphia Fed President Harker (nonvoter) on Friday.
Here are some highlights for the week ahead:
- Tuesday: RBA rate decision; Swiss GDP, CPI; Eurozone PMI services revision, retail sales; UK PMI services; US factory orders
- Wednesday: Australia GDP; German factory orders; Eurozone PMI retail; Canada trade balance, labor productivity, BoC rate decision; US trade balance, ISM services, Fed Beige Book report
- Thursday: Australia retail sales, trade balance; Japan leading index; Swiss foreign currency reserves; German industrial production; ECB rate decision; Canada building permits, Ivey PMI; US jobless claims
- Friday: New Zealand manufacturing activity; Japan GDP; China trade balance; Australia home loans; Swiss unemployment; German trade balance; UK productions, trade balance; Canada employment
GBP/JPY Daily Outlook
Daily Pivots: (S1) 142.16; (P) 142.57; (R1) 143.20; More
GBP/JPY gaps lower today but stays in range of 141.40/143.18. Intraday bias remains neutral first. Deeper decline is mildly in favor as long as 143.18 resistance holds. Below 141.40 minor support will turn bias back to the downside first. Break of 139.29 will target 135.58 key support level. At this point, price actions from 148.42 are seen as a sideway consolidation pattern. Hence, we'll expect strong support from 135.58 to contain downside and bring rebound. Meanwhile, break of 143.18 will indicate short term reversal and turn bias back to the upside.
In the bigger picture, the sideway pattern from 148.42 is still unfolding. In case of deeper fall, we'd expect strong support from 135.58 and 50% retracement of 122.36 to 148.42 at 135.39 to contain downside. Medium term rise from 122.36 is expected to resume later. And break of 38.2% retracement of 196.85 to 122.36 at 150.43 will carry long term bullish implications. However, firm break of 135.58/39 will dampen the bullish view and turn focus back to 122.36 low.
Economic Indicators Update
| GMT | Ccy | Events | Actual | Forecast | Previous | Revised |
|---|---|---|---|---|---|---|
| 23:50 | JPY | Monetary Base Y/Y Aug | 16.30% | 15.60% | 15.60% | |
| 01:00 | AUD | TD Securities Inflation M/M Aug | 0.10% | 0.10% | ||
| 01:30 | AUD | Company Operating Profit Q/Q Q2 | -4.50% | -4.00% | 6.00% | |
| 08:30 | EUR | Eurozone Sentix Investor Confidence Sep | 27 | 27.7 | ||
| 08:30 | GBP | Construction PMI Aug | 52 | 51.9 | ||
| 09:00 | EUR | Eurozone PPI M/M Jul | 0.10% | -0.10% | ||
| 09:00 | EUR | Eurozone PPI Y/Y Jul | 2.10% | 2.50% |