
Sample Category Title
US Dollar Closes With Modest Gains
The US dollar closed out on Friday with some modest gains. The nonfarm payrolls data was broadly mixed. According to the data from the Bureau of Labor Statistics, the US economy added 156k jobs in August. This was below consensus estimates of 180k. July's numbers were also revised down to 189k from 209k previously.
Average hourly earnings were also weak, rising just 0.1% on the month after rising 0.3% in July. The unemployment rate inched higher to 4.4%.
The rather weak payrolls report was offset by the ISM manufacturing PMI data. For August, manufacturing PMI rose to 58.8, beating estimates by a strong margin and accelerating from 56.3 in July.
Looking ahead, the economic calendar today will include the Eurozone Sentix investor confidence. Median estimates point to a reading of 27.4, slightly below 27.7 that was registered previously. The UK's construction PMI numbers will also be coming out later in the day with forecasts showing a modest increase from 51.9 in July to 52.1 in August.
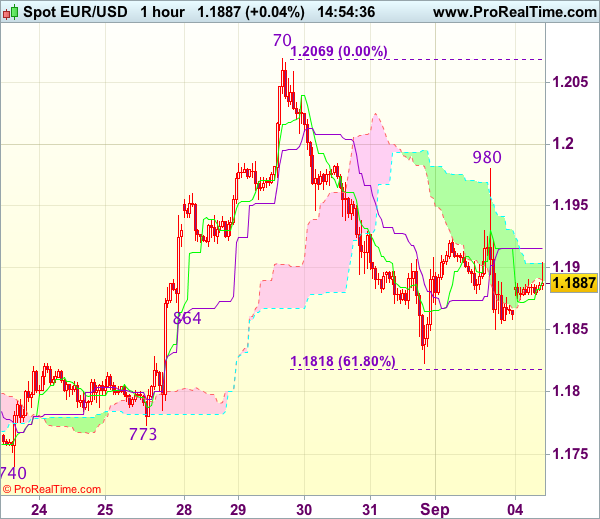
Trade Idea : EUR/USD – Sell at 1.1955
EUR/USD - 1.1891
Most recent candlesticks pattern : N/A
Trend : Up
Tenkan-Sen level : 1.1891
Kijun-Sen level : 1.1915
Ichimoku cloud top : 1.1904
Ichimoku cloud bottom : 1.1888
New strategy :
Sell at 1.1955, Target: 1.1855, Stop: 1.1990
Position : -
Target : -
Stop : -
Although the single currency staged a brief bounce to 1.1980 on Friday, the subsequent anticipated retreat suggests the rebound from 1.1823 has ended there and consolidation with downside bias is seen for another fall to this level, break there would add credence to our view that top has been formed at 1.2070 earlier and extend the fall from there to 1.1815-18 (61.8% Fibonacci retracement of 1.1662-1.2070), then 1.1790-00 but downside should be limited and previous support at 1.1773 should remain intact.
In view of this, we are looking to sell euro again on recovery as 1.1950-55 should limit upside. Only break of said resistance at 1.1980 would abort and signal the fall from 1.2070 has ended at 1.1823 yesterday, bring further gain to 1.2000 and possibly towards 1.2025-30.
Currencies: Risk-Off Sentiment To Block USD Rebound
Sunrise Market Commentary
- Rates: Risk aversion after North Korean nuclear test
Risk aversion dominates Asian trading this morning (positive for core bonds) after Pyongyang's latest nuclear test which triggered an aggressive verbal response by the US. Such geopolitical events had a rather short timestamp on markets of late, but the absence of US traders (Labour Day Holiday) and eco data suggests that it will be today's only trading theme. - Currencies: Risk-off sentiment to block USD rebound.
On Friday, the dollar easily dismissed a mediocre US payrolls report, suggesting that the recent USD decline was exhausted. During the weekend, geopolitical tensions returned to the forefront. Of late, a global safe haven bid didn't help the dollar much. So, a further USD comeback might not be that easy.
The Sunrise Headlines
- US equities closed modestly higher as weak payrolls were fast digested. Asian equities started the week on a weak footing after North Korea tested a powerful nuclear bomb. The yen strengthened, but already lost part of the gains. Gold is moderately higher, but off the lows.
- North Korea said it successfully tested a hydrogen bomb with “unprecedentedly big power” that can be loaded onto an intercontinental missile, in its first nuclear test under US Trump's presidency.
- US defence secretary Mattis, who was a rather dovish voice inside the administration recently, said the US will answer any threat from the North with a “massive military response”.
- US Congressmen return from summer recess Tuesday with the eyes of bond traders squarely upon them. Among their pressing tasks: increase America's borrowing authority and prevent an unprecedented default before Sep 29.
- Moody's raised the outlook on Portugal's Ba1 bond rating to positive from stable as growth continues to show resilience and the debt structure improves. S&P confirmed Sweden's AAA rating stable outlook and Fitch Germany's AAA.
- Russia is likely to back a further extension of the OPEC agreement cutting oil output, the country's deputy prime minister said. Crude traded volatile, but sideways on Friday and is slightly lower overnight.
- The eco calendar is uneventful and US markets are closed for Labour Day today. Later this week focus is on ECB meeting (Thursday), US Congress (debt ceiling, government shutdown) and US Non-manufacturing ISM (Wednesday)
Currencies: Risk-Off Sentiment To Block USD Rebound
Dollar cautiously softer as sentiment turns risk-off
On Friday, the US payrolls disappointed. The dollar instantaneously lost ground, but losses were rapidly erased. EUR/USD spiked from about 1.1920 to 1.1980, but soon turned back south. The dollar received additional support for a strong US manufacturing ISM. Similarly, USD/JPY dropped temporary to the mid 109 area, only to return north of 110. Investor doubts on the statistical accuracy of the August Payrolls might have played a role in the modest USD reaction to the report. The USD price action suggest that the recent setback of the USD is exhausted. EUR/USD finished the session at 1.1860 (from 1.1910). USD/JPY ended at 110.25 (from 109.989).
During the weekend, geopolitical risk returned to the forefront as North Korea tested a new nuclear bomb on Sunday. Major regional equity indices are losing about 1%. China outperforms. USD/JPY opened sharply lower in the 109.25 area, but the yen already returned an important part of the earlier gains (currently 109.80 area). The North Korea tensions have little impact on EUR/USD. It holds very tight range near the 1.1880 level.
Today, US markets are closed today and the EMU calendar is uneventful with only the Sentix investor confidence for September and the PPI for July. Later this week, most attention goes to Thursday's ECB meeting, the return of US Congress (Tuesday) and many Fed speeches ahead of the black period. The rumour mill about the ECB meeting is running hot. ECB Nowotny downplayed euro strength, but unnamed ECB sources suggested that euro strength is making the ECB Council nervous. Other sources said that a decision on the APP programme might be delayed to October or even to December. The stronger euro isn't going to help inflation higher, but growth is above trend, which implies that underlying inflation will at some point start rising. This puts the ECB in a difficult position. The US House will have to hurry up with the vote on a continuing spending bill to avert a government shutdown early October and on the debt ceiling. Regarding US data, we expect the Non-manufacturing ISM to be strong as was the manufacturing one.
Sentiment on the dollar improved slightly after the post Jackson-Hole sell-off. However, for now, the US currency didn't regain any technically relevant level against the euro or the yen. So, the jury is still out whether a sustained USD rebound is on the cards. The data might be slightly USD supportive A (moderate) risk-off sentiment didn't help the dollar much of late . Therefore, we start the week with a neutral bias.
If EUR/USD would fall below the 1.18/1.1775 area, it would suggest that more downside short-term. For such a move, the USD needs good data and higher US yields. On the euro side of the story, Draghi has to convince markets that low inflation is enough a reason for the ECB to maintain a loose monetary policy. On the topside, the 1.2070 correction top remains the first reference.
A downward correction in core (US and European) yields supported the yen in August. USD/JPY declined from mid-114 mid-July and came within reach of the key 108.13 range bottom, but the support did its job. We maintain the working hypothesis that this level won't be broken as a lot USD bad news is discounted. A cautious buy-on-dips (with stop-loss protection below 108) may be considered. USD/JPY needs to regain the 110.95 level to suggest an improved upside momentum. Such a break might be difficult if sentiment would turn risk-off.
EUR/USD: dollar 'resists' disappointing payrolls report, but no technical signal of a sustained rebound of the US currency yet
EUR/GBP
EUR/GBP drops below 0.92
Sterling traded sideways in the Friday's morning session, ignoring an unexpectedly strong Manufacturing PMI. The improvement was broad-based suggesting that the weak pound is starting to help the economy. EUR/GBP kept close to the 0.9210 going towards the US payrolls release. Strange enough, cable didn't return gains against the dollar after the weaker payrolls unlike EUR, JPY, …. This resulted in a significant decline of EUR/GBP. The pair closed the session at 0.9159 (from 0.9211). Cable closed the session at 1.2951 (from 1.2930).
Today, only the UK construction PMI will be published. A big deviation from consensus is needed to inspire any GBP reaction. During the weekend, there were diverging comments on the poor progress in the Brexit negotiations. UK Davis dismissed rumours that the UK would consider to pay an exit bill of about £ 50 bln. The lack of process in the Brexit talks is a negative for sterling. However, as is the case for the dollar, the recent sterling decline (especially against the euro) looks exhausted. So, some consolidation ahead of the ECB meeting might be on the cards.
From a technical point of view, EUR/GBP cleared the 0.8854/80 resistance (top end June), opening the way for further gains. The move was the result of euro strength. Simultaneously, UK price data were soft enough to keep the BoE sidelined. MT, we maintain a buy EUR/GBP on dips approach as we expect the combination of relative euro strength and sterling softness to persist. The 0.9415 'flash-crash spike' is the next target on the charts. However, wait for a correction, e.g. to the technical support in the 0.88/89 area, to sell sterling again versus the euro.
EUR/GBP: sterling extends gradual rebound, despite BRexit stalemate
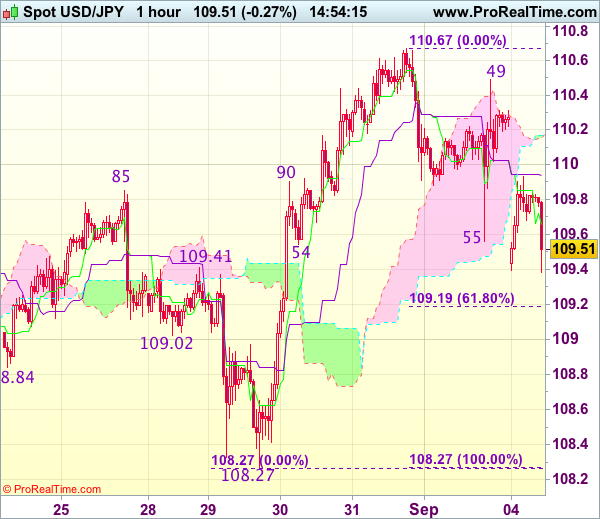
Trade Idea : USD/JPY – Stand aside
USD/JPY - 109.48
Most recent candlesticks pattern : N/A
Trend : Near term up
Tenkan-Sen level : 109.66
Kijun-Sen level : 109.94
Ichimoku cloud top : 110.17
Ichimoku cloud bottom : 110.15
New strategy :
Stand aside
Position : -
Target : -
Stop : -
The greenback opened lower today and has remained under pressure, suggesting top has possibly been formed at 110.67 last week and downside risk remains for weakness to 109.15-20 (61.8% Fibonacci retracement of 108.27-110.67), however, break there is needed to add credence to this view, bring further fall to 108.95-00, however, reckon 108.55-60 would remain intact.
On the upside, expect recovery to be limited to 109.80 and 110.00-05 should hold, bring another retreat. Only a firm break above resistance at 110.49 would revive bullishness and signal the pullback from this week’s high of 110.67 has ended, bring retest of this level, break there would confirm the rise from 108.27 low has resumed and extend gain towards previous chart resistance at 110.95 later.
AUD/USD Daily Outlook
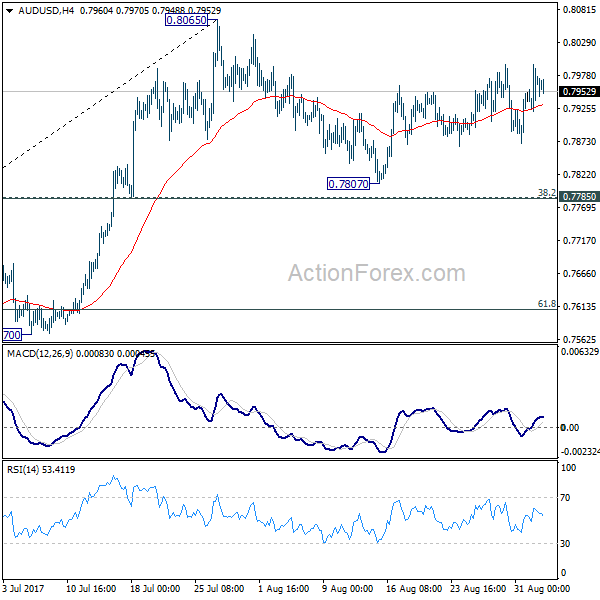
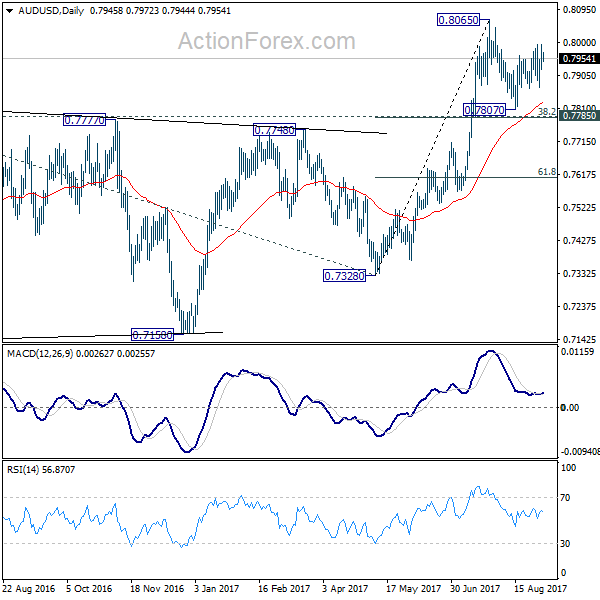
Daily Pivots: (S1) 0.7927; (P) 0.7960; (R1) 0.8000; More...
Intraday bias in AUD/USD remains neutral as consolidation from 0.8065 continues. In case of another fall, downside should be contained by 0.7785 cluster support (38.2% retracement of 0.7328 to 0.8065 at 0.7783) to bring rebound. On the upside, break of 0.8065 will resume the medium term rise and target 100% projection of 0.6826 to 0.7833 from 0.7328 at 0.8335.
In the bigger picture, rise from 0.6826 medium term bottom is still in progress. At this point, there is no confirmation of trend reversal yet and we'll continue to treat such rebound as a corrective pattern. But in any case, break of 55 month EMA (now at 0.8087) will target 38.2% retracement of 1.1079 to 0.6826 at 0.8451. Break of 0.7328 support is needed to confirm completion of the rebound. Otherwise, further rise is now in favor.
In The US, Markets Are Closed Due To Labour Day
Market movers today
In the US, markets are closed due to Labour Day.
In Denmark, we are due to get FX reserves data for August , which we believe is likely to show that Danmarks Nationalbank has not intervened in the FX market .
In the euro area, the Sentix investor confidence is due for release. Tension concerning North Korea is still seeing spill overs to the financial markets, while the recent EUR strength might also have weighed on investor confidence. Weest imate Sentix fell to 26.9 in August .
The most important event this week is the ECB meeting. We do not expect any announcement on QE at this meeting, as the ECB has hinted that it needs more time to discuss it . Instead, the focus is likely to be on how big a problem the current pace of euro appreciation is for the ECB.
Selected market news
The North Korean crisis escalated further over the weekend, as North Korea carried out another nuclear test . The test was the sixth nuclear test and the largest so far. The explosion is seen as a humiliation of the Chinese President Xi Jinping ahead of the BRIC meeting, which took place yesterday. Both China and Russia have called for diplomatic solutions. US President Trump tweeted that one option is to stop ‘all trade with any country doing business with North Korea', i.e. mainly China and Russia. Defense Secretary James Matt is, who has been more moderate than Trump, has said that the US will respond with ‘a massive military response' to any threat from North Korea. It is not an easy problem to resolve for the US and its allies, as diplomacy and economic sanctions seem without effect and a military strikes comes with the risk of a fierce retaliation with significant casualties in South Korea. The capital Seoul, with 10 million people, is less than 50km from the border with North Korea and the latter has a significant arsenal of both conventional and chemical weapons. For more on our view on North Korea see Strategy: Event risk to the fore, 1 September.
The nuclear test has led to a risk-off with most Asian equity indices and US stock index futures are down this morning. Also, gold and yen have rallied while EUR/USD has moved slightly higher to 1.1881.
In the US, Treasury Secretary Steven Mnuchin is considering tying debt limit legislation to Harvey aid to Texas. However, it is not a given that this would make it easier to pass a debt limit increase, as fiscal hawks within the Republican Party are against this. For more see POLITICO.
In the UK, Brexit Secretary David Davis has rejected The Sunday's story that PMT heresa May is willing to accept a divorce bill of EUR50bn after the Conservative Party Conference in early October in order to get the Brexit negotiations going.
According to polls, German Chancellor Merkel won yesterday's TV debate against SPD's candidate Schulz and Merkel is still on track to secure her fourth term in office, see German Election Monitor #1: Next euro area election unlikely to rock the boat , 29 August.
Aussie Dollar Trading A Tad Lower This Morning
For the 24 hours to 23:00 GMT, the AUD rose 0.3% against the USD and closed at 0.7967 on Friday.
LME Copper prices declined 0.2% or $16.0/MT to $6776.0/MT. Aluminium prices remained flat at $2113.5/MT.
In the Asian session, at GMT0300, the pair is trading at 0.7966, with the AUD trading slightly lower against the USD from Friday's close.
The pair is expected to find support at 0.7927, and a fall through could take it to the next support level of 0.7889. The pair is expected to find its first resistance at 0.7999, and a rise through could take it to the next resistance level of 0.8033.
Going ahead, traders will anxiously await the Reserve Bank of Australia's (RBA) interest rate decision, due to be announced tomorrow.
The currency pair is trading above its 20 Hr and 50 Hr moving averages.

USD/CAD Daily Outlook
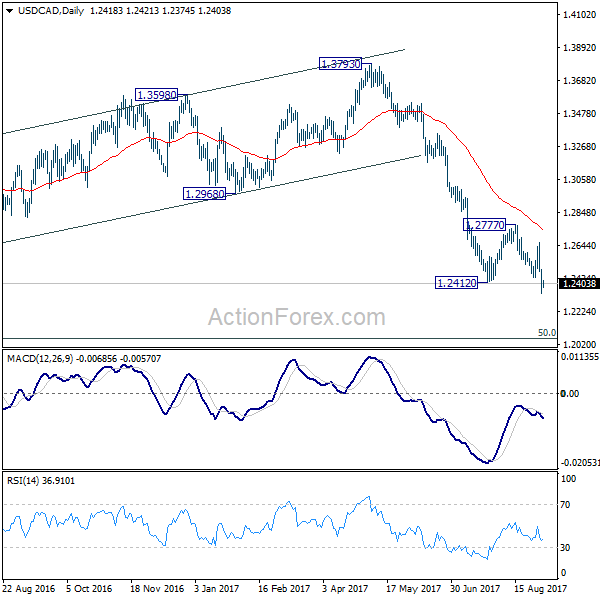
Daily Pivots: (S1) 1.2325; (P) 1.2408; (R1) 1.2477; More....
Intraday bias in USD/CAD remains on the downside for the moment. Current fall from 1.3793 (and 1.4689) would target next long term fibonacci level at 1.2048. On the upside, above 1.2490 minor resistance will turn intraday bias neutral again. But outlook will remain bearish as long as 1.2662 resistance holds.
In the bigger picture, price actions from 1.4689 medium term top are seen as a correction pattern. Such corrective fall is expected to extend to 50% retracement of 0.9406 to 1.4869 at 1.2048. At this point, we'd look for strong support from there to contain downside and bring rebound. Break of 1.2777 resistance will indicate reversal and turn outlook bullish for 1.3793 key resistance. However, sustained break of 1.2048 will carry larger bearish implications and bring deeper decline.

Euro-Zone’s Manufacturing Sector Growth Confirmed At A 2-Month High In August
For the 24 hours to 23:00 GMT, the EUR declined 0.41% against the USD and closed at 1.1864 on Friday.
In economic news, the Euro-zone's final Markit manufacturing PMI climbed to a level of 57.4 in August, confirming the flash print. In the previous month, the PMI had registered a level of 56.6.
Separately, Germany's final Markit manufacturing PMI rose less than initially estimated to a level of 59.3 in August, compared to an advance to a level of 59.4 indicated in the flash estimate. In the preceding month, the PMI had registered a reading of 58.1 in the previous month.
The greenback gained ground against its key peers, as investors shrugged-off disappointing US non-farm payrolls report and cheered robust ISM manufacturing data.
Data indicated that non-farm payrolls in the US rose by 156.0K in August, falling well short of market expectations for an advance of 180.0K. Non-farm payrolls had recorded a revised increase of 189.0K in the prior month. Further, the nation's average hourly earnings of all employees posted a sluggish gain of 0.1% on a monthly basis in August, spurring fresh doubts that whether the Federal Reserve would be able to stick to its timetable for further interest rate rises as wage growth remains anaemic. Average hourly earnings of all employees had registered a rise of 0.3% in the prior month, while market participants had envisaged for a rise of 0.2%. Moreover, the nation's unemployment rate registered an unexpected rise to 4.4% in August, while markets anticipated it to remain steady at 4.3%.
In other economic news, the US ISM manufacturing activity index jumped more-than-expected to a level of 58.8 in August, expanding at its fastest pace in six-years, suggesting that manufacturing sector will remain a key pillar of growth in the world's largest economy. The index had registered a level of 56.3 in the previous month, while markets were anticipating for an advance to a level of 56.5. Meanwhile, the nation's final Reuters/Michigan consumer confidence index recorded a rise to a level of 96.8 in August, while the preliminary figures had indicated a rise to a level of 97.6. The index had registered a level of 93.4 in the previous month. On the other hand, the nation's construction spending unexpectedly fell 0.6% MoM in July, dipping to a nine-month low and defying market consensus for a rise of 0.5%. Construction spending had posted a revised fall of 1.4% in June. Also, the nation's final Markit manufacturing PMI eased less than initially estimated to a level of 52.8 in August, compared to a level of 53.3 in the prior month. The preliminary figures had indicated a drop to a level of 52.5.
In the Asian session, at GMT0300, the pair is trading at 1.1885, with the EUR trading 0.18% higher against the USD from Friday's close.
The pair is expected to find support at 1.183, and a fall through could take it to the next support level of 1.1775. The pair is expected to find its first resistance at 1.196, and a rise through could take it to the next resistance level of 1.2035.
Going forward, the Euro-zone's Sentix investor confidence index for September, scheduled to release in a few hours, will garner significant amount of market attention.
The currency pair is showing convergence with its 20 Hr and 50 Hr moving averages.

UK’s Manufacturing Sector Activity Rose To A 4-Month High In August
For the 24 hours to 23:00 GMT, the GBP declined 0.12% against the USD and closed at 1.2926 on Friday.
On the macro front, the Markit manufacturing PMI unexpectedly climbed to a level of 56.9 in August, notching a four-month high level and defying market consensus for a fall to a level of 55.0. The PMI had recorded a revised level of 55.3 in the prior month.
In the Asian session, at GMT0300, the pair is trading at 1.2955, with the GBP trading 0.22% higher against the USD from Friday's close.
The pair is expected to find support at 1.2919, and a fall through could take it to the next support level of 1.2884. The pair is expected to find its first resistance at 1.2977, and a rise through could take it to the next resistance level of 1.3000.
Moving ahead, market participants will keep a close watch on Britain's Markit construction PMI for August, due to release in a few hours.
The currency pair is trading above its 20 Hr and 50 Hr moving averages.
