
Sample Category Title
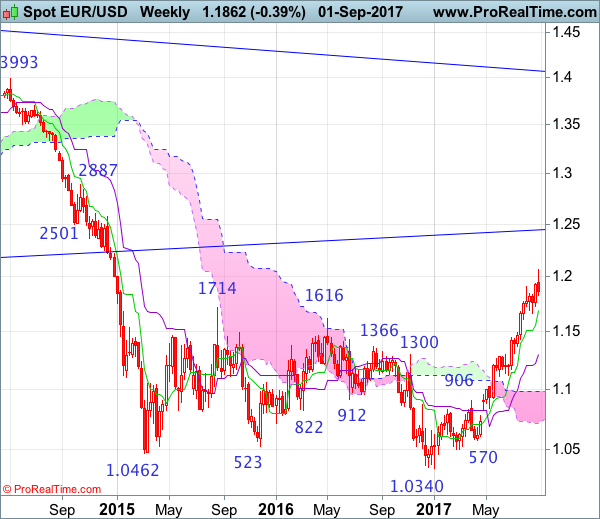
EUR/USD Candlesticks and Ichimoku Analysis
Weekly
• Last Candlesticks pattern: Shooting star
• Time of formation: 31 Jul 2017
• Trend bias: Near term up
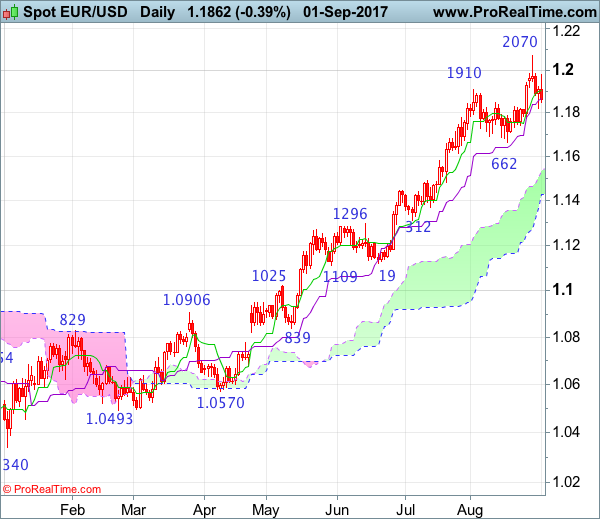
Daily
• Last Candlesticks pattern: Shooting star
• Time of formation: 2 Aug 2017
• Trend bias: Up
EUR/USD – 1.1900
Although the single currency extended recent rise to 1.2070 last week, the quick retreat from there formed a shooting star bearish reversal pattern on the daily chart, suggesting consolidation below this level would be seen and consolidation with mild downside bias is seen for weakness to 1.1770-75, then test of support at 1.1740, however, reckon support at 1.1662 would hold from here, risk from there is seen for a rebound to take place later. Only a daily close below this support would suggest top has possibly been formed, bring correction of recent upmove to 1.1613 support, then test of the upper Kumo (now at 1.1532).
On the upside, expect recovery to be limited to the Tenkan-Sen (now at 1.1905) and resistance at 1.1980 (Friday’s high) would hold, bring another corrective fall later. A daily close above said resistance at 1.1980 would signal the pullback from 1.2070 has ended instead, bring further gain to 1.2000, then retest of 1.2070 and possibly 1.2100-10, however, loss of upward momentum should prevent sharp move beyond dynamic resistance at 1.2165-70 (50% Fibonacci retracement of 1.3993-1.0340) and price should falter below 1.2200-10, bring retreat later.
Recommendation: Exit long entered at 1.1870 and stand aside for this week.
On the weekly chart, despite last week’s initial rise to 1.2070, the subsequent retreat formed a black candlestick with a long upper shadow, suggesting consolidation below this level would be seen and pullback to 1.1770-75 and then 1.1740 is likely, however, reckon downside would be limited to the Tenkan-Sen (now at 1.1691) and support at 1.1662 should hold from here. A weekly close below this support would suggest a temporary top is formed, bring retracement of recent rise to 1.1610-15, then 1.1550-60 and later towards 1.1435, having said that ,downside should be limited to 1.1370 and support at 1.1312 should remain intact, bring rebound later.
On the upside, although initial recovery to 1.1940-45 cannot be ruled out, reckon Friday’s high at 1.1980 would hold from here and bring another retreat later. A weekly close above said resistance at 1.1980 would extend gain towards last week’s high at 1.2070 but break there is needed to confirm recent upmove from 1.0340 low has resumed for headway towards 1.2160-70 (50% Fibonacci retracement of 1.3993-1.0340) but loss of upward momentum should limit upside and reckon 1.2220-30 would hold, price should falter below 1.2300-10, bring another retreat later.
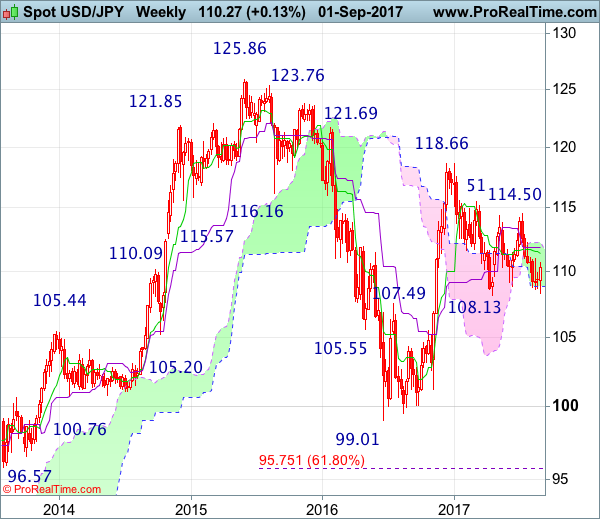
USD/JPY Candlesticks and Ichimoku Analysis
Weekly
• Last Candlesticks pattern: Dark cloud cover
• Time of formation: 10 Jul 2017
• Trend bias: Down
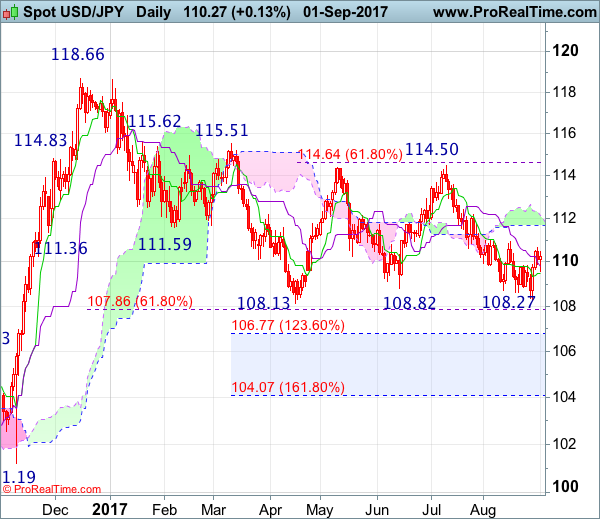
Daily
• Last Candlesticks pattern: Evening doji
• Time of formation: 7 Aug 2017
• Trend bias: Down
USD/JPY – 109.53
Although the greenback extended recent fall from 114.50 to as low as 108.27, as the pair then staged a strong rebound after holding above previous support at 108.13, suggesting medium term downtrend is not ready to resume yet and further consolidation above said 2016 low would take place and another bounce towards resistance at 110.95 cannot be ruled out, however, break there is needed to signal the aforesaid fall from 114.50 has ended at 108.27, bring retracement of this fall to the lower uno (now at 111.66) but reckon the upper Kumo (now at 112.15) would limit upside and resistance at 112.20 should remain intact.
On the downside, expect pullback to be limited to 109.15-20 (61.8% Fibonacci retracement of 108.27-110.67) and bring another rebound. A daily close below 108.95-00 would suggest the rebound from 108.27 has possibly ended, bring weakness to 108.50-55 but said support at 108.27 should hold from here. In the event dollar is able to penetrate said support at 108.13, this would confirm early decline from 118.66 top has resumed and extend weakness to 107.50, then towards 106.50-55 (61.8% Fibonacci retracement of 99.01-118.66).
Recommendation : Hold short entered at 110.55 for 108.55 with stop above 110.50.
On the weekly chart, despite last week’s fall to 108.27, the subsequent rebound after holding above this year’s low at 108.13 formed a white candlestick (first one in 8 weeks), suggesting the fall from 114.50 has formed a temporary low there, hence consolidation above this level is seen for another bounce to resistance at 110.95, then test of the Tenkan-Sen (now at 111.39) and possibly to the Kijun-Sen (now at 111.82), however, reckon resistance at 112.20 would limit upside and price should falter below 112.90-00, bring another decline later.
On the downside, whilst pullback to 109.90 cannot be ruled out, reckon support at 108.50-55 would hold and bring another rebound later. A sustained breach below last week’s low at 108.27 would revive bearishness but dollar needs to penetrate support at 108.13 to confirm early fall from 118.66 top has resumed for weakness to 117.40-50, then 117.00, however, downside should be limited to 106.50-55 (61.8% Fibonacci retracement of 99.01-118.66) and previous resistance at 105.53 would turn into support, price should stay above 105.00, bring rebound later.
GBP/USD Daily Outlook
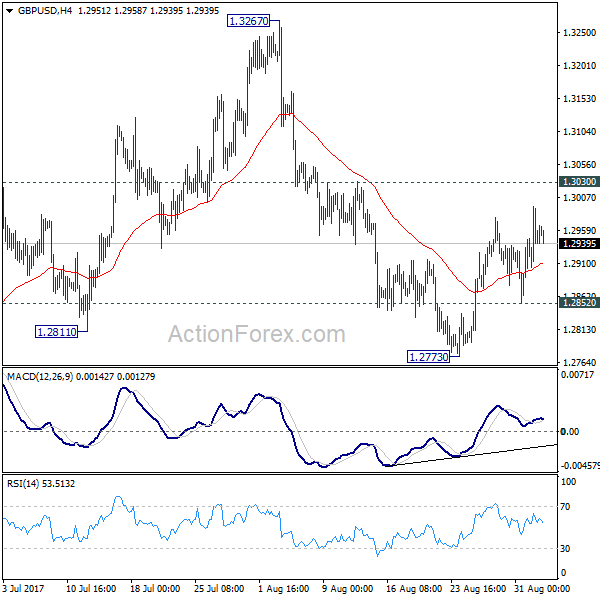
Daily Pivots: (S1) 1.2905; (P) 1.2950; (R1) 1.2996; More...
Intraday bias in GBP/USD remains neutral for the moment. Outlook stays bearish with 1.3030 resistance intact. We're favoring the case that correction from 1.1946 is completed at 1.3267. Below 1.2852 minor support will turn intraday bias back to the downside for 1.2588 key near term support first. Decisive break of 1.2588 will confirm our view and target a test on 1.1946 low. Though, break of 1.3030 will dampen this bearish view and turn bias back to the upside for retesting 1.3267.
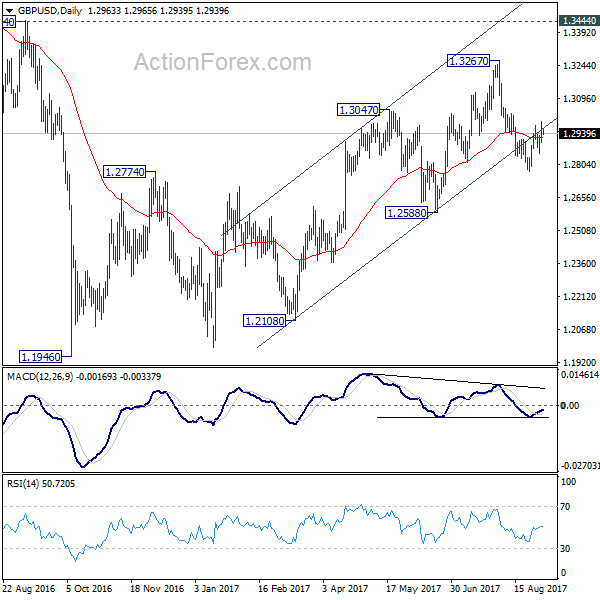
In the bigger picture, overall, price actions from 1.1946 medium term low are seen as a corrective pattern. While further rise cannot be ruled out, larger outlook remains bearish as long as 1.3444 key resistance holds. Down trend from 1.7190 (2014 high) is expected to resume later after the correction completes. And break of 1.2588 will indicate that such down trend is resuming.
Sterling Awaits UK Construction PMI
The British pound has opened the new trading week with a bullish trading tone against the U.S dollar, as investors await the release of the United Kingdom construction PMI, for the month of August.
After Friday's weaker than expected U.S Nonfarm payrolls job report, sterling moved to 1.2995, but failed to close price above the 50-day moving average, at 1.2984, and was subsequently rejected towards 1.2955.
Sterling remains bullish on a short and medium-basis, with price now needing to move clearly above the 1.2990 level, to break-away from range bound trading conditions.
Key technical resistance is located at the monthly pivot point, at 1.2990, the 1.3047 level, and the former monthly pivot point, at 1.3082.
Key intraday technical support is located at the weekly pivot point, at 1.2952, and the daily pivot point, at 1.2932. The 100-day moving average is found at 1.2920, with further strong support found at 1.2889.
USDJPY Gaps Lower On North Korea Fears
The U.S dollar has opened the new trading week sharply lower against the Japanese Yen, as risk-off sentiment returned to forex markets after North Korea successfully tested a nuclear capable hydrogen bomb over the weekend.
So far, the USDJPY has fallen as low as 109.50, with the pair opening the week, gap down, on the price charts. Markets are likely to be increasingly driven by headlines, coming from the worsening situation in the Korean peninsula.
The USDJPY pair is currently trading around the 109.80 level, with price trading below daily and weekly 50,100 and 200 period moving averages.
Key intraday technical support is found at the 200-hour moving average, at 109.59, the 109.30 level, and the crucial 108.60 level.
To the upside, resistance is found at the M5 time frame 200 period moving average, at 110.02.
Above 110.02, the top of the weekly price gap is found at 110.24, with further USDJPY resistance found at 110.59 and 110.84.
USD/JPY Daily Outlook
Daily Pivots: (S1) 109.71; (P) 110.09; (R1) 110.62; More...
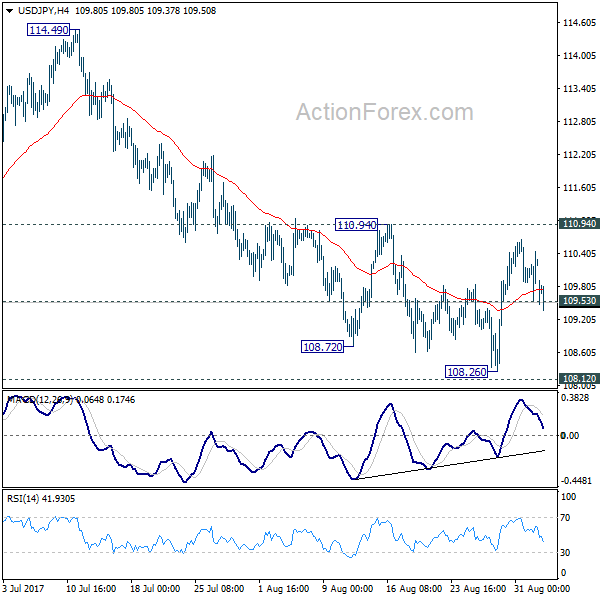
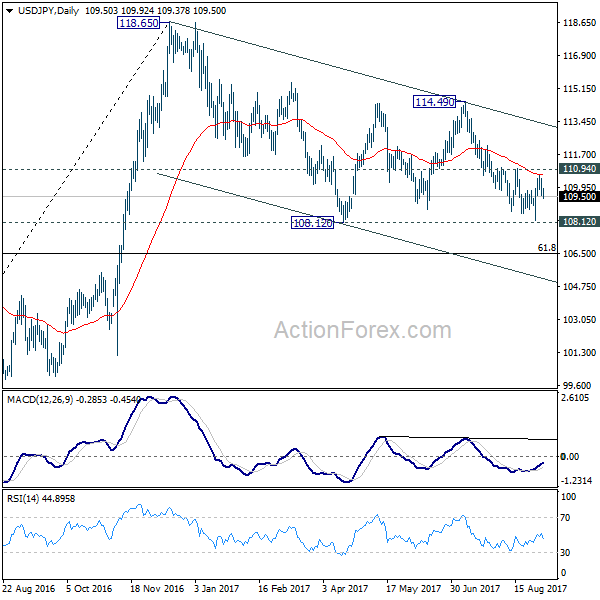
Break of 109.53 minor resistance argues that recovery from 108.26 has completed. Intraday bias is turned back to the downside for 108.12/26 support zone. Firm break of 108.12 support will resume the whole corrective decline from 118.65. In that case, USD/JPY will target 61.8% retracement of 98.97 to 118.65 at 106.48. In any case, outlook will remain cautiously bearish as long as 110.94 resistance holds. Nonetheless, considering bullish convergence condition in 4 hour MACD, break of 110.94 will indicate near term reversal and bring stronger rebound back towards 114.49 resistance.
In the bigger picture, the corrective structure of the fall from 118.65 suggests that rise from 98.97 is not completed yet. Break of 118.65 will target a test on 125.85 high. At this point, it's uncertain whether rise from 98.97 is resuming the long term up trend from 75.56, or it's a leg in the consolidation from 125.85. Hence, we'll be cautious on topping as it approaches 125.85. If fall from 118.65 extends lower, downside should be contained by 61.8% retracement of 98.97 to 118.65 at 106.48 and bring rebound.
Labour Day To See Limited Action In Financial Markets
The global financial markets will see limited action on Monday, as North America pauses for the annual Labour Day holiday.
The European Sentix investor confidence survey headlines the economic calendar at the start of the week. The monthly report, which is used to gauge the sentiment of institutional investors, is forecast to slip to 27.4 in September from 27.7 the previous month.
In terms of official data, the European Union's statistical agency will report on producer inflation at 09:00 GMT. The producer price index (PPI) is forecast to climb 0.1% in July after dropping 0.1% the previous month. This translates to a year-over-year gain of 2.2%, according to estimates.
IHS Markit and the Chartered Institute of Purchasing and Supply (CIPS) will also report on UK construction activity. The construction purchasing managers' index (PMPI) is forecast to edge up to 52.0 in August from 51.9 the previous month.
The economic calendar features several high-profile events this week, including a pair of monetary policy decisions by the Bank of Canada (BOC) and European Central Bank (ECB).
In currencies, the US dollar moved lower at the start of the week. The dollar index (DXY) fell 0.2% to 92.66 at the start of Asian trading. The greenback rebounded sharply last week on the heels of better than expected data releases.
On Friday, the US Labor Department said nonfarm payrolls rose by 156,000 in August, below forecasts calling for 180,000.
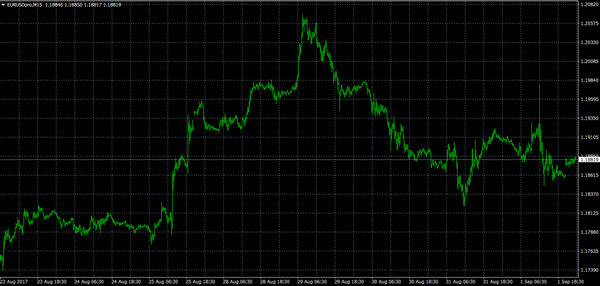
EUR/USD
The euro opened higher on Monday, as the market stabilized following a volatile week. The EUR/USD exchange rate rose 0.2% to 1.1886, where it was awaiting key fundamental cues in the form of monetary policy and economic data. The pair faces immediate support at 1.1820. Below that level, 1.1740 is the next immediate play. On the opposite side of the spectrum, resistance is located at 1.1920, followed by 1.1960. Only then can the pair extend its rally back toward the August high of 1.2064.
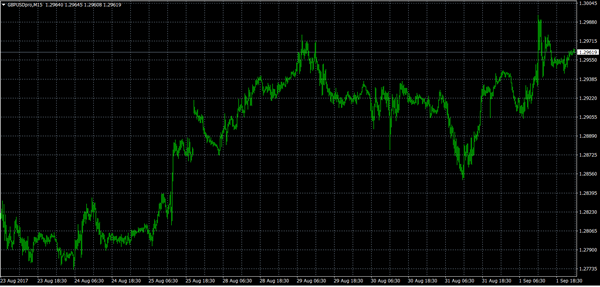
GBP/USD
The British pound broke higher on Friday after the nonfarm payrolls miss, with the GBP/USD moving past the 50-day simple moving average (SMA). The GBP/USD pair extended gains on Monday, climbing 0.1% to 1.2963. The psychological 1.30 level continues to offer immediate resistance. Above that level, the pair is eyeing 1.3040. On the downside, immediate support is likely found at 1.2880, followed by 1.2850.
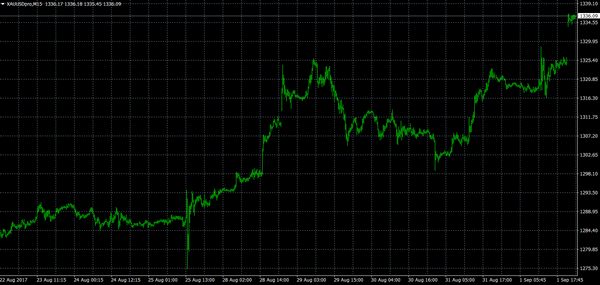
GOLD
The gold rush continued Monday, with bullion surging to new yearly highs. Spot prices opened 0.8% higher, bullion reaching $1,336.00 a troy ounce on the Comex division of the New York Mercantile Exchange. The rush to gold likely reflects renewed risk aversion in the financial markets after North Korea tested its most powerful nuclear bomb yet.
Euro Holding Crucial Trend Support Vs US Dollar
Key Highlights
- The Euro corrected from 1.2070 to 1.1850 against the US Dollar this past week.
- The EUR/USD is currently holding a major bullish trend line support near 1.1850-70 on the 4-hours chart.
- The US Non-farm Payrolls in August 2017 were 156K, down from the last 189K (revised).
- The US Unemployment Rate was up in August 2017 from 4.3% to 4.4%.
EUR/USD Technical Analysis
The Euro was under pressure above 1.2050 against the US Dollar. As a result, there was a decline in EUR/USD recently, but the pair is holding a major support area near 1.1850.
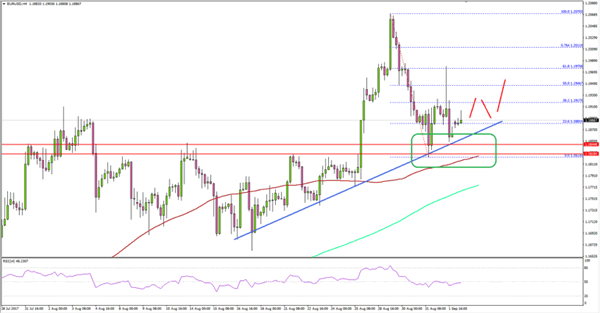
Looking at the 4-hours chart, there is a major bullish trend line support near 1.1850-70. The mentioned 1.1850 level is also a key horizontal support. Furthermore, the 100 simple moving average (H4) is also positioned near 1.1825.
Therefore, the 1.1850 support is very important for the current uptrend in EUR/USD. On the upside, the pair face challenges near 38.2% and 50% Fib retracement level of the last decline from the 1.2070 high to 1.1823 low at 1.1917 and 1.1946 respectively.
US NFP, Unemployment Rate and ISM Manufacturing Index
This past Friday, there were a few important releases in the US such as the non-farm payrolls of August 2017, the unemployment rate and the ISM Manufacturing Index.
The nonfarm payrolls figure published by the US Department of Labor for August 2017 was forecasted to increase by 180K. However, the actual result was disappointing, as the nonfarm payroll employment increased by 156K in August 2017.
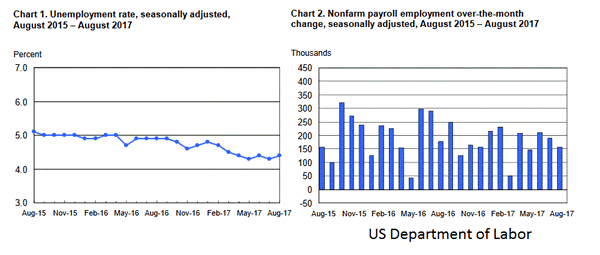
Furthermore, the last NFP reading was revised down to 189K. Looking at the US Unemployment Rate, there was an increase in August 2017 from 4.3% to 4.4%.
The report added that:
The labor force participation rate, at 62.9 percent, was unchanged in August and has shown little movement on net over the past year. The employment-population ratio, at 60.1 percent, was little changed over the month and thus far this year.
Later, the Institute for Supply Management (ISM) Manufacturing Index for August 2017 was released. The forecast was slated for a rise from 56.3 to 56.5. However, the result was positive, as there was an increase to 56.8.
Overall, the EUR/USD is holding a monster support at 1.1850. As long as the pair is above 1.1850, it might recover and trade back towards 1.1950-1.2000 in the near term.
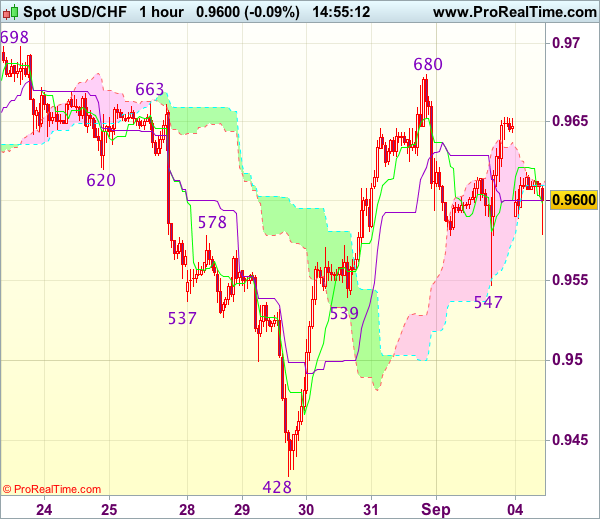
Trade Idea : USD/CHF – Stand aside
USD/CHF - 0.9598
Most recent candlesticks pattern : N/A
Trend : Down
Tenkan-Sen level : 0.9599
Kijun-Sen level : 0.9600
Ichimoku cloud top : 0.9613
Ichimoku cloud bottom : 0.9610
New strategy :
Buy at 0.9540, Target: 0.9640, Stop: 0.9505
Position : -
Target : -
Stop : -
The greenback opened lower today and further consolidation below last week’s high of 0.9680 would be seen, hence downside risk is for another fall towards 0.9539-47 support area, however, if our view that low has been formed at 0.9428 last week is correct, downside would be limited and bring another rebound later. Above 0.9653-55 resistance would bring another test of 0.9680 but break there is needed to add credence to this view and extend gain to resistance at 0.9698-99 which needs to be penetrated to retain bullishness for headway to 0.9730-40.
In view of this, would not chase this rise here and would be prudent to buy dollar on subsequent retreat. Below 0.9515-20 would risk weakness to 0.9490-00 but still reckon downside would be limited to 0.9450-60 and said support at 0.9428 should remain intact, bring another rebound later.
North Korean Hydrogen Bomb Test Rattles Markets
On Sunday, North Korea claimed that it had conducted a test of a hydrogen bomb meant to be carried by a long-range missile. The test of a 100-kiloton bomb was 10 times larger than anything previously tested and is 7 times more powerful than the bomb that destroyed Hiroshima to end the second world war.
Chinese President Jinping warned 'a dark shadow is looming over the world' and, in a joint statement with Russia said its ally North Korea would be 'appropriately dealt with'. With this latest test, geopolitical tensions have risen and the markets have reacted with a risk off sentiment turning to Yen and Gold to hold.
In economic news, the NFP release on Friday was a big surprise to the markets coming in at 156K against the consensus of 180K. The markets were hoping the recent strong ADP release (237K against the forecast 185K), whilst there is not a direct correlation between the two, would result in a strong NFP. With Average Hourly Earnings also decreasing (to 0.1% from the previous 0.3%), it is evident that the lack of upward inflationary pressure will likely delay the Fed in hiking rates this year. As a result, USD was sold against its peers, as the market has determined there is little value in holding the greenback.
ECB President Draghi is expected to express concern over EUR strength when the ECB meets on Thursday. A number of Federal Reserve officials are scheduled to speak this week, including member of the Board of Governors Lael Brainard, Minneapolis Fed President Neel Kashkari, Dallas Fed President Robert Kaplan and New York Fed President Bill Dudley, all of who have expressed doubt about the need for another rate hike this year. US markets are closed on Monday for the Labour Day Bank Holiday.
EURUSD is trading near early highs set on Monday, currently trading around 1.1899.
USDJPY was sold following the North Korea bomb test and is currently trading around 109.55.
GBPUSD is little changed from Friday, currently trading around 1.2955.
Gold is living up to its safe-haven status, climbing up to $1,337.98 in early Tuesday trading. Currently, Gold is trading around $1,337.
WTI is down 0.25% in early trading to currently trade around $47.60pb.
At 09:30 BST, the UK Chartered Institute of Purchasing & Supply and Markit Economics will release PMI Construction for August. Markets are expecting a slightly better release of 52, from the previous release of 51.9. Unless the release is significantly different from the consensus the markets do not expect to see any impact on GBP.
At 10:00 BST, Eurostat will release Eurozone Producer Price Index (YoY) for July. The consensus is calling for a lower number of 2.2% compared to the previous release of 2.5%. Whilst a lower number is traditionally seen as bearish for EUR, the markets do not expect any major impact to the value of EUR as they await further clarity of monetary policy from the ECB at their meeting on September 7th.