Sample Category Title
Technical Outlook: EURUSD In Narrow Consolidation On Monday, Focus On ECB Later This Week
The Euro is holding within narrow range on Monday, limited by daily Tenkan-sen (1.1905) at the upside and Kijun-sen (1.1866) which holds the downside. The pair remains heavy following Friday's close in red after the dollar fell on downbeat jobs data but regained strength after better than expected US Manufacturing data which improved the tone. Friday's bearish candle with long upper shadow weighs on near-term action which would extend weakness on violation of Tenkan-sen support towards 1.1822 pivot (20SMA/4-hr cloud base) as rising 4-hr cloud underpins today's action so far. Overall structure is bullish, with current pullback seen as correction before renewed attempt above 1.2000 barrier. ECB policy meeting on Thursday is the key event for Euro as traders expect to hear more from Mario Draghi about ECB's QE program tapering. The pair may stay in a choppy trading until then, waiting for clearer signals from the ECB. Extended dips should be contained by 20SMA to keep bulls intact, while break lower will be seen as bearish signal for deeper correction.
Res: 1.1905, 1.1946, 1.1979, 1.2000
Sup: 1.1866, 1.1822, 1.1807, 1.1740
Trade Idea: GBP/USD – Buy at 1.2900
GBP/USD – 1.2939
Original strategy :
Buy at 1.2900, Target:1.3050, Stop: 1.2840
Position: -
Target: -
Stop: -
New strategy :
Buy at 1.2880, Target:1.3080, Stop: 1.2820
Position: -
Target: -
Stop:-
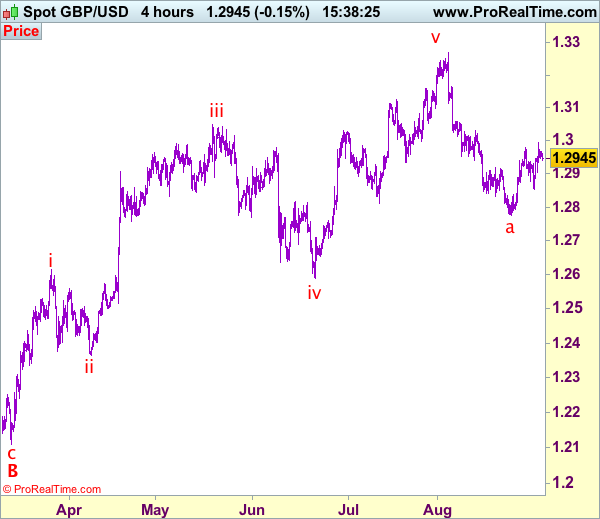
As cable has retreated after Friday’s brief rise to 1.2996, suggesting minor consolidation would be seen and pullback to 1.2900-05 cannot be ruled out, however, reckon downside would be limited to 1.2880 and as long as support at 1.2852 holds, prospect of another rise remains, above 1.2996-00 would add credence to our view that low has been formed at 1.2774 and extend the corrective rise from there for retracement of recent decline from 1.3269 to resistance at 1.3032, then towards 1.3090-00 later.
In view of this, would be prudent to buy sterling on dips. Below said support at 1.2852 would defer and risk weakness towards 1.2800-10, however, only break of latter level would suggest the rebound from 1.2774 has ended instead, risk retest of this level, break there would extend the selloff from 1.3269 top to 1.2750, then towards 1.2700-10 later.
Our preferred count on the daily chart is that cable's rebound from 1.3500 (wave (A) trough) is unfolding as a wave (B) with A ended at 1.7043, followed by triangle wave B and wave C as well as wave (B) has ended at 1.7192, the subsequent selloff is the larger degree wave (C) which is still unfolding with minor wave (III) of larger degree wave 3 ended at 1.1986, hence wave (IV) correction is in progress which could either be a triangle wave (IV) of a complex formation but upside should be limited to 1.3500 and price should falter well below 1.4000, bring another decline in wave (V) of 3 for weakness to 1.1500, then 1.1200.
Trade Idea: GBP/JPY – Exit long entered at 141.60
GBP/JPY - 141.70
Original strategy:
Bought at 141.60, Target: 143.60, Stop: 141.00
Position: - 141.60
Target: - 143.60
Stop: - 141.00
New strategy :
Exit long entered at 141.60,
Position: - Long at 141.60
Target: -
Stop:-
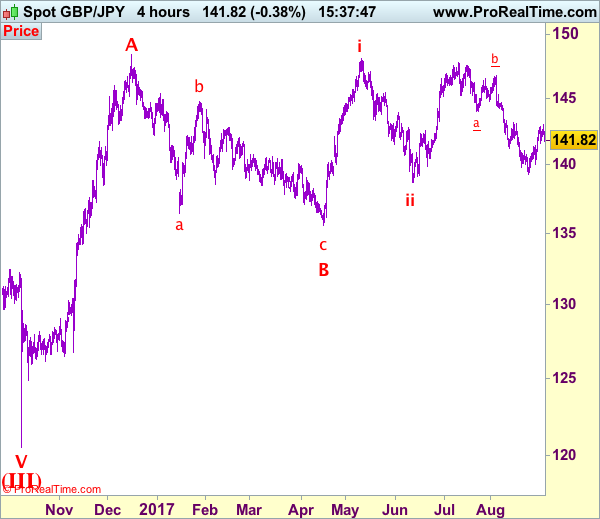
Although the British pound resumed recent rise to 143.00 on Friday, lack of follow through buying on break of previous resistance at 142.90 and the subsequent retreat dampened our bullishness and downside risk is seen for pullback to 141.55-60, break there would suggest top is possibly formed, then weakness to 141.00 would follow but reckon support at 140.45 would limit downside and price should stay well above support at 140.05.
In view of this, would be prudent to exit long entered at 141.60 and stand aside for now. Above 142.15-20 would bring rebound to 142.50-60 but only break of said Friday’s high at 143.00 would revive bullishness and extend the rise from 139.35 to 143.20 and then 143.50-60, however, upside should be limited to 144.00-10.
Our preferred count is that larger degree wave V with circle is unfolding from 251.12 with wave (I) 219.34, (II): 241.38 and wave (III) is subdivided into 1: 192.60, 2: 215.89 (23 Jul 2008) and wave 3 ended at 118.87 earlier in 2009. The correction from there to 162.60 is wave 4 which itself is a double three and is labeled as first a-b-c ended at 151.53, followed by wave x at 139.03, 2nd a ended at 162.60, 2nd b at 146.75 and 2nd c leg of wave 4 ended at 163.00. Therefore, the decline from 163.00 to 116.85 is now treated as wave 5 which also marked the end of larger degree wave (III), hence wave (IV) major correction has commenced for retracement of the wave (III) from 241.38 and upside target at 183.95-00 (50% Fibonacci retracement of the wave (II) from 241.38) had been met, a drop below 160.00 would suggest wave (IV) has ended at 195.85, bring decline in wave (V) for initial weakness to 130 (already met) and 120.
Technical Outlook: USDJPY – Yen Advances On Safe-Haven Buying After North Korea Nuclear Test
The Japanese yen was among the top gainers in Asia on Monday as geopolitical tensions raised again after North Korea made another nuclear test over the weekend, prompting investors into safer assets.
The USDJPY pair opened with gap lower of some 80 pips on Monday, with subsequent recovery attempt being capped under 110.00 barrier and fresh weakness after the latest news, saying that North Korea is preparing for another missile test, sent the price below 109.46 pivot (daily Tenkan-sen).
Daily studies are entering full bearish setup which would, along with negative fundamentals, pressure the pair further.
Extension below 109.18 (Fibo 61.8% of 108.26/110.68 upleg) will generate another bearish signal for renewed attack at 108.83 (weekly cloud base) which was dented in several probes lower but so far without close below.
Near-term outlook remains negative and may see further easing, with sustained break below weekly cloud base, to open way towards key supports at 108.26 (29 Aug spike low)/108.11 (17 Apr low).
Broken Kijun-sen offers resistance art 109.65, with extended upticks expected to stay capped under psychological 110.00 barrier, reinforced by falling 30SMA.
Res: 109.65, 110.00, 110.44, 110.66
Sup: 109.38, 109.18, 108.83, 108.60
EURUSD Neutral With Increased Risk To Downside In Short-Term, Medium-Term Uptrend Intact
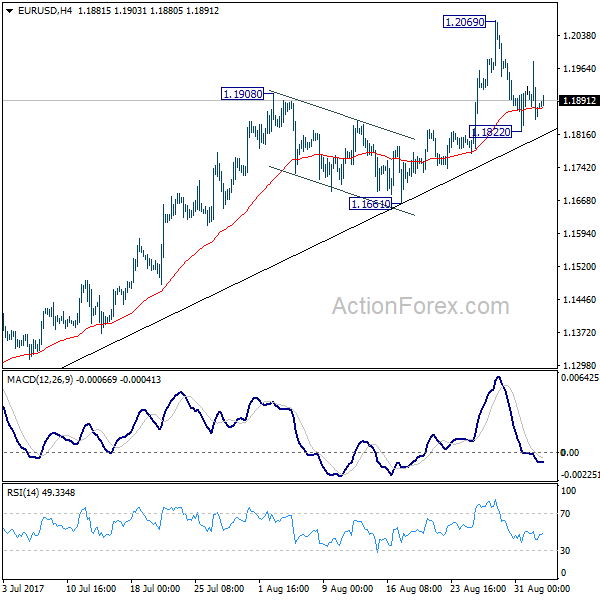
EURUSD has stalled its uptrend and is likely shifting into a neutral phase. The pair maintains the bullish medium-term market structure and remains in an ascending channel. After reaching a multi-year high of 1.2069 on August 29, upside momentum faded and prices fell back to close below the key 1.2000 level last Friday.
Momentum indicators (RSI and MACD) are moving sideways and highlight the shift into a neutral phase, while remaining in bullish territory.
It remains to be seen whether EURUSD has made a short-term top at 1.2069. While the pair is likely in the early stages of a consolidation phase, the immediate risk is for a move lower towards 1.1772 (August 25 low). This is the bottom of the expected consolidation range, with resistance at the range-top at 1.1983.
A break below 1.1661 support and August17 low increases the odds for a deeper fall to 1.1471, bringing the market near the 50% Fibonacci retracement level of the 1.0820 to 1.2069 uptrend. From here, a bearish outlook becomes stronger.
Alternatively, a daily close above immediate resistance at 1.1900 would shift the focus back to the upside for a re-test of the 1.2069 high. A sustained move higher would see a resumption of the uptrend to strengthen the bullish outlook with scope to rise to the 1.2200 area.
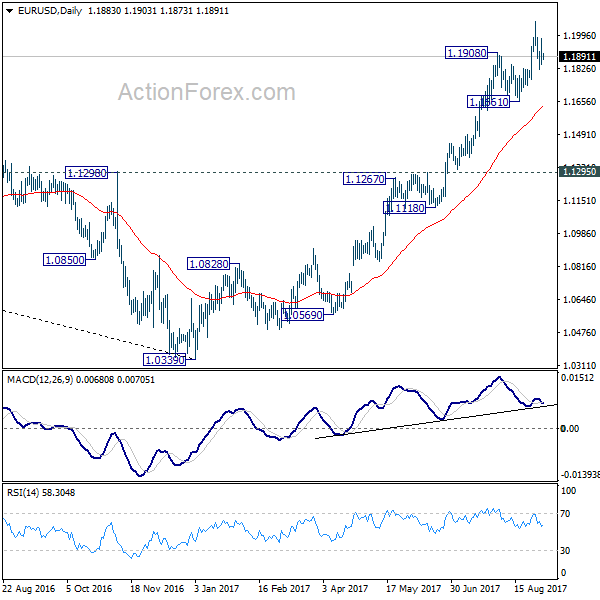
In the short-term EURUSD is leaning to bearish due to increased risk to the downside. The overall technical picture on the daily chart is bullish. This is confirmed by the bullish crossover of the 50-day with the 200-day moving average on May 23. Both moving averages are pointing upwards.
Trade Idea: EUR/JPY – Hold long entered at 130.30
EUR/JPY - 130.29
Original strategy:
Bought at 130.30, Target: 132.30, Stop: 129.70
Position: - Long at 130.30
Target: - 132.30
Stop: - 129.70
New strategy :
Hold long entered at 130.30, Target: 132.30, Stop: 129.90
Position: - Long at 130.30
Target: - 132.30
Stop:- 129.90
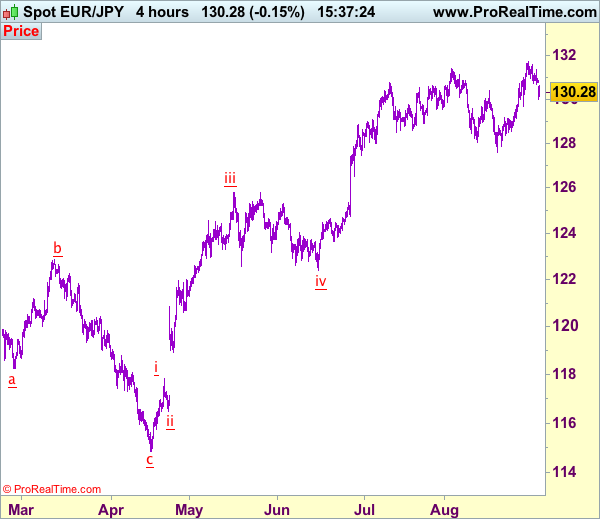
As the single currency opened lower after retreating from last week’s high of 131.71, suggesting caution on our bullishness and 129.95-99 needs to hold to retain prospect of another rebound, above 131.35 would signal the pullback from 131.71 has ended and bring retest of this level later, above there would confirm recent upmove has resumed and extend gain to 132.00-10 but reckon upside would be limited to 132.50-60 and 133.00-10 should hold from here, bring retreat later.
In view of this, we are holding on to our long position entered at 130.30. Below 129.95-99 would risk another test of indicated support at 129.66 but only break there would signal top is formed instead, risk correction to 129.10-15 first.
Our latest preferred count is that wave (ii) is ABC-X-ABC which ended at 123.33 and wave (iii) is unfolding with wave iii ended at 100.77, followed by wave iv at 111.57 and wave v as well as the wave (iii) has ended at 97.04, followed by wave (iv) at 111.43 and wave (v) has ended at 94.12 which is also the end of the larger degree v, this also implied the major wave (C) has also ended there, hence major correction has commenced from there with (A) leg unfolding in its lower degree wave c which has possibly ended at 145.69. Under this count, A-B-C wave (B) has commenced with A leg ended at 136.23, wave B at 143.79 and wave C has possibly ended at 149.79.
Our larger degree count is that the decline from 139.26 is wave (C) and is sub-divided into a diagonal triangle i-ii-iii-iv-v with wave i - 105.44, wave ii- 123.33, wave iii - 97.03, wave iv - 111.43, followed by the final wave v as well as the end of wave (C) at 94.12, this also mark the bottom of larger degree wave B. Under this count, major rise in wave C has commenced as an impulsive wave with minor wave III ended at 145.69, wave V is still in progress for further gain to 150.00. Having said that, this so-called wave V could well be the first leg of larger degree 5-waver wave C and this wave C should bring at least a retest of wave A top at 169.97 (July 2008).
Safe Havens On The Rise As North Korea Raises The Bar
Safe haven assets were back in demand early Monday, following yesterday's announcement that North Korea had tested their most powerful nuclear bomb yet.
Gold, Treasuries, Swiss Franc and the Yen have all outperformed, as investors try to assess the potential impact of North Korea's nuclear test. The markets' reaction seems similar to when missile launches have taken place in the past; investors sell stock, rush to safe havens, assess the situation, and then buy the dips as tension eases. While stocks fell in Asia, the selloff was not massive, mainly because the nuclear test occurred over the weekend and there was enough time to digest the news.
An H-bomb is undeniably different from the previous missile launches or nuclear tests; it's a game changer for North Korea's deterrent strategy. However, the biggest question to investors remains - what's next? Will the tensions lead to negotiations, or war?
It is becoming evident that leaders across the globe are divided about how to deal with the situation. President Trump believes South Korea's talk of appeasement with North Korea will not work, and they "only understand one thing". Although he didn't elaborate on what this "one thing" is, he's plainly referring to a military action, but given that this is not the first time he has threatened such actions, investors do not seem seriously concerned.
China, the closest political and economic ally to the Kim Jong Un regime, also seems to be losing influence, but war is the last thing they want to happen. A military attack on North Korea could mean an unmanageable flow of refugees to China, instability in the region, disruption of trade and of course, no country would desire a war in its backyard. That's why markets aren't yet pricing in the possibility of a war. However, caution should remain at this stage.
Once the tension eases, the focus will shift to monetary policy decisions during the ECB's meeting this Friday, which is the biggest risk event for the week. The crucial question facing the central bank on Thursday is whether Mario Draghi will announce the date of cutting bond purchases. The decision to taper asset purchases was widely expected to occur this week, but given the strength of the Euro and implications on the inflation target, the ECB might push the decision until October. Mario Draghi has refrained from weakening the euro through verbal intervention, although the minutes from July's meeting showed concerns over the single currency's strength. Any verbal intervention will likely lead to a further drop in the euro from its highest levels in 2.5 years.However, if economic data continues to surprise to the upside, even the central bank will find it difficult to control the bulls from buying the currency.
Trade Idea: AUD/USD – Stand aside
AUD/USD – 0.7948
New strategy :
Stand aside
Position: -
Target: -
Stop:-
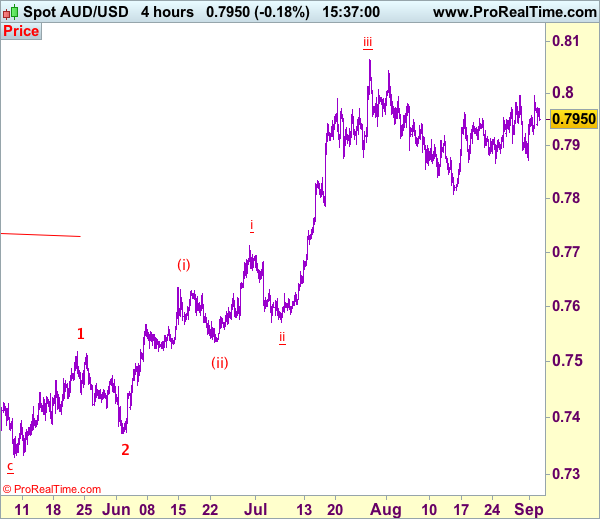
Despite rising to 0.7995 on Friday, as aussie has retreated again after faltering below resistance at 0.7996, suggesting further choppy trading within recent established broad range would take place and weakness to 0.7920-25 cannot be ruled out, however, reckon downside would be limited to 0.7890-00 and support at 0.7871 would remain intact, bring another rebound later. A drop below 0.7871 would suggest the erratic rise from 0.7808 has ended, brig further fall to 0.7850 but price should stay above said support at 0.7808 due to near term oversold condition.
On the upside, expect recovery to be limited to 0.7970 and said resistance at 0.7996 should remain intact, bring another retreat later. Above this level would revive bullishness and signal the pullback from 0.8066 has ended earlier at 0.7808, bring further gain to 0.8040-43, then subsequent retest of this level which is likely to hold from here.
On the 4-hour chart, the move from 0.8066 is the wave 5 with i: 0.8860, ii: 0.8315, wave iii is an extended move ended at 1.0183, iv: 0.9706 and wave v has ended at 1.1081 (also the top of entire wave 5). The subsequent selloff is the major correction which is unfolding as ABC-X-ABC and 2nd A leg has ended at 0.8848, followed by a-b-c wave B which ended at 0.9758, hence, 2nd C wave is now in progress and indicated downside target at 0.7000 and 0.6950 had been met, so further fall to 0.6710-20 cannot be ruled out.
EUR/USD Daily Outlook
Daily Pivots: (S1) 1.1813; (P) 1.1896 (R1) 1.1944; More...
Intraday bias in EUR/USD remains neutral for the moment. Consolidation from 1.2069 might extend and below 1.1822 will bring deeper fall. But after all, there is no clear sign of trend reversal yet. Outlook will remain bullish as long as 1.1661 holds. Break of 1.2069 will extend larger rise from 1.0339 to next key fibonacci level at 1.2516. Nonetheless, break of 1.1661 will bring much lengthier consolidation first.
In the bigger picture, an important bottom was formed at 1.0339 on bullish convergence condition in weekly MACD. Sustained trading above 55 month EMA (now at 1.1774) will pave the way to key fibonacci level at 38.2% retracement of 1.6039 (2008 high) to 1.0339 (2017 low) at 1.2516. While rise from 1.0339 is strong, there is no confirmation that it's developing into a long term up trend yet. Hence, we'll be cautious on strong resistance from 1.2516 to limit upside. For now, medium term outlook will remain bullish as long as 1.1295 support holds, in case of pull back.
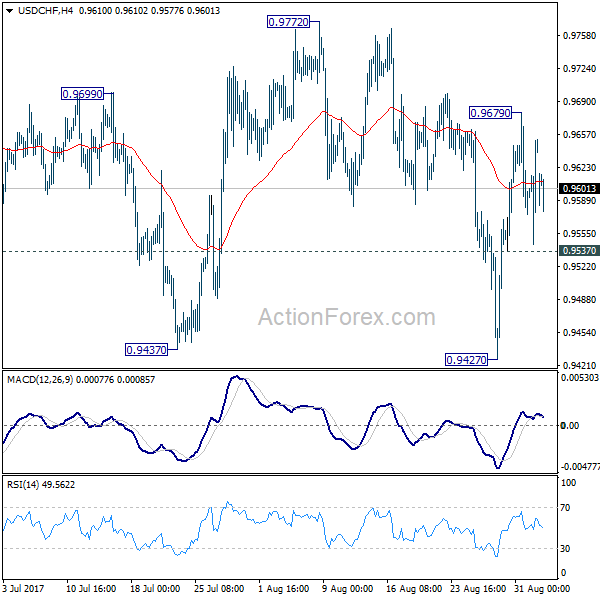
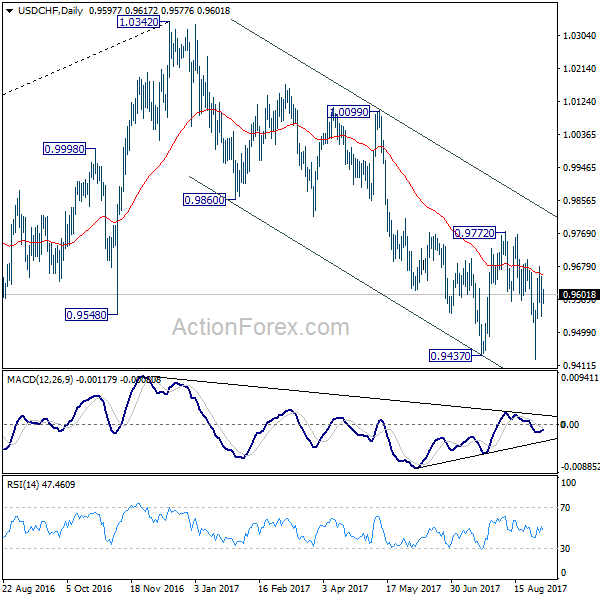
USD/CHF Daily Outlook
Daily Pivots: (S1) 0.9575; (P) 0.9614; (R1) 0.9682; More....
Intraday bias in USD/CHF remains neutral for the moment. Considering it's close to to 0.9443 key support, consolidation from 0.9427 might extend further. But still, break of 0.9772 resistance is needed to confirm near term reversal. Otherwise, outlook stays bearish for another decline. Below 0.9537 minor support will turn bias back to the downside for retesting 0.9427 first. Break of 0.9427 will resume whole decline from 1.3042.
In the bigger picture, current development suggests that 0.9443 key support (2016 low) could be taken out firmly as down trend form 1.0342 extends. There are various interpretation of the price actions. But in any case, medium term outlook will stay bearish as long as 0.9772 resistance holds. Current down trend could extend to 38.2% retracement of 0.7065 (2011 low) to 1.0342 (2016 high) at 0.9090. However, break of 0.9772 will indicate that USD/CHF has successfully defended 0.9443 again and turn outlook bullish for 1.0099 resistance.