Sample Category Title
NZD/USD Falling Wedge?
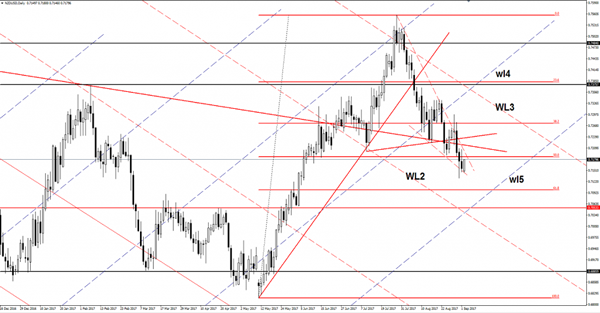
The NZD/USD has developed a Falling Wedge pattern, which could be validated very soon if the rate will climb above the 50% Fibonacci line again. Price will drop much deeper if will stay under the 50% Fibonacci line. The next downside target will be at the 61.8% retracement level and lower at the fifth warning line (wl5).
Gold Registered An Amazing Jump
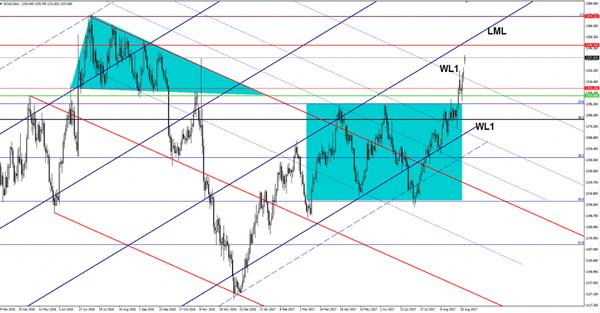
Gold rallies and seems unstoppable on the short term. You can see on the Daily chart that has opened with a gap up and now is approaching the 1348 horizontal resistance, where he could find supply again. Is strongly bullish after the impressive breakout above the WL1. Resistance can be found also at the lower median line (LML) of the major ascending pitchfork.
AUD/USD Shows Exhaustion Signs
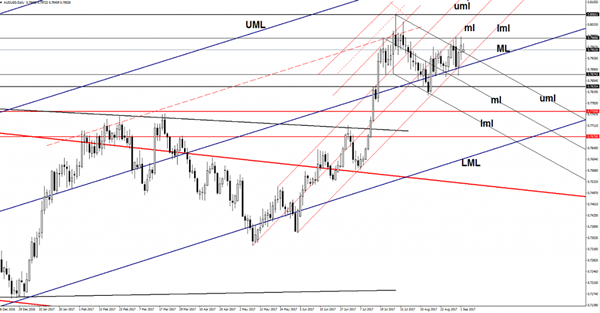
Price increased in the early morning, but stays much below the 0.7994 Friday's high. The perspective remains bullish on the daily chart as the uptrend is still intact. Is premature to talk about a corrective phase because it is located above some important support levels.
Is very important to see how the USDX will react in the upcoming period, it's still under massive selling pressure because is trapped under major resistance levels. USDX decreased in the morning and should retest the 92.49 horizontal support, could still start a leg higher as long as it stays above this obstacle.
The Aussie increased on the mixed Australian data, the Company Operating Profits dropped by 4.5% in the second quarter, more versus the 3.9% estimate, the indicator plunged after the 5.8% growth in the former reading period. Moreover, the ANZ Job Advertisements rose by 2.0%, beating the 1.6% in the previous reading period, while the MI Inflation Gauge rose by 0.1%.
Price looks a little exhausted after the failure to reach and retest the median line (ml) of the minor ascending pitchfork. Now is retesting the upper median line (uml) of the minor descending pitchfork, could come to retest the confluence area formed at the intersection between the lower median line (lml) with the upper median line (uml).
The major upside target remains at the 0.8065 static resistance, will approach it if will stay within the ascending pitchfork's body. A major drop will come only if the rate will make a valid breakdown below the median line (ML) of the major ascending pitchfork.
GOLD – Targets Further Strength Towards Key Resistance
GOLD - The commodity continues to retain its upside as it close on a rally the past week. On the downside, support comes in at the 1,320.00 level where a break will turn attention to the 1,320.00 level. Further down, a cut through here will open the door for a move lower towards the 1,300.00 level. Below here if seen could trigger further downside pressure targeting the 1,330.00 level. Conversely, resistance resides at the 1,340.00 level where a break will aim at the 1,350.00 level. A turn above there will expose the 1,360.00 level. Further out, resistance stands at the 1,370.00 level. All in all, GOLD looks to weaken further.
Gold Is Bullish But Has Reached Overbought Levels
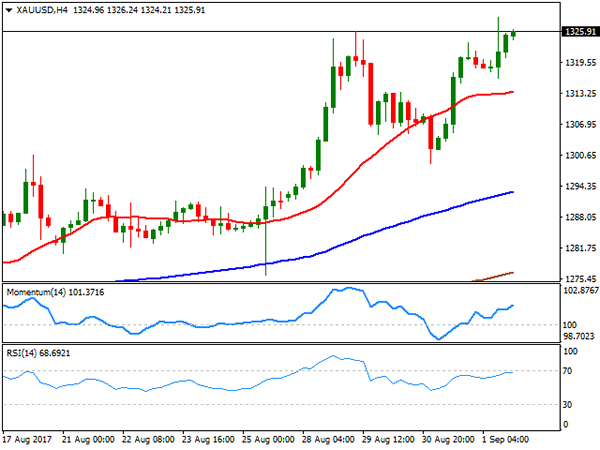
Gold is bullish both in the short and medium-term and has approached its highest level since September 2016 at 1339.64. The broader undertone remains strong and there is little sign that the uptrend will change in the near term.
However, the short-term momentum oscillators are indicating the market has reached overbought levels.
Following a jump higher above the key 1330 level today, RSI rose above 70 and the stochastic is above 80, both indicating an overbought market. (4-hour chart)
The odds are high for a pause in the uptrend and for prices to begin a consolidation phase with strong immediate support at 1330 and resistance at 1340. A break below 1330 would target the September 1 low at 1316.37 ahead of key support at 1300. Below this psychological level, a dip lower to 1280 is likely. From here the outlook would turn more bearish for gold to slip towards 1251.49. Then an extension to 1204.79 cannot be ruled out for a complete reversal of the uptrend from the July 10 low.
A sustained break above 1340 on the 4-hour chart would trigger a rally to 1352.57, which was a high from a year ago in September 2016. Such a move would strengthen the underlying uptrend with scope for another leg higher to the next major peak at 1375.
The short-term picture is bullish based on the positive alignment of the moving averages on the 4-hour chart. The 20 SMA has crossed above the 50 SMA. Meanwhile, the medium-term outlook is also bullish with the uptrend from 1204 still intact.
Safe-Havens Gain Demand As North Korea Fires A Hydrogen Bomb, Gold Tops At 11-Month High Amid Rising Geopolitical Risks
It was another risk-off Monday for investors as North Korea was said to have fired its sixth and most powerful weapon on Sunday, driving the demand for safe-haven assets higher while the US markets were closed for the Labour Day holiday. Gold gained the most, hitting a fresh 11-month high during the Asian trading hours.
Yesterday, the North Korean regime announced that it had successfully tested a hydrogen bomb as a response to the US-South-Korean military exercise conducted last week. Although there was no independent verification whether the nuclear weapon was a hydrogen bomb, experts said that the earthquake of a magnitude of 6.3 Richter following the explosion, was ten times stronger than the tremor identified in previous tests, suggesting that use of a hydrogen weapon was a possibility.
Following the news, Donald Trump threatened on Sunday to stop any trade relations with nations collaborating with the North Korean regime, while referring to South Korea, he argued that 'South Korea is finding, as I have told them, that their talk of appeasement with North Korea will not work, they only understand one thing!' Later on Monday, South Korea said that it was preparing further military drills with the US, while the UN National Security has scheduled a meeting today to discuss additional sanctions against North Korea. Moreover, Trump has requested to be kept informed on all available military options.
The dollar index which gauges the dollar’s strength against a basket of major currencies was trading lower by 0.20% at 92.62.
Dollar/yen weakened by 0.65% to 109.53 while dollar/swissie declined by 0.47% to 0.9601.
The pound edged down to $1.2953 despite the dollar’s weakness, as uncertainty around Brexit weighted on the currency.
The euro rose by 0.28% to $1.1891 ahead of the ECB policy meeting on Thursday, where central bankers are expected to keep interest rates unchanged. Regarding the reduction in asset purchases, the discussion is said to start only on Thursday but traders might have to wait until October for any announcements on the decision.
In other currencies, the aussie was in a downtrend after the Australian business data released earlier in the Asian session missed expectations. Business inventories dropped unexpectedly by 0.4% while analysts anticipated the figure to rise moderately by 0.4%. In the previous quarter business inventories posted a growth of 1.2%. Likewise, Australian gross company profits fell by 4.5%. This was compared to a 6% gross profit increase seen in the first quarter and a 4% decline forecasted.
The commodity-linked loonie gained some ground on Monday versus its US counterpart, as a number of key oil refineries in Texas, which were harmed by the costliest tropical storm Harvey (150-180 billion dollars), restarted their operations during the weekend. Moreover, the Bank of Canada (BOC) is scheduled to launch its next policy meeting Wednesday, where the markets expect the rates to remain steady. However, a rate hike is not completely out of the question, based on upbeat growth figures. Dollar/loonie was last trading at 1.2402.
Looking at commodities, oil prices were mixed, while gold which is considered a safe investment in times of risk aversion hit an eleven-month high as geopolitical tensions heightened between the US, North Korea, and Japan. WTI crude futures rose to $47.36 per barrel, while Brent fell to $52.40. The yellow precious metal topped at an eleven-month high of $1337.62 per ounce, up by 1.0%, amid heightened political tensions in the Korean peninsula.
Technical Outlook: AUDUSD At The Back Foot In Asia, RBA In Focus
The Aussie came under pressure in early European trading and returns near session low at 0.7944, posted after gap-lower opening on Monday. Weak Australian data overnight also helped near-term bears after recovery attempts in Asia were limited at 0.7970 zone. Rising geopolitical tensions also weigh, however, overall bullish structure remains intact for now as the price stays above converged daily Tenkan-sen/Kijun-sen lines (0.7930/25) which mark pivotal support and guard daily cloud top (0.7891). RBA's policy meeting on Tuesday is in focus with expectations for unchanged interest rates at 1.5% but investors will be looking for post-meeting rhetoric for signals.
Res: 0.7970, 0.7995, 0.8010, 0.8042
Sup: 0.7944, 0.7925, 0.7911, 0.7891

Forex Technical Analysis: EUR/USD, USD/JPY, GBP/USD
EUR/USD
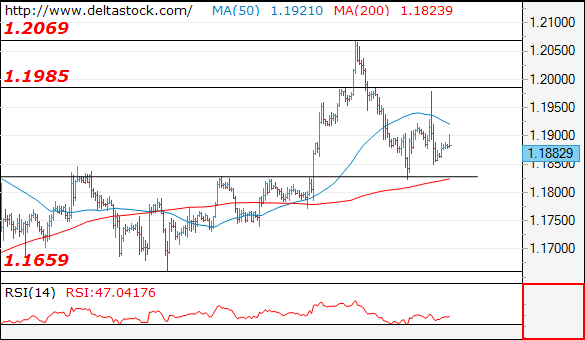
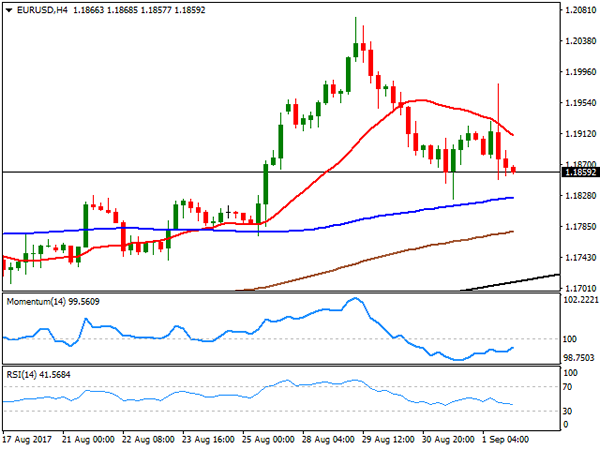
Current level - 1.1882
The pattern above 1.1830 is corrective in nature and keeping in mind the recent 'pin bar'on the daily frame (29.08), there is a risk of breaking lower, through 1.1830, towards 1.1660 support. Intraday allow another leg upwards, to 1.1980 resistance zone.
| Resistance | Support | ||
| intraday | intraweek | intraday | intraweek |
|
1.1980 |
1.2070 |
1.1830 |
1.1830 |
|
1.2070 |
1.2160 |
1.1740 |
1.1660 |
USD/JPY
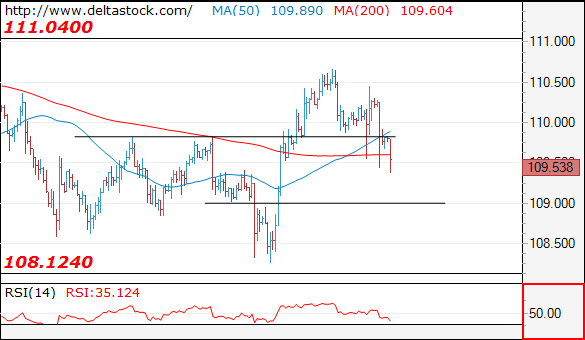
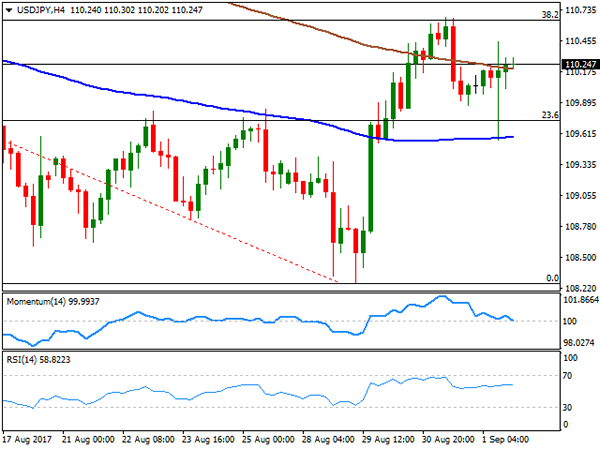
Current level - 109.53
The intraday outlook is negative, for a slide towards 109.00 static support. A violation of the latter will signal another test of 108.10 lows.
| Resistance | Support | ||
| intraday | intraweek | intraday | intraweek |
|
109.80 |
111.00 |
109.00 |
108.10 |
|
110.60 |
112.20 |
108.10 |
107.00 |
GBP/USD
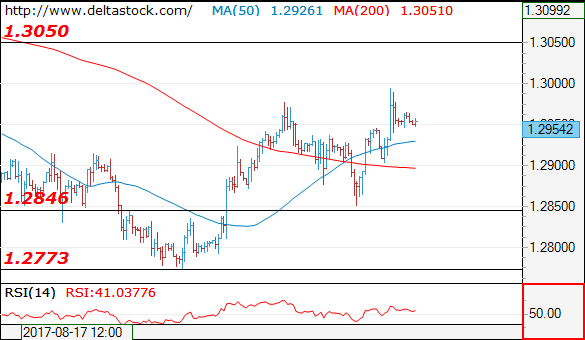
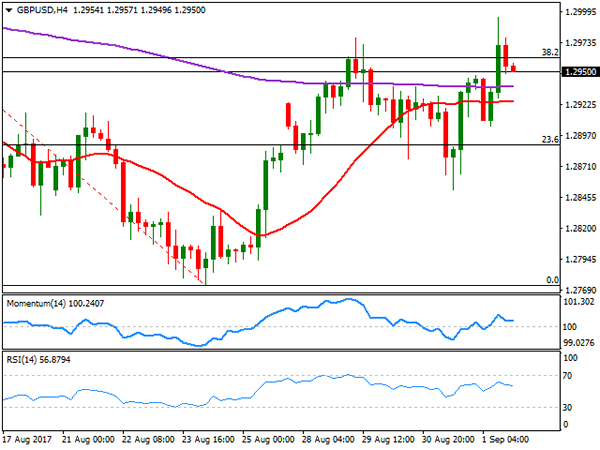
Current level - 1.2954
The bias remains positive, for a rise towards 1.3050 zone. Minor intraday support lies at 1.2930 and crucial on the downside is 1.2900.
| Resistance | Support | ||
| intraday | intraweek | intraday | intraweek |
|
1.3050 |
1.3157 |
1.2900 |
1.2773 |
|
1.3157 |
1.3260 |
1.2846 |
1.2606 |
Foreign Exchange Market Commentary: EUR/USD, USD/JPY, GBP/USD, GOLD, WTI CRUDE, DJIA, FTSE100, DAX
EUR/USD
A really disappointing US Nonfarm Payroll report was not enough to keep the common currency afloat last Friday, resulting in the EUR/USD pair closing the week in the red around 1.1860. The greenback initially plunged across the board with the release, and if fact, remained pressured against most of its major rivals afterwards. What hit the EUR was new jawboning from ECB through news agencies reporting that the Central Bank will probably delay tapering QE beyond September, according to "people familiar with the matter," amid latest EUR's strength. US data showed that the world's largest economy added 156,000 new jobs in August, well below the 180K expected, the unemployment rate uptick to 4.4% from 4.3%, while more relevant, wages' growth remained steady at 2.5% YoY, not building the inflationary pressures the Fed needs to pull the trigger again.
On Sunday, North Korea said it has successfully tested a hydrogen bomb for its intercontinental ballistic missile, causing a 6.3-magnitude tremor in the country's northeast. South Korea and Japan asked for the strongest possible response and for the UN to include new sanctions to "completely isolate" the country, whilst US President Trump twitted that such response "will not work," as they only "understand one thing," referring to a military response. Risk aversion will likely lead the weekly opening, favoring the Swiss Franc and Gold the most this Monday, which by reflection will likely help the common currency to advance. In the meantime, the ECB will have its monetary policy meeting this week, with speculative interest focused on whether the ECB will confirm their fall discussion on tapering, or the delay suggested by the latest rumors.
From a technical point of view, the decline has barely affected the dominant bullish trend, as the price managed to bounce earlier on the week from its 20 DMA, the immediate support at 1.1860. Technical indicators in the daily chart have retreated within positive territory, whilst the price is far above a long-term ascendant trend line, around 1.1700/20 for this Monday. A daily close below this last should signal an interim top has been reached. Shorter term, and according to the 4 hours chart, the risk turned to the downside, with the price extending below a bearish 20 SMA, and the RSI indicator heading south around 41, as the Momentum hovers within negative territory. Below 1.1860, the pair has its next strong support in the 1.1780/90 region, a probable bearish target in the case the pair is unable to regain the 1.1900 level.
Support levels: 1.1860 1.1820 1.1785
Resistance levels: 1.1920 1.1965 1.2000
USD/JPY
The USD/JPY pair ended the week in the green at 110.24, as despite US soft employment and sentiment data released on Friday, the pair managed to recover ahead of the close. Worst-than-expected US jobs report sent the pair down to 109.55 intraday, but quickly recovered on the back of advancing Treasury yields. The yield on the 10-year Treasury note settled at 2.16% from a previous 2.12%, while the yield on the 30-year Treasury bond was also higher at 2.77% from previous 2.72%. Helping the pair to bounce, was the US official manufacturing PMI, up to 58.8 in August from July reading of 56.3, indicating growth in the manufacturing sector for the twelfth consecutive month and partially offsetting the NFP report. Escalating geopolitical tensions during the weekend, as North Korea performed a major nuclear test, should affect the JPY at the weekly opening, although given that Japan is within the conflict area, speculative interest may prefer gold or the CHF as safe-havens rather than the yen. The weekly gain was quite limited and not a game changer for the dominant bearish trend, as the pair topped for the week at 110.66, a couple of pips above the 38.2% retracement of its latest daily decline between 114.49 and 108.26. In the daily chart, the 100 and 200 DMAs maintain their bearish slopes above the current level, while technical indicators are stuck within neutral territory, directionless. Shorter term, and according to the 4 hours chart, the price is around its 200 SMA, having bounced sharply after testing the 100 SMA, while the Momentum indicator heads lower around its mid-line and the RSI consolidates around 58, limiting the downward potential.
Support levels: 109.80 109.35 108.80
Resistance levels: 110.60 110.95 111.30
GBP/USD
The GBP/USD pair recovered up to 1.2995 on Friday and on the back of poor US employment data, ending the day, and the week marginally higher at 1.2950. A scarce UK macroeconomic calendar kept the pair within a limited range these last few days, alongside with headlines indicating another round of tough Brexit negotiations. During the week, EU chief negotiator, Michael Barnier, said that "no progress" was made on substantial issues, while EU Junker stated that none of the UK's Brexit position papers were satisfactory. The base of the conflict is that the EU wants to settle the Brexit bill before moving any further, while the UK refuses to talk money and wants to agree on future trade first. UK Brexit minister, David Davis was on the wires over the weekend, insisting that there was no legal obligation that force the UK to pay for EU projects after leaving the bloc, also calling Barnier "silly," as according to Davis, progress was actually made. Anyway, uncertainty over the matter prevented the pair from regaining the 1.3000 level, and will likely remain as a market motor in the days to come, alongside with risk sentiment. From a technical point of view the pair presents a neutral-to-bullish stance in the daily chart, as the price settled above its 20 SMA, whilst technical indicators head nowhere within positive territory. The pair, however, settled below the 38.2% retracement of its latest daily decline around 1.2965, a level that proved strong since mid August. In the 4 hours chart, the technical outlook is quite alike, with the price above horizontals 20 SMA and 200 EMA, both within a well-limited range, and technical indicators heading nowhere within positive territory. The 50% retracement of the mentioned decline stands around 1.3030, a probable bullish target in the case of a Pound's rally.
Support levels: 1.2910 1.2875 1.2830
Resistance levels: 1.2965 1.2995 1.3030
GOLD
Gold prices posted strong gains this past week, with spot closing at $1,325.91 a troy ounce, its highest settlement since September last year. There were multiple factors behind gold's advance, being turmoil around the US government, a persistent weak dollar, and escalating geopolitical tension in Asia among the most relevant, as all contribute to the case of a slower pace of tightening coming from the US Federal Reserve. Gold traded as high as 1,328.82 before retreating modestly, anyway poised to extend its advance, as weekend developments in North Korea will likely fueled demand for the safe-haven metal. Technically, the daily chart shows that the price remains far above a bullish 20 DMA that continues advancing above the larger ones, whilst technical indicators have partially lost upward strength within overbought territory, far however, from suggesting a slide. In the 4 hours chart, technical indicators keep heading north, with the RSI indicator nearing overbought readings, as the price remains above bullish moving averages, all of which supports additional gains on a break above the mentioned yearly high.
Support levels: 1,323.65 1,313.40 1,304.95
Resistance levels: 1,328.85 1,337.35 1,344.10
WTI CRUDE OIL
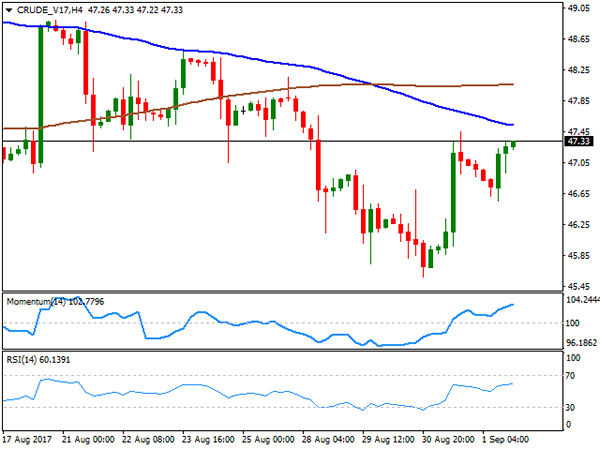
West Texas Intermediate crude oil futures edged sharply higher on Friday, ending the day around $47.30 a barrel, down anyway for a fifth consecutive week. News that the US stockpiles declined by more than expected, according to the EIA, only supported the commodity partially, as the Hurricane Harvey has affected US's refining capacity, and will probably result in less demand for crude in the next few weeks. The EIA data belong to the week ending August 25th, right before the Hurricane hit the US Coast Gulf. News on Friday indicated that the number of active US rigs drilling for oil remained unchanged at 759 last week, according to Baker Hughes that anyway reported that could not verify South Texas rigs amid the impact of Harvey. Daily basis, WTI ended a few cents above a horizontal 100 DMA, while technical indicators aim modestly higher within neutral territory, which is not enough to confirm additional gains ahead. Shorter term, and according to the 4 hours chart, the price remained below its 100 and 200 SMAs, with the shortest heading south below the largest and acting as immediate resistance at 47.50, while technical indicators aim north well above their mid-lines, supporting additional gains on a break above the mentioned resistance.
Support levels: 46.60 45.90 45.40
Resistance levels: 47.50 48.15 48.85
DJIA
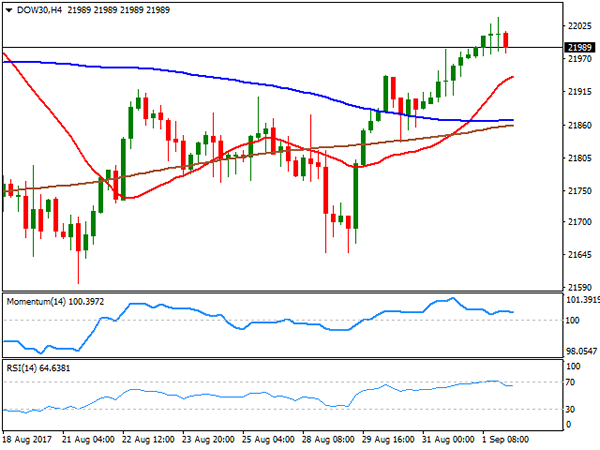
Wall Street closed with gains on Friday, with the DJIA adding 39 points, to end at 21,987.56, while the S&P added 5 points, to close at 2,476.55. The Nasdaq composite settled at an all-time high of 6,435.33 after adding 6 points or 0.10%. US jobs data, which showed that sluggish wage growth persisted in August, backed the rally in local equities as the report could result in US Federal Reserve slowing its tightening pace. Within the Dow, General Electric was the best performer, adding 2.40%, followed by Chevron which added 1.06%. United Technologies was the worst performer, ending the day 1.50% lower, while Microsoft followed, ending down 1.11%. The daily chart for the DJIA shows that the index settled well above a still marginally bearish 20 DMA, while technical indicators turned flat, the Momentum around its mid-line and the RSI now at 58, as the index retreated from its daily high, unable to hold above the 22,000 threshold. In the 4 hours chart, the Momentum indicator keeps retreating within positive territory, the RSI consolidates around 64, while the index remains above all of its moving averages, keeping the downside limited as long as the index holds above the 21,960 region, where buying interest defended the downside for most of the last two-days.
Support levels: 21,960 21,910 21,863
Resistance levels: 22,038 22,086 22,137
FTSE100
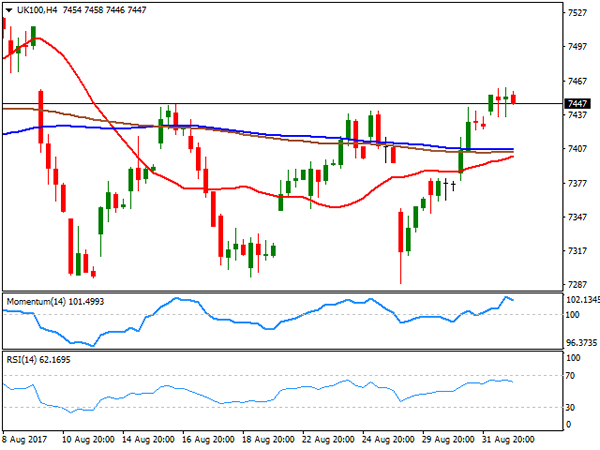
The FTSE 100 advanced 0.11% or 7 points on Friday to close at 7,438.50, backed by a rally in mining-related equities. Weaker-than-expected US data also help the benchmark to remain afloat, as Pound gains were well-limited, in spite of dollar's weakness. Within the Footsie, Ashtead Group was the best performer, adding 2.53%, followed closely by Antofagasta and Glencore, both adding over 2.0%. Micro Focus International was the worst performer, down 7.74%, after the company reported that it merge with HPE could trigger penalties under 2016 US tax inversion regulations. The daily chart for the index shows that it settled above its 20 and 100 DMAs, both converging flat around 7,400, but also that technical indicators head higher within positive territory, favoring an upward extension for this Monday. In the shorter term, and according to the 4 hours chart, the index settled well above all of its moving averages, also converging within a tight range in the 7,400 region, while technical indicators eased modestly from overbought levels, rather reflecting the latest consolidation than suggesting an upcoming downward move.
Support levels: 7,400 7,348 7,313
Resistance levels: 7,444 7,480 7,523
DAX
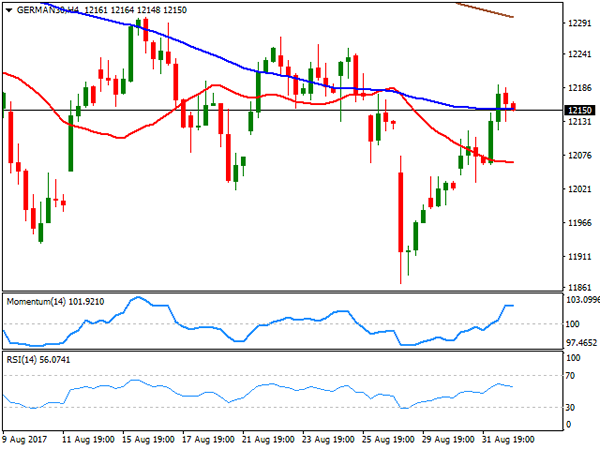
Major European indexes closed higher on Friday, with the German DAX adding 87 points to end at 12,142.64, up for third consecutive day. A weaker EUR, on news suggesting the ECB will delay discussing tapering until next December underpinned local equities. Automotive and mining stocks led the way higher in the region, and within the DAX, Deutsche Lufthansa was the best performer, up 3.23%, followed by Infineon Technologies that added 2.14%. ProSiebenSat.1 Media led decliners, closing the day 1.65% lower, followed by Linde that shed 0.65%. From a technical point of view, the daily chart shows that it settled a few points above a bearish 20 DMA, but also that technical indicators were unable to settle above their mid-lines, limiting the upward potential. In the 4 hours chart, the index advanced above a bearish 20 SMA and closed around a horizontal 100 SMA, while technical indicators turned modestly lower, holding anyway near overbought levels. The weekly high for the index was set at 12,191 with gains beyond it required to favor a new leg higher for this Monday.
Support levels: 12,132 12,093 12,045
Resistance levels: 12,191 12,241 12,286
Daily Technical Analysis: EUR/USD: Risk On Formed The Gap Over The Weekend
Rising tension between the North Korea and US led to safe haven vs risk flows into many currency pairs this weekend and the EUR/USD has formed a retail gap (blue rectangle) to the upside. Risk on is usually reflected on AUD, CAD, NZD and JPY pairs while the USD was defensive in the past. At this point the pair is capped below D H3/WH3 suggesting either a retrace or continuation. If the pair retraces to 1.1840-56 (88.6, trend line, L3, ATR pivot, retail gap) the gap will be closed and it could spike upside. 1h momentum or 4h close above 1.1900 is needed for a continuation towards 1.1930, 1.1967 and retest of 1.2000. Adding to a possible bullish bias is lower than expected NFP with Average Hourly earnings data that were released on Friday.