Sample Category Title
USD/JPY Analysis: Slips On Fears Of Kim Jong-Un
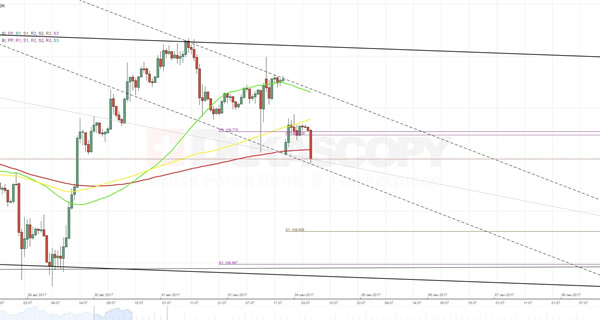
Over the last couple of weeks, movement of the USD/JPY currency pair was strongly affected by news coming from the Korean peninsula. The same thing happened today as well. In result of a successful test of a hydrogen bomb, the Yen started to actively recover against the Greenback.
These growing fears drove the pair straight through a combination of the weekly and monthly PP around 109.75 as well as the 100- and 200-hour SMAs. As a result, now the rate has no any obstacles on its way up until the updated weekly S1 at 108.80. Consequently, the bears are expected to continue to dominate the market at least until the pair will encounter the above support.
EUR/USD Elliott Wave Analysis
EUR/USD – 1.1913
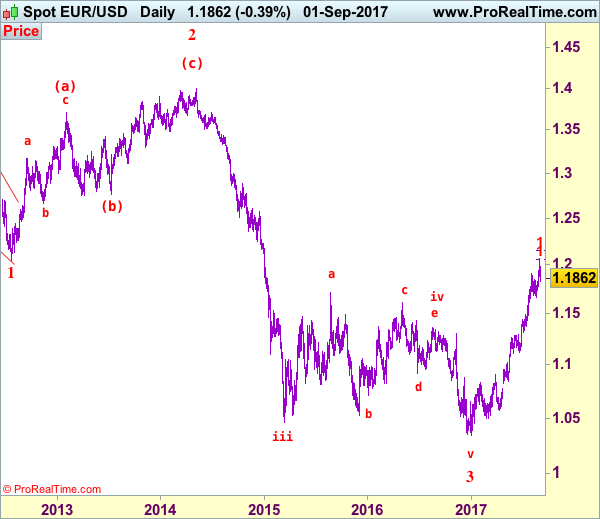
EUR/USD: Wave (c) of 2 ended at 1.3993 and wave 3 of III has commenced for weakness to 1.0411 (1.236 of wave 1), then 1.0000.
Although the single currency extended recent upmove to as high as 1.2070 last week, the subsequent retreat from there suggests 1-2 weeks of consolidation below this level would be seen and pullback to 1.1800, then 1.1770 cannot be ruled out, however, reckon downside would be limited to 1.1740 and support at 1.1662 should remain intact, bring another rise later. Only a drop below this support would signal a temporary top (wave iii peak) was formed at 1.2070, bring retracement of recent upmove to 1.1613 support, then towards 1.1550-60 but near term oversold condition should limit downside to 1.1475-80, bring rebound later.
Our preferred count on the daily chart remains that a wave (II) from 1.2329 ended at 1.5145 with A-leg ended at 1.4720, followed by wave B at 1.2457, the wave C from there was also a 3 legged move and is labeled as (a): 1.3739, (b): 1.2885, the wave iii of the 5-waver (c) from 1.2885 has ended at 1.4339 and wave iv is a triangle ended at 1.3878 and wave v formed a top at 1.5145. The decline from there is a 5-waver (C) with minor wave (i) of I of (C) ended at 1.4218 with wave (ii) ended at 1.4580, wave (iii) ended at 1.3267 and wave (iv) ended at 1.3692 and wave (v) ended at 1.1876, this is also the low of wave I of (C) and wave II ended at 1.4940, hence wave III is now in progress with a diagonal wave 1 ended at 1.2042, the breach of previous support at 1.1876 (wave I trough) adds credence to our view that the wave 2 has ended at 1.3993, wave 3 has commenced for further weakness to 1.0411, then towards 1.0000.
On the upside, whilst recovery to 1.1900-10 cannot be ruled out, reckon resistance at 1.1980 (Friday’s high) would cap upside and bring another leg of corrective fall to aforesaid retracement targets. A daily close above 1.1980 would bring test of 1.2000, break there would signal the pullback from 1.2070 has ended, bring retest of this level, break there would signal medium term upmove has once again resumed and extend headway to 1.2100, having said that, as this move is viewed as the final leg of recent wave 4, reckon upside would be limited and price should falter well below 1.2220-30].
Recommendation: Exit long entered at 1.1850 and stand aside for this week.
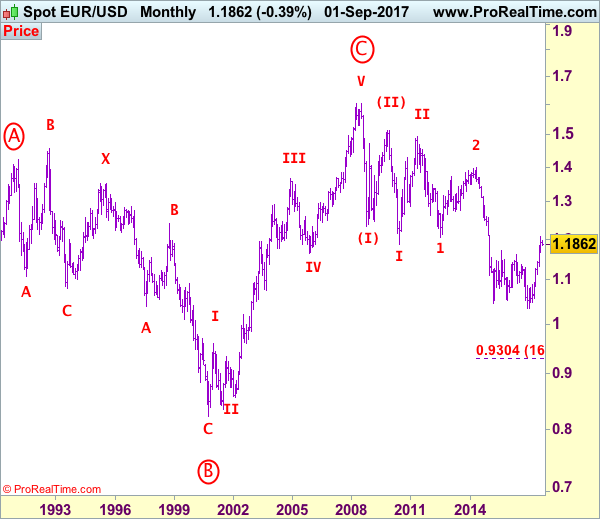
Euro's long-term uptrend started from 0.8228 (26 Oct 2000) with an impulsive structure. The rise from 0.8228 to 0.9593 (5 Jan 2001) is labeled as wave I, the retreat to 0.8352 (6 Jul 2001) is wave II and the rally to 1.3670 (31 Dec 2004) is wave III. Wave IV from there ended at 1.1640 (15 Nov 2005), the subsequent upmove to 1.6040 (July 15, 2008) is treated as wave V, the major selloff from the record high of 1.6040 to 1.2329 (October 27, 2008) signals a reversal has taken place with (I) leg ended at 1.2329 and once (II) ended at 1.5145, wave (III) itself is an extended move with I: 1.1876 and complex wave II ended at 1.4902, wave III has commenced with wave 1 and 2 ended at 1.2042 and 1.3993 respectively, wave 3 of III is now unfolding for weakness towards parity.
XAUUSD Analysis: Tries To Leave Channel Up
A release of the US employment data last Friday predictably stopped the gold from losing value against the buck. In result of the surge that was also strengthened by growing fears over the North Korean crisis, the pair has practically broke through the upper boundary of a dominant ascending channel. From a fundamental side, today the Dollar is not expected to have any news that could motivate it to start to recover. From a technical side, the further surge is obstructed by the updated weekly R1 at 1,339.42 and then by the monthly R1 at 1,348.36. In the meantime, the southern side has a barrier-free area up until the 55- and 100-hour SMAs that are located slightly above the weekly PP a 1,315.75. An average market sentiment point out on a rebound, as 62% of traders remain bearish on the given rate.
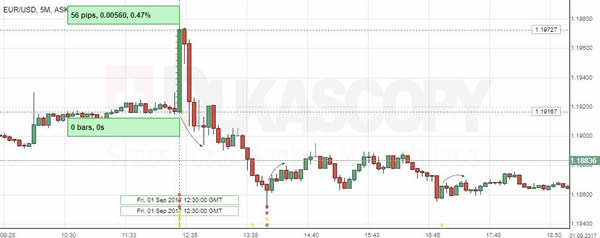
EUR/USD: Non-Farm Employment Change
The combination of US economic reports showing slightly weaker results caused a solid jump in EUR/USD. The Euro strengthened against the Greenback by 56 base points to reach the peak nearing the 1.1972 mark, albeit stronger bearish sentiment restored a downmove in the pair.
The Labour Department revealed that the US marked an increase of 156K new jobs over the course of August, which was below expectations, but strong enough to keep the country’s economy growing at a steady pace. Meanwhile, the unemployment rate rose to 4.4% from 4.3% in the same period. Despite moderation in the labour market, data showed nothing that could undermine the Fed’s intention to start trimming its balance sheet.
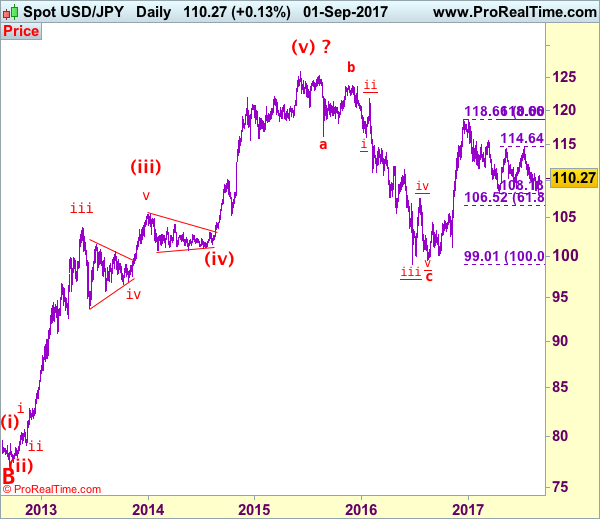
USD/JPY Elliott Wave Analysis
USD/JPY - 109.52
Although the greenback fell briefly to 108.27, as dollar has rebounded quite strongly after holding above this year’s low at 108.13, suggesting early downtrend is not ready to resume yet and further consolidation above this level would be seen, hence another bounce to 110.95 resistance cannot be ruled out, however, break there is needed to add credence to this view, bring retracement of recent fall to 111.35-40 (50% Fibonacci retracement of 114.50-108.27), then towards 111.70-75, however, reckon upside would be limited to resistance at 112.20, bring another decline later.
Our preferred count is that, triangle wave IV (with circle) ended at 101.45 and the circle wave V brought dollar down to the record low of 75.31 in 2011 and the subsequent rebound signal major correction has commenced with A leg ended at 84.19, followed by wave B at 77.14 and impulsive wave C is now unfolding (indicated upside target at 125.00 had been met) for gain towards 127.00 level. In the event dollar drops below support at 99.01, this would confirm medium term decline from 125.86 top (2015 high) has resumed for subsequent weakness to 98.00 and possibly 97.00.
Under this count, this wave C is unfolding as impulsive waves with (1) (2), 1 2 ended at 80.67, 79.07, 82.84 and 81.69 respectively, hence the extended wave 3 has ended at 103.74 and wave 4 correction of recent upmove should bring weakness to 92.57, then towards 90.88 but psychological support at 90.00 should limit downside and bring another rally later in wave 5, indicated target at 125.00 had been met and gain to 127.00 cannot be ruled out but reckon price would falter below 130.00.
On the downside, whilst pullback to 109.80-90 cannot be ruled out, reckon Friday’s low at 109.55 would limit downside and bring another rebound later. A daily close below this level would risk weakness to 109.00, however, reckon said support at 108.27 would hold, bring another rebound later. Looking ahead, only a drop below support at 108.13 (this year’s low) would extend early decline from 118.66 top to 107.50, then 107.00, having said that, reckon 106.50-55 (61.8% Fibonacci retracement of 99.01-118.66) would limit downside and price should stay above 105.00 psychological level.
Recommendation: Sell again at 112.00 for 110.00 with stop above 113.00 or buy at 109.70 for 111.70 with stop below 108.70.
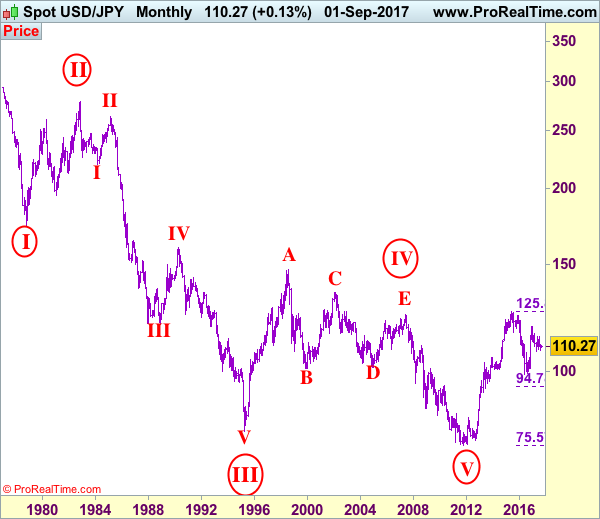
On the monthly chart, we have changed our preferred count that an impulsive wave is unfolding with major wave III with circle ended at 79.75, then followed by wave IV with circle and is labeled as a triangle with A: 147.64 (11 August, 1998), B: 101.25, C: 135.20, D: 101.67 and E leg ended at 124.14 to end the wave IV with circle. Hence, wave V with circle commenced from there and hit a record low of 75.31, however, the subsequent strong rebound signals this circle wave V has possibly ended there, hence gain to (indicated upside target at 122.00 and 125.00 had been met), the retreat from 125.86 suggests wave A of major correction has ended there and wave B correction back to 99.00, then 95.00 would be seen, however, reckon downside would be limited to 90.00, bring another rebound in wave C next year.
GBP/USD: Manufacturing PMI
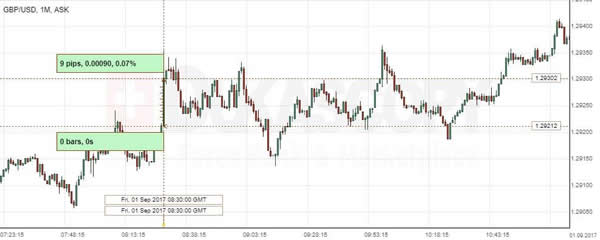
The Sterling appreciated against the US Dollar, as the UK manufacturing sector reported a stronger-than-expected growth in August. GBP/USD rose to the 1.2930 mark to sustain the appreciation up until the US economic reports.
The weakness in the British Pound resulted in a boost of new orders coming from the US and Europe, which supported expansion of the UK manufacturing sector. Markit reported that the country’s Manufacturing PMI rose to the 56.9 mark in August, though remained below the 57.4 figure registered in the Euro zone. However, the sector is still expected to maintain positive growth in the near term given support from a solid recovery in the EZ and higher export competitiveness.
North Korea’s Nuclear Tests Weigh On Risk Sentiment
Investors shelter in safe-haven assets amid North Korea concerns
Once again investors started the week on the back foot as geopolitical tensions escalate over the week-end. With the exception of Chinese equities, which enjoyed a smooth session on Monday, global equities slid in negative territory. The Nikkei was off 0.93%, while the broader Topix index fell 0.99%. European equities followed Japanese ones lower. The Euro Stoxx 50 was down 0.50%, while S&P 500 futures tumbled 0.47%.
North Korea announced it conducted sixth nuclear test on Sunday, triggering another rush for safe haven investments. As usual gold, the Swiss franc and the Japanese yen were better bid, rising 1%, 0.80% and 0.75% respectively. Other precious metals were also in demand with silver climbing 0.80% and palladium rising 0.90%.
Volatility indexes such as the Euro Stoxx volatility index gapped at opening, jumping from 14.7% on Friday to 16.4% on Monday morning. Demand for bonds also surged sending rates lower. German Bunds yields continued to move lower with the 10-year sliding to 0.36%, while on the short-end of the curve the 2-yeat yield reached -0.73%.
EUR/USD edged up in early European session and erased partially Friday’s losses. The single currency rose to $1.1915. The pair is still trading within its multi-month range of 1.1662-1.2070. We do not expect a significant change of behaviour before Thursday’s ECB meeting.
Fundamentals build on GBP reversal
The GBP fall against the Euro continued today reversing last week’s marginal bullish reversal. The sterling verse the euro is now close to its historical low in trade related term. A reality that is not lost on the Bank of England. The MPC has indicated that a 20% decline in the GBP could equal as much as 1.5% increase in inflation depending on the issue. BoE Governor Carney in the past has suggested that exchange rates considerations must be a part of central bank’s policy setting. Should the cause be a decline in relative growth verse global competitors rather than Brexit connected fears then the BoE is more likely to act with higher policy rates. We suspect the current GBP deprecation is a blend of the two increasing the likelihood the BoE will be forced to act.
Economic data from the UK has been on the soft side causing the market to discount potential tighten. However should the domestic inflation and activity suddenly pick up the BoE will quickly shift policy stance. The market is clearly underpricing this potential scenario, yet the probably of a 4Q jump in activity has increase significantly partially due to the weaker sterling. Our bullish GBP call has been under heavy pressure but conditions are pointing to a December move in banks rate will catch the GBP bears short.
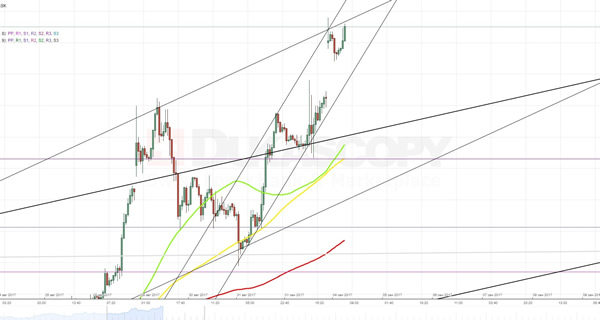
Technical Outlook: Spot Gold Hits Fresh 11-Month High On Safe-Haven Buying After North Korea’s Nuclear Test
Spot Gold spiked to new 11-month high at $1339 on Monday, in reaction on North Korea's nuclear probe over the weekend.
Renewed uncertainty on rising geopolitical tension prompted investors to exit riskier assets and jump into safe haven instruments.
Gold opened with $9 gap higher on Monday, breaking above the upper boundary of short-term bull-channel and extended the wave C, on which the price is riding, through its FE 123.6% at $1337 (also spike high of 09 Nov 2016). The wave may extend towards $1347 (FE 138.2%) as strong safe-haven demand keeps the yellow metal well supported.
Overbought conditions of daily studies have so far been ignored but some corrective action could be anticipated in coming sessions.
Res: 139, 1343, 1347, 1352
Sup: 1331, 1329, 1325, 1316
Technical Outlook: GBPUSD Eases After Weak UK Manufacturing Data But No Clear Direction While The Price Holds Within Daily...
Cable traded within narrow range in Asia and eased to session low at 1.2936 after UK Manufacturing PMI fell to 51.1 in August, undershooting expectation at 52.0 and July’s release at 51.9.
Weak Manufacturing numbers are seen as negative factor for the near-term action which is holding within daily cloud for the fourth straight day.
The action is capped by daily cloud top / falling 30SMA which keep psychological 1.3000 intact for now and maintains negative near-term tone while the price stays below.
No clear direction while the price holds within the cloud, with the notion supported by mixed daily studies.
Extension below 1.2914 (converged 10/20SMA’s) would risk break below daily cloud base (1.2906) and daily Tenkan-sen (1.2884) break of which will be bearish.
Conversely, sustained break above daily cloud / 30SMA and 1.3000 barrier would signal fresh extension of recovery leg from 1.2773, through 1.3020 (daily Kijun-sen) towards 1.3080 (Fibo 61.8% of 1.3268/1.2773 descend.
Res: 1.2965, 1.2980, 1.3000, 1.3020
Sup: 1.2936, 1.2906, 1.2884, 1.2852
Elliott Wave Analysis: GBPUSD Daily And 4H Look
We see GBPUSD unfolding a new bearish reversal, away from the 1.3264 level, where resistance and a probable top was found. That said, ideally a bigger corrective wave IV) was completed and now a minimum three-wave reversal lower is expected to follow, with first wave 1 already completed. A later breach below the 1.2591 swing low would confirm a change in trend.
GBPUSD, Daily
On the 4h chart however we see price trading bullish, but beware this bullish activity from 1.2773 level may be only temporary as we think it can be a higher degree wave two. Ideally this corrective wave two will search for a top near the Fibonacci ratio of 50.0/61.8 and near the former swing high of wave 2) at 1.3023 level and there make a new reversal lower.
GBPUSD, 4H