Sample Category Title
USD/CHF Bouncing Back Higher
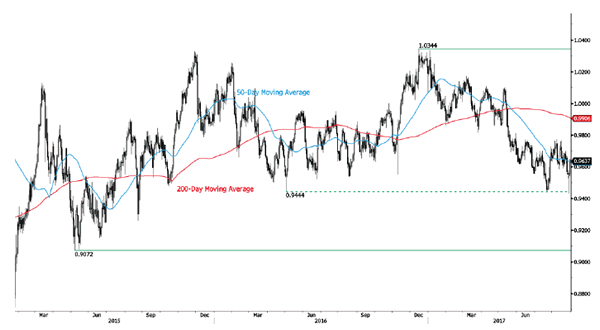
USD/CHF is trading up. Strong resistance is given at 0.9771 (15/06/2017 high). The pair is likely to head further lower way below the broken hourly support at 0.9584 (08/11/2017 low). Expected to show renewed bearish pressures.
In the long-term, the pair is still trading in range since 2011 despite some turmoil when the SNB unpegged the CHF. Key support can be found 0.8986 (30/01/2015 low). The technical structure favours nonetheless a long term bullish bias since the unpeg in January 2015
USD/JPY Short-Term Increase
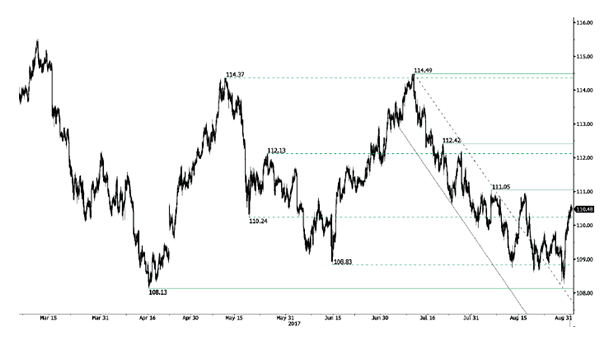
USD/JPY is bouncing off support at 108.13 (17/04/2017 low). The pair is heading towards resistance at 111.05 (04/08/2017 high). Expected to show another leg higher.
We favor a long-term bearish bias. Support is now given at 96.57 (10/08/2013 low). A gradual rise towards the major resistance at 135.15 (01/02/2002 high) seems absolutely unlikely. Expected to decline further support at 93.79 (13/06/2013 low).
GBP/USD Important Downside Risks
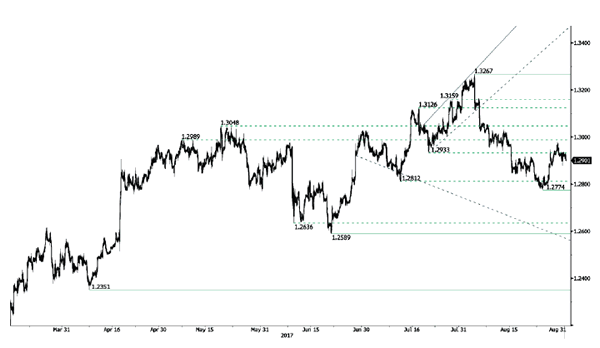
GBP/USD bearish momentum has bounced around support given at 1.2774 (24/08/2017 high). Hourly resistance is given at 1.3031 (11/08/2017 high). Expected to show short-term bearish pressures.
The long-term technical pattern is even more negative since the Brexit vote has paved the way for further decline. Long-term support given at 1.0520 (01/03/85) represents a decent target. Long-term resistance is given at 1.5018 (24/06/2015) and would indicate a long-term reversal in the negative trend. Yet, it is very unlikely at the moment.
EUR/USD Continued Consolidation
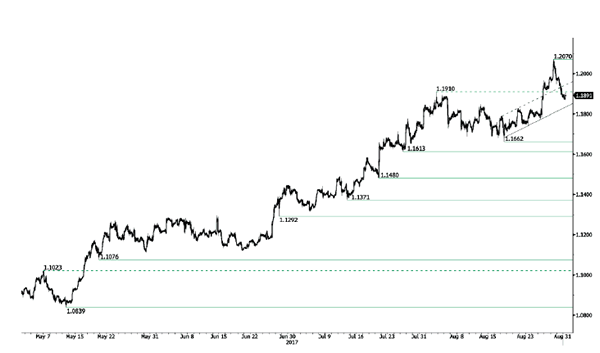
EUR/USD is consolidating lower. Hourly resistance can be found at 1.2070 (29/08/2017 high) while hourly support lies at a distance at 1.1662 (17/08/2017 low). Expected to show increasing bearish pressures.
In the longer term, the momentum is now turning largely positive. We favour a continued bullish bias. Key resistance is holding at 1.2252 (25/12/2014 high) while strong support lies at 1.0341 (03/01/2017 low).
Technical Outlook: GBPUSD Remains Directionless And Holding Within Daily Cloud
Cable stayed in directionless mode during this week as four consecutive small-bodied and long-legged daily candles showed wide amplitude but no clear direction.
The price stayed within daily cloud for most of time, after probe above the cloud was short-lived.
Near-term action remains supported by rising 100SMA (currently at 1.2909) after three spikes below failed to close under 100SMA.
Mixed daily studies also give no clear direction signal, with daily cloud boundaries: 1.2873 (base, reinforced by Tenkan-sen line) and 1.2975 (top) marking initial pivotal points.
Break of either side is needed to generate initial direction signal.
At the upside, psychological 1.3000 and daily Kijun-sen at 1.3020, mark next triggers for stronger correction of 1.3268/1.2773 descend.
Conversely, firm break below daily cloud would risk extension towards next key support at 1.2773 (24 Aug trough).
Res: 1.2946; 1.2975; 1.3000; 1.3020
Sup: 1.2905; 1.2873; 1.2852; 1.2793
USD Takes A Breather Ahead Of NFPs
US jobs report in focus
Personal spending and income came in roughly in line with expectations, though the former printed slightly lower, suggesting that personal consumption should continue to improve in the third quarter. Moreover, June’s personal spending was revised to the upside from a flat reading to +0.2%m/m. However, investors should remain cautious regarding the outlook as Hurricane Harvey will surely weigh on those measures in the coming months.
On the inflation front, the Fed’s favourite gauge of inflation matched expectation with the core personal consumption expenditure printing at 1.4%y/y in July, down from 1.5% in the previous month. This lacklustre inflation data if of bad omen for the Fed monetary policy normalization process. However, the economy has recently gather momentum and it should translate into a pick-up in consumer prices at some point.
The August’s jobs report, which is due for release later today, will be key to restore confidence in the inflation outlook. Indeed, a strong read in average hourly earnings will likely please investors as it should, at some point, help to lift inflation as US workers have more disposable income. Wages are expected to rise 2.6%y/y in August, up from 2.5% in the previous month. After printing at 209k in July, NFPs are anticipated to come in at 180k. We remain cautious regarding August data in general as it has proved to be subject to significant statistical distortions. Therefore investors will most likely ignore NFPs to focus on wages data.
EUR/USD has bounced back in late European session yesterday after free falling as much as 2% over the last three days. With the ECB meeting taking place next week, investors are in a period expectancy as they try to determine whether Draghi will make one step back amid a strengthening single currency. We still anticipate that Draghi will under-deliver and Yellen announce the beginning of the balance sheet unwinding program.
Short CHF on risk appetite
The swing in USDCHF this week has been stomach turning. The North Korean missile test reintroduced geopolitical tensions forcing FX markets to rotate back into traditional safe-haven currencies against the USD (EURCHF was basic unmoved due to the nature of the conflict). Yet, investors’ concern was short-lived prompting a sharp reversal. While our conviction in carry trades has moderated slightly (see Weekly Market Brief) in the near term, loose monetary policy conditions will support risk-taking. Capital inflows indicated that higher yielding assets especially in EM continued to benefit from the lower global risk premium. Highlighting the decline in risk aversion, the US 10-year yields have fallen into 2.12% challenging June 17 lows. In regards to the CHF, the SNB remains on the defensive despite the franc rapid depreciation against the Euro.
The SNB balance sheet continues to expand to offset CHF strength and member that indicate that a 20% proportional investment into equities. Elsewhere, the ability of create capital and buy “real” equities (all the while negative interest rate push investors out of cash into stocks) has generated investors demand for the Swiss National Bank stock (SNBN). The stock has now to climb safely above the chf3000 handle. The solid proposition of a risk-taking environment and a central bank focused on debasing their currency makes CHF the ideal carry funding currency. With demand for EM FX high CHF should stay weak.
Technical Outlook: EURUSD – Falling Hourly Cloud Continues To Cap, US Jobs Data In Focus
The Euro stands at the back foot on Friday awaiting release of today's key event – US jobs data. Near-term action remains limited at the upside and capped by falling thick hourly cloud (cloud base is currently at 1.1901). Fresh easing is pressuring daily Kijun-sen support (1.1866), break of which would extend weakness towards strong supports at 1.1822/18 (Thursday's low / Fibo 61.8% of 1.1662/1.2070 upleg/20SMA). Overall bullish structure is still intact as daily MA's remain in full bullish setup and Thursday's strong downside rejection suggested that pullback from 1.2070 peak might be running out of steam. US NFP data are expected to be the key driver today. Growth of US jobs likely slowed in August, according to the forecast for 180K new jobs created last month, compared to increase of 209K and 231K in previous two months. However, forecasted numbers are solid and near monthly average for the year at 184K and release around the forecast would be supportive for Fed to signal the start of reducing its massive portfolio. In addition, release of US ADP private sector jobs data on Wednesday which is usually used as an indication for NFP, showed strong rise in August, jumping to 237K and heavily beating forecast at 183K. On the other side, average hourly earnings are forecasted to rise by 0.2% in August after advancing 0.3% in July and weak numbers in August may sour the overall picture. US unemployment rate is expected to stay unchanged at 4.3% in August. Scenario of better than expected NFP and Average Earning numbers would inflate the dollar and send the Euro below pivotal 1.1820 support, towards next strong point at 1.1662 (17 Aug trough) violation of which would risk stronger bearish acceleration towards 1.1500 zone. Conversely, weak jobs sector numbers in August would boost the single currency for renewed attempt above psychological 1.2000 barrier and retest of Tuesday's spike high at 1.2070 (the highest since Dec 2014), break of which would signal continuation of broader uptrend and expose next target at 1.2166 (50% of 1.3992/1.0340 descend.
Res: 1.1901, 1.1922, 1.1984, 1.2000
Sup: 1.1866, 1.1820, 1.1800, 1.1740
Foreign Exchange Market Commentary: EUR/USD, USD/JPY, GBP/USD, GOLD, WTI CRUDE, DJIA, FTSE100, DAX
EUR/USD
The American dollar ended the day lower against its major rivals after starting the day with a positive tone, amid an extension of the positive market mood seen on Wednesday. The greenback gain modestly in quiet Asian trading and extended its advance early Europe, helped by a headline coming from Reuters, stating that ECB policymakers were concerned by the strength of the EUR, and may then delay the beginning of the end of QE. The EUR/USD pair fell down to 1.1822, its lowest for the week, although the dollar lost market's favor after Wall Street's opening, despite another batch of mixed data coming from the US. US weekly unemployment claims, for the week ended August 26th resulted at 236K, better than the 237K expected, but above a previously revised 235K, while the Chicago PMI remained in August at 58.9, above the 58.5 expected. Consumer spending rose less than expected in July, up by 0.3%, but the most relevant core PCE index advanced at 1.4% YoY, below the 1.5% gain in June, the smallest annual increase in over a year and a half. Hitting the greenback and pushing the EUR/USD pair up to 1.1907, were US pending home sales, falling by 0.8% in July and when compared to a year earlier.
All eyes are now on the upcoming US NFP report to define whether the greenback can extend its latest gains heading into the weekend. The US economy is expected to have added around 180K new jobs in August, while the unemployment rate is seen unchanged at 4.3%. Average hourly earnings are expected to post a modest advance yearly basis to 2.6% from 2.5% previously.
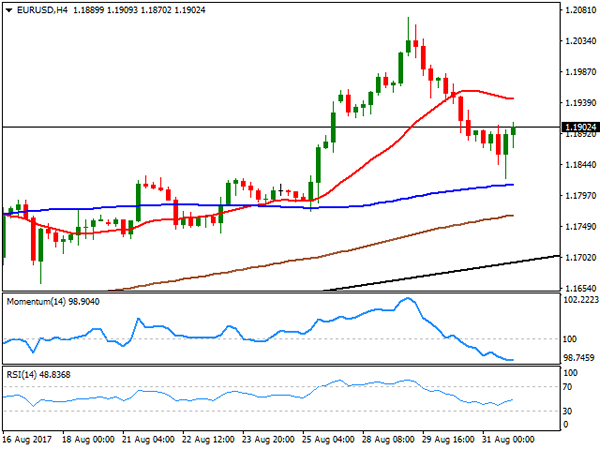
The short term technical picture is still bearish for the pair, as in the 4 hours chart, the price remains below a bearish 20 SMA, currently around 1.1945, while the Momentum indicator keeps heading south near oversold readings, as the RSI indicator consolidates around 45. Below the daily low, the pair has a stronger support in the 1.1780/90 region that if its broken, would result in a stepper decline down towards the 1.1700 level, where the pair has a daily ascendant trend line coming from early April low of 1.0603. To the upside, the level to watch is 1.1920, as an upward extension beyond it should result in a bullish extension that can reach up to 1.2000.
Support levels: 1.1880 1.1820 1.1785
Resistance levels: 1.1920 1.1965 1.2000
USD/JPY
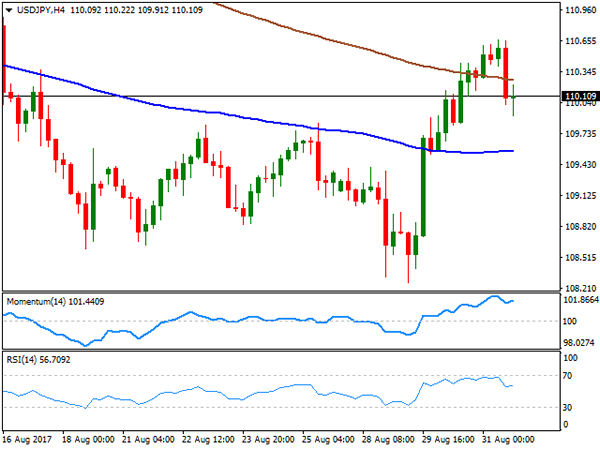
The USD/JPY pair trimmed all of its early gains to end the day in the red around 110.10, down from a fresh weekly high of 110.66. The positive tone in worldwide equities maintained the pair in the green at the beginning of the day, but fell back on not so encouraging US inflation and housing data, as Core PCE inflation advanced at its slowest pace since December 2015 this past July, up by 1.4% yearly basis, and by 0.1% in the month, while Pending Home sales fell by 0.8%, down for the fourth time in five months. During the upcoming Asian session, Japan will release its Nikkei manufacturing PMI, expected unchanged at 52.8 and August consumer confidence, forecasted at 43.5 from previous 43.8. The short term picture is still marginally positive for the pair, as technical indicators pared losses and are currently aiming to regain the upside, with the Momentum within overbought levels and the RSI around 56. In the same chart, the price holds above its 100 SMA, but failed to hold above a bearish 200 SMA, now the immediate resistance around 110.25. An upward acceleration above this last should favor a retest of the mentioned high, but it will take a break above 110.94, August 16th high, to confirm a steeper recovery in the days to come.
Support levels: 109.80 109.35 108.80
Resistance levels: 110.25 110.60 110.95
GBP/USD
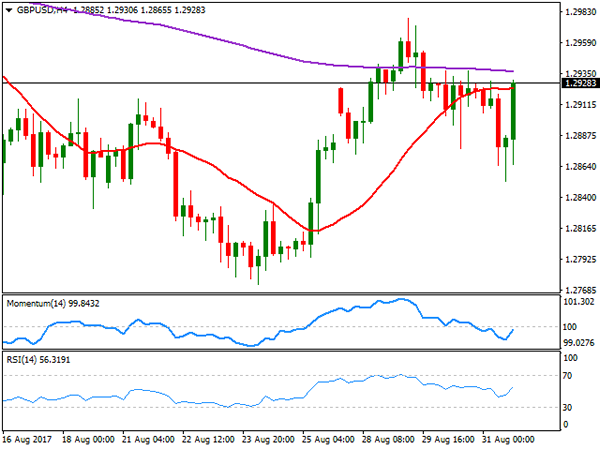
The GBP/USD pair is ending the day pretty much unchanged for a third consecutive day, buy above the 1.2900 level after establishing a fresh weekly low of 1.2852 early US session. The lack of news coming from the UK this week, however, has kept the pair within a limited range, but on Friday, the August Markit manufacturing PMI for the UK will bring some hints on the health of the UK, expected at 55.0 from previous 55.1. With no progress between the EU and the UK Brexit negotiations, hopes of a softer Brexit will re-surge, but seems that just be enough to keep the Pound afloat. The pair keeps posting lower lows daily basis, which favors a new leg lower for this Friday. The upcoming US employment report may result in the pair falling down to 1.2773, August 24th low in the case of an upbeat surprise, mostly considering that intraday technical readings keep favoring the downside, as in the 4 hours chart, technical indicators remain within negative territory, although losing their bearish strength, whilst the price is below its 20 SMA that remains flat around 1.2920 a major static resistance. Selling interest is still strong around the current 1.2920/30 region, although steady gains beyond the level should result in a test of the 1.2965 region, en route to 13000
Support levels: 1.2875 1.2830 1.2795
Resistance levels: 1.2965 1.3000 1.3045
GOLD
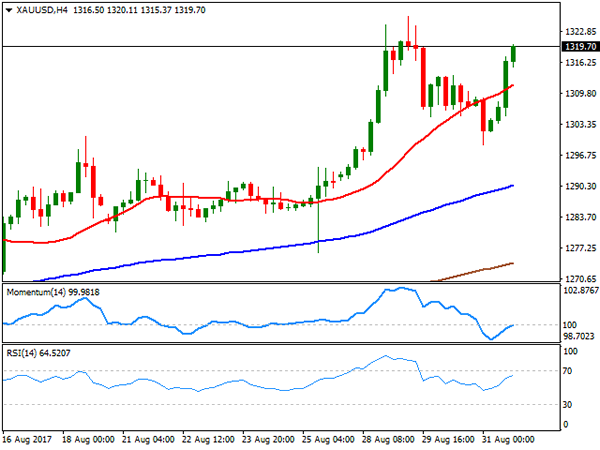
Spot gold regained the upside after US inflation failed to impress, trimming all of its previous two days' losses to settle a few cents below the $1,320.00 level. The US core PCE inflation, Fed's favorite inflation gauge remained unchanged yearly basis at 1.4% in July, well below the Central Bank's target of 2.0%. The commodity is ending August roughly 4% higher, and at its highest since November 2016, when it run briefly up to 1,337.35, on the back of Trump's victory in the US Presidential election. The US inflation figure released today reaffirms the case for a delay in US rate hikes, underpinning the metal. From a technical point of view, the daily chart shows tat technical indicators resumed their advance with the Momentum heading strongly up at fresh August highs, whilst the 20 DMA accelerated north far below the current level, all of which supports further gains for this Friday, particularly if US employment report disappoints. In the shorter term, the technical outlook is also positive, as the 4 hours chart for the commodity shows that it quickly recovered above a bullish 20 SMA, while technical indicators entered positive territory, but quickly lost upward strength, with the Momentum now in neutral territory. An extension beyond 1,325.94, this month high, will confirm the bullish continuation for this last day of the week.
Support levels: 1,333.60 1,304.95 1,296.75
Resistance levels: 1,325.94 1,333.10 1,337.35
WTI CRUDE OIL
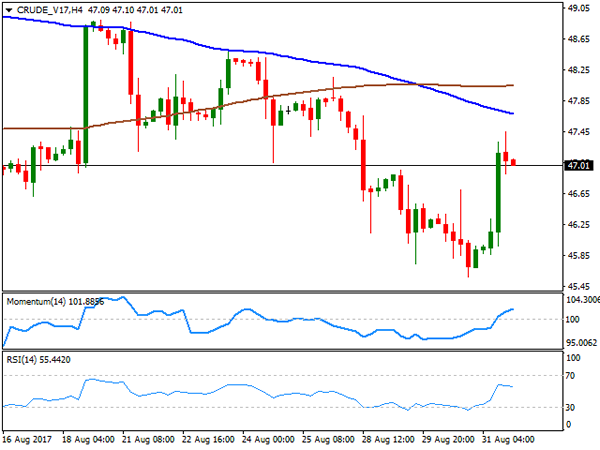
Crude oil prices changed course this Thursday, surging to their highest in three days, backed by news indicating that the US Department of Energy approved a crude loan to Phillips 66's Westlake refinery in Lake Charles, Louisiana, to balance Hurricane Harvey's supply disruptions. A total of 1 million barrels will be sent to the refinery during the next few days. Adding to the bullish case of the commodity, were news indicating that OPEC oil output fell in August by 170,000 barrels per day, from a 2017 high, help by Libya's output disruptions. West Texas Intermediate crude futures ended the day a few cents above $47.00 a barrel, and the daily chart shows that the intraday advance stalled right below the 100 DMA, at 47.25, while technical indicators have turned higher but remain in negative territory, all of which limits chances of further gains as long as the price remains below the mentioned resistance. In the 4 hours chart, the price remains below its 100 and 200 SMAs, while technical indicators entered positive territory, but the RSI lost upward momentum and is turning lower around 56, also indicating a limited upward potential at the time being.
Support levels: 46.60 45.90 45.50
Resistance levels: 47.25 47.70 48.40
DJIA
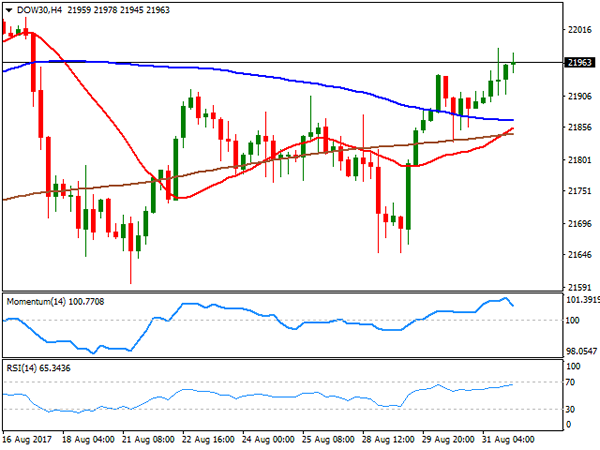
US equities ended the day and the month higher, with the Dow Jones Industrial Average adding 60 points on the day, to end at 21,952.35, and up for around 0.3% in the month. The Nasdaq Composite settled at 6,428.66 a new record high, adding this Thursday 60 points and 1.3% higher for August. Finally, the S&P settled at 2,471.65, up 14 points for the day, and by 0.1% for the month. El du Pont was the best performer among the Dow, backed by a rally in oil prices, adding 1.63%, followed by United Health Group, which gained 1.54%. Wall Disney led decliners, closing the day 1.63% lower, followed by Wall-Mart Stores that shed 0.60%. The index is up for a fifth consecutive month, but marginally, and saved at the last minute by hopes the US tax reform will come sooner than later. From a technical point of view, and according to the daily chart, the index seems poised to extend its advance, as it advanced further above its 20 SMA, while the RSI indicator aims higher around 57. The Momentum, however, struggles below its mid-line, failing to confirm further gains ahead. Shorter term, and according to the 4 hours chart, the index extended its advance above all of its moving averages, with the shorter one, the 20 SMA aiming to advance above the larger ones, a sign of bullish continuation, and whit technical indicators holding near overbought readings, also in line with additional advances.
Support levels: 21,940 21,900 21,863
Resistance levels: 21,986 22,007 22,048
FTSE100
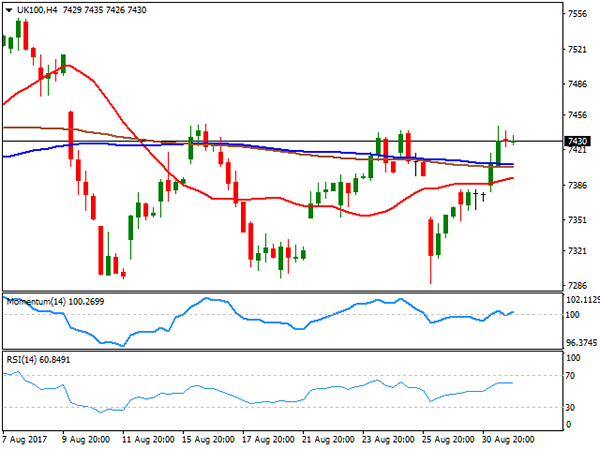
The FTSE 100 ended the day at 7,430.62, up by 66 points as Chinese strong PMIs boosted the mining sector. The index logged a monthly 0.8% gain helped additional by Pound's weakness. The official Chinese manufacturing PMI rose to 51.7 in August from the previous month’s 51.4, indicating a pickup in the sector, and anticipating increasing demand for base metals. Mediclinic International added 2.89%, leading advancers, followed by Anglo American that gained 2.82%. Losers were led by G4S that shed 2.01%, followed by Provident Financial that lost 1.01%. The technical picture is now more constructive, as in the daily chart, the index settled above all its 20 and 100 moving averages, while technical indicators entered positive territory, maintaining their bullish slopes and supporting additional advances for this Friday. In the shorter term, and according to the 4 hours chart, the index surpassed all of its moving averages, but technical indicators stand directionless within positive territory, as the index was unable to surpass the strong resistance around 7,444, a level that capped advances since early August.
Support levels: 7,395 7,348 7,313
Resistance levels: 7,444 7,480 7,523
DAX
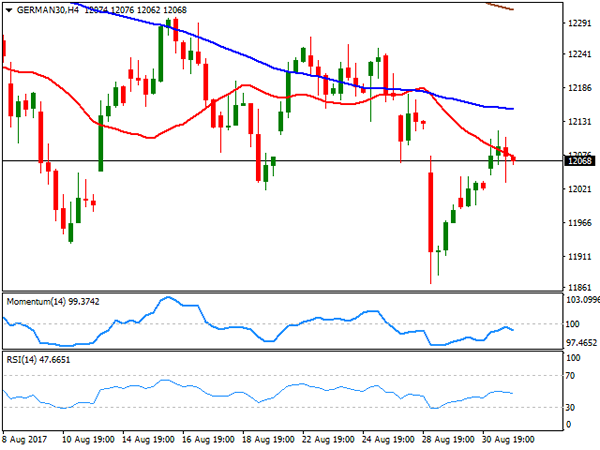
European equities extended their recovery this Thursday, with the German DAX ending the day at 12,055.84, up in the day for 53 points. Strong EU inflation figures underpinned investors' mood, advancing 1.5% when compared to August 2016, and with the core reading up by 1.3%, matching July's figure, but above market's expectations of 1.2%. Within the German index, Deutsche Lufthansa was the best performer, adding 3.05%, followed by Heidelberg Cement that added 2.35%. The worst performer on the other hand was Continental, down 1.25%, followed by Daimler that shed 0.63%. The daily chart for the benchmark indicates that it recovered above its 200 DMA, but it´s still far below the shorter ones, while the Momentum indicator is flat around its 100 level, while the RSI aims higher, but around 43, limiting the upward potential, at least as long as it holds below 12,142, where the index has its 20 DMA. In the 4 hours chart, the index was unable to settle above a bearish 20 SMA, whilst technical indicator retreat from around their mid-lines, indicating that the short-term risk is towards the downside.
Support levels: 12,033 11,995 11,969
Resistance levels: 12,105 12,142 12,197
US NFP Likely To Fail Dollar Bulls |Gold To Touch 1370 And Euro 1.25
Markets to act like a zoombie ahead of the US NFP data
Euro could pop well above the 1.20 mark against the dollar
Dollar bulls are keeping their hopes up especially after a stellar revision of the Q2 US GDP
European market and US futures are trading higher ahead of the most watch economic data on the face of the earth. The markets tends to act like a zombie before the US NFP data is released. Today is not going to be any different either, unless of course, we see some sort of surprise in terms of geopolitical tensions.
What traders have priced in very much in the market is that the Fed is going to struggle with respect to any further rate hike for this year. However, the dollar bulls are keeping their hopes up especially after a stellar revision of the Q2 US GDP. It came well ahead of the expectations and ignited the rally in the dollar index. But the question was for how long this rally would last and if it has any legs to stand on?
One of the forward looking indicator is your US pending home sales data and the number released on Thursday wasn’t encouraging at all. It broke the dollar bulls back. What it tells you that the affordability ratio is falling due to the hike in the interest rate and wages are stagnant. In other words, we are highly likely to consolidate. We will not be surprised if the index does not start to roll over. The personal income data in the US does show that the number has improved (0.4%) relative to the last month however, consumers are not spending. The personal spending number (0.3%) was shy off expectations (0.4%).
The Fed is confident about the labour market more than their inflation target of 2%. However, the recent catastrophe caused by Hurricane Harvey is going to create more headwinds for the labour market. The upcoming unemployment claims number is going to rise. If we look at a similar situation; Hurricane Katrina, it becomes evidently clear the unemployment claims tends to rise in the following weeks.
What about gold and for Euro
The ECB is concerned about the euro strength and this took some of the steam out of the euro-dollar pair. However, the US NFP number has ability to provide a massive tailwind for this pair. The euro-dollar pair could start its net mile stone journey towards the 1.25 is the number disappoints investors tomorrow. Even if the US NFP number matches the forecast it would still be translated as a dovish signal for the Fed and negative influence for the dollar. Both the US payroll number and wage growth have to pull their weight. In other words, the bar is set high for the dollar index to beat expectation.
August has been a phenomenal month for gold price. We do think that good days are still ahead for the shining yellow metal. Why? We still have the issues of US debt ceiling, nothing on the tax reform, no announcement on the stimulus package and the geopolitical tensions are becoming worse. Basically, there are several pillars which could potentially continue to support gold price. We do think that it is highly likely that if we stay above the $1300 , gold price could easily touch $1370 this month.
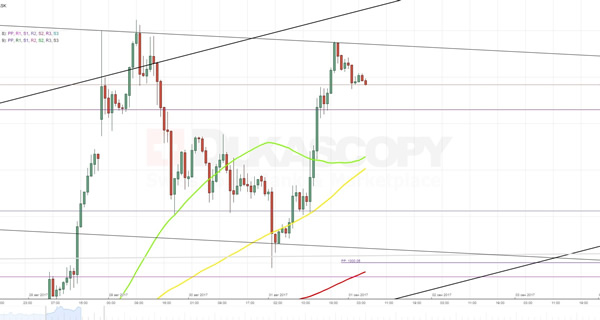
XAUUSD Analysis: Surges To 1,323.00
As soon as the buck stopped to receive feeding from various macroeconomic data releases, the yellow metal started to actively recover. In result of the yesterday's surge, the pair has entered into a junior descending channel. Accordingly, today it is expected to move downwards, successfully breaking through the weekly R3 at 1,316.51. Nevertheless, the fall is not expected to last for long due to presence of a combined support level set up by the 55- and 100-hour SMAs. On the other hand, there is a need to take into account an effect from release of another fundamental data later this day. If it fails to justify expectations, the weakening buck might push the pair out of the channel in the northern direction.