
Sample Category Title
Daily Technical Analysis: EUR/USD, GBP/USD Approaching Confirmation Or Invalidation Zone Of Wave-4
Currency pair EUR/USD
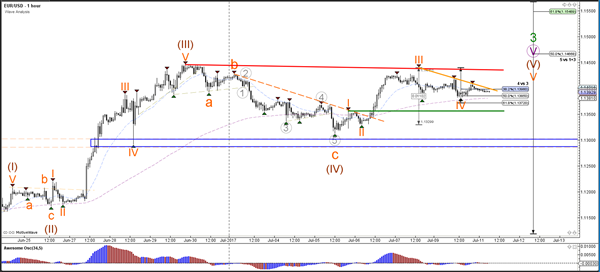
The EUR/USD is moving sideways after failing to break above the previous top (red). A bullish breakout could however restart the uptrend towards the Fibonacci targets of wave 5 vs 1+3 and the round level of 1.15.
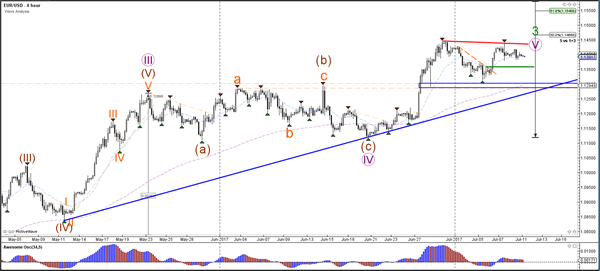
The EUR/USD expanded the wave 4 (orange) correction back to the 50% Fibonacci level. The wave 4 (orange) becomes unlikely if price breaks below the 61.8% Fibonacci level.
Currency pair USD/JPY
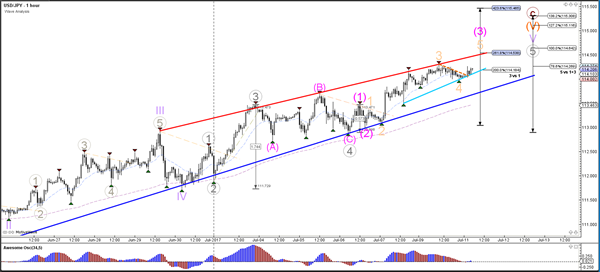
The USD/JPY is moving higher in a neat bullish trend channel towards the Fibonacci targets of wave 5 vs 1+3. Price could extend the uptrend towards the Fibonacci levels of wave X vs W.
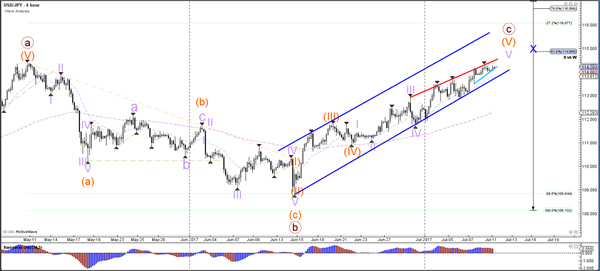
The USD/JPY retraced back to a support trend line (blue) within a wave 4 (light orange) correction within wave 3 (pink). Price could now be in a wave 5 moving towards the Fib targets at 114.50 and 115.
Currency pair GBP/USD
The GBP/USD retraced to deeper Fibonacci support levels of wave 4 vs 3 (orange). A bullish bounce could confirm the wave 4-5 (orange).
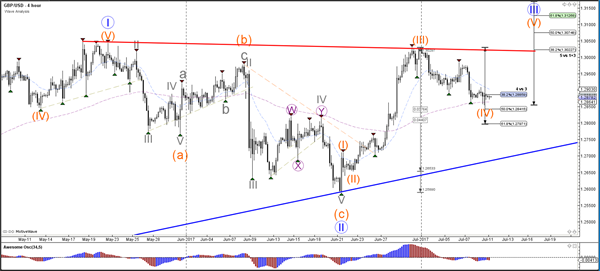
The GBP/USD seems to have completed an C (grey) bearish zigzag within wave 4 (orange). A break below the 61.8% makes a wave 4 structure less likely.
Daily Technical Outlook And Review: EUR/USD, GBP/USD, AUD/USD, USD/JPY, USD/CAD, USD/CHF, DOW 30, GOLD
A note on lower timeframe confirming price action...
Waiting for lower timeframe confirmation is our main tool to confirm strength within higher timeframe zones, and has really been the key to our trading success. It takes a little time to understand the subtle nuances, however, as each trade is never the same, but once you master the rhythm so to speak, you will be saved from countless unnecessary losing trades. The following is a list of what we look for:
- A break/retest of supply or demand dependent on which way you're trading.
- A trendline break/retest.
- Buying/selling tails ... essentially we look for a cluster of very obvious spikes off of lower timeframe support and resistance levels within the higher timeframe zone.
- Candlestick patterns. We tend to only stick with pin bars and engulfing bars as these have proven to be the most effective.
We typically search for lower-timeframe confirmation between the M15 and H1 timeframes, since most of our higher-timeframe areas begin with the H4. Stops are usually placed 1-3 pips beyond confirming structures.
EUR/USD
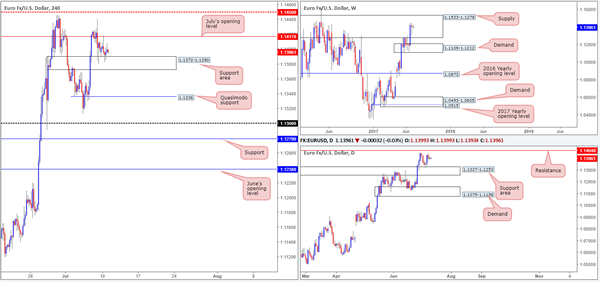
The EUR/USD took on more of a sober tone during Monday's sessions, ranging between July's opening level at 1.1417 and a H4 support area based at 1.1372-1.1390. Should the unit violate 1.1417 today, the next hurdle in the firing range is likely to be the H4 mid-level resistance 1.1450. A break below the current H4 support area on the other hand would likely open the gates down to the H4 Quasimodo support at 1.1336.
Moving over to the bigger picture, weekly flow remains loitering within the walls of a major supply zone drawn from 1.1533-1.1278 that has capped upside since May 2015. On the daily timeframe, however, we currently see a resistance level pegged at 1.1464 and a daily support area coming in at 1.1327-1.1253.
With weekly candles trading within such a respected supply zone at the moment, a break below the current H4 support base would not surprise us. This, according to both the daily and H4 timeframes, could open up a small gap south for a potential trade as beyond the H4 support area we have the aforementioned Quasimodo support to target, followed closely by the top edge of the daily support area at 1.1327 and then the 1.13 handle.
Our suggestions: Watch for a decisive break below the H4 support area at 1.1372-1.1390 and then look to trade any retest seen thereafter. Ideally, we would like to see a reasonably sized H4 bearish candle take shape (preferably a full-bodied candle) following the retest, as this will, in our opinion, suggest seller intent.
Data points to consider: FOMC member Brainard speaks at 5.30pm GMT+1.
Levels to watch/live orders:
- Buys: Flat (stop loss: N/A).
- Sells: Watch for H4 price to engulf 1.1372-1.1390 and then look to trade any retest seen thereafter ([waiting for a H4 bear candle – preferably a full, or near full-bodied candle – to form following the retest is advised] stop loss: ideally beyond the candle's wick).
GBP/USD
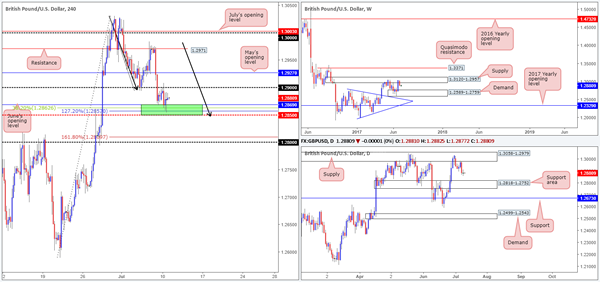
Coming at you from the top this morning, weekly supply at 1.3120-1.2957, as you can see, is currently holding this market lower. In the event that this continues, the next downside target can be seen at a demand base drawn from 1.2589-1.2759. Sliding down to the daily timeframe, we can see that supply at 1.3058-1.2979 (positioned within the weekly supply area) held price lower last week which could eventually send the unit down to a support area chiseled in at 1.2818-1.2752.
Despite both the weekly and daily timeframes suggesting further downside may be upon us this week, the H4 is currently seen trading from a rather interesting area of support marked in green at 1.2850-1.2869. The zone is comprised of June's opening level at 1.2869, a 38.2% Fib support level at 1.2862, a AB=CD 127.2% ext. at 1.2857 and a mid-level support line at 1.2850.
Our suggestions: While the H4 confluence surrounding 1.2850-1.2869 is tempting to buy, there's just too much higher-timeframe structure positioned against this area for us to justify a trade, unfortunately. In addition to this, we do not like how the 1.29 handle held so well on Monday – just look at the strength of the bears upon connecting with this psychological level!
With the above points in mind, our attention is drawn to the 1.28 handle seen below, which happens to converge with the 161.8% ext. point at 1.2809 (from the AB=CD pattern mentioned above) and is lodged within the said daily support area!
Data points to consider: MPC Member Broadbent speaks at 12.00pm. FOMC member Brainard speaks at 5.30pm GMT+1.
Levels to watch/live orders:
- Buys: Currently watching the 1.28 neighborhood for a potential long opportunity. To trade from here we would highly recommend waiting for at least a H4 bullish candle to form, preferably a full-bodied candle, before pulling the trigger.
- Sells: Flat (stop loss: N/A).
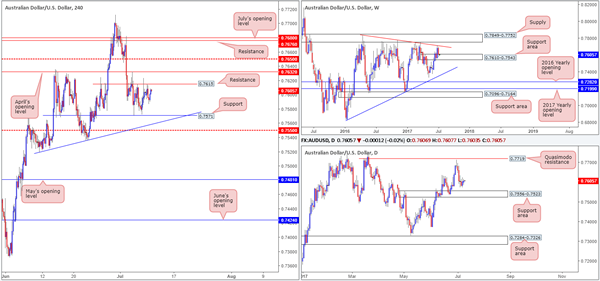
AUD/USD
Over the last week or so, the H4 candles have been chiseling out a consolidation between resistance at 0.7615 and support located at 0.7571. According to the weekly timeframe, the commodity currency could be heading higher sometime soon given that weekly price recently connected with a support area carved from 0.7610-0.7543. There are, however, two cautionary points to bear in mind regarding this theory. Firstly, the daily chart shows space for price to continue pushing lower until we reach the support area formed at 0.7556-0.7523, which happens to be glued around the lower edge of the current weekly support area. Secondly, even if weekly price does force the pair north, we have a multiple H4 resistances planted beyond the current H4 resistance, thus making it a difficult buy!
Our suggestions: With the above points in mind, the only level of interest that we believe deserves attention is the H4 mid-level support at 0.7550. Not only does it converge with a H4 trendline support etched from the low 0.7519, it is also located within both of the above said weekly and daily support areas.
Should we spot H4 bulls coming into the picture from the 0.7550 vicinity today in the shape of a (preferably) full-bodied bull candle, we would have no hesitation in buying this market, with the hope that price breaks back into the current H4 range.
Data points to consider: FOMC member Brainard speaks at 5.30pm GMT+1.
Levels to watch/live orders:
- Buys: 0.7550 region ([waiting for a H4 bull candle – preferably a full, or near full-bodied candle – to form is advised] stop loss: ideally beyond the candle's tail).
- Sells: Flat (stop loss: N/A).
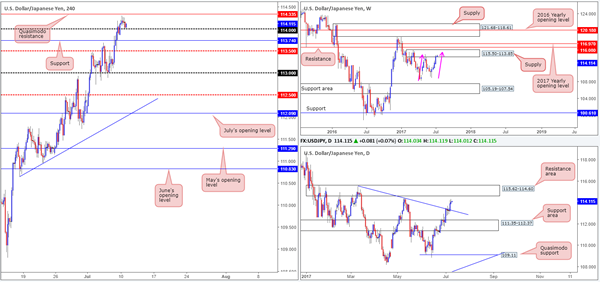
USD/JPY
Although USD/JPY bulls look incredibly strong at the moment, there may be trouble lurking ahead! Weekly price recently entered supply coming in at 115.50-113.85. Assuming that price continues to push higher, nevertheless, it could also form a possible AB=CD correction completing around 115 (see pink arrows). The story on the daily timeframe shows price also trading within striking distance of a resistance area at 115.62-114.60, which happens to be positioned nearby the aforementioned weekly AB=CD completion point!
Meanwhile, over on the H4 timeframe, the 114 handle is currently offering the market a level of support. With the next upside target coming in at 114.35 (Quasimodo resistance), however, the bulls may struggle from here.
Our suggestions: On account of the above, our desk is firmly biased to the downside right now. Nevertheless, we will wait for daily price to at least shake hands with the aforementioned resistance area before looking to sell this market, as ideally we want to short the 115 handle and place stops just above the daily zone at 115.64, thus clearing both the daily resistance area and the current weekly supply.
Data points to consider: FOMC member Brainard speaks at 5.30pm GMT+1.
Levels to watch/live orders:
- Buys: Flat (stop loss: N/A).
- Sells: Currently have our eye on the 115 neighborhood for shorts.
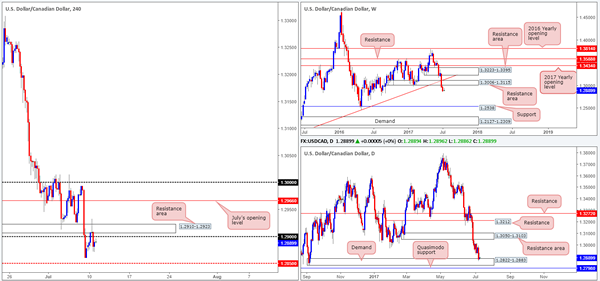
USD/CAD
From the weekly timeframe, the USD/CAD appears to reflect an incredibly bearish market at present. After breaching the support area at 1.3006-1.3115, which is now a resistance area, the unit shows space to trade all the way down to support coming in at 1.2538. Interestingly though, on the daily timeframe we see the candles challenging a demand base pegged at 1.2822-1.2883. Also noteworthy is yesterday's inverted pin-bar candle, which according to conventional wisdom, is considered a buy signal.
Across on the H4 timeframe, however, the resistance area at 1.2910-1.2923 held firm during yesterday's segment, forcing the candles to trade back below the 1.29 handle. Should the bears remain on the offensive here, we could see the loonie attack the mid-level support at 1.2850.
Our suggestions: In essence, what we have here is the weekly timeframe telling us that the sellers show potential, while conversely, the daily timeframe shows that the bulls may make an appearance this week as well as the H4 candles trading bearishly below a psychological band. Personally speaking, this market is not something we would look to trade, especially with the higher-timeframe conflicting signals being seen.
Data points to consider: FOMC member Brainard speaks at 5.30pm. Canadian Housing starts at 1.15pm GMT+1.
Levels to watch/live orders:
- Buys: Flat (Stop loss: N/A).
- Sells: Flat (Stop loss: N/A).
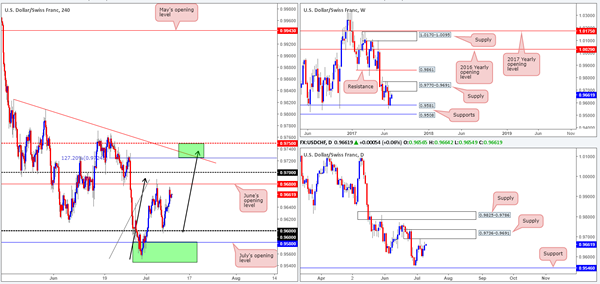
USD/CHF
In recent trading, we've seen the H4 candles begin completing a D-leg to an AB=CD formation that finalizes around the 0.9720ish range. Also of particular interest is the converging trendline resistance extended from the high 0.9825 and a mid-level resistance at 0.9750 (upper green area).
What's also notable from a technical perspective is that the upper green H4 zone is positioned within the upper limits of a weekly supply zone seen at 0.9770-0.9691. However, in order to reach the H4 area, the pair would need to breach daily supply at 0.9736-0.9691, which is located around the lower edge of the said weekly supply.
Our suggestions: The desk has come to a general consensus that waiting to see if H4 price can strike the upper green zone before we look to sell is the better path to take. Apart from benefitting from the H4 and weekly confluence, this would also allow traders to place stops ABOVE the weekly supply at 0.9772.
Data points to consider: FOMC member Brainard speaks at 5.30pm GMT+1.
Levels to watch/live orders:
- Buys: Flat (stop loss: N/A).
- Sells: 0.9750/0.9720 (stop loss: 0.9772).
DOW 30
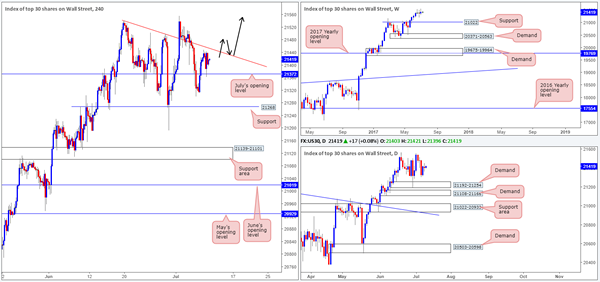
Despite the H4 candles grinding lower at the moment, the US equity market remains trading with a strong upside bias. On the weekly timeframe, there's little stopping the unit from pushing higher. Should the index pullback, however, the support level at 21022 will likely offer a floor to trade from considering that it had a relatively sound history as a resistance.
Ultimately, we're looking for July's opening level at 21372 to continue providing support, and eventually force the candles above the nearby H4 trendline resistance extended from the high 21541. This, for us, would be a cue to begin looking to buy this market.
Our suggestions: Following a decisive close above the current H4 trendline resistance, the desk will be watching for the piece to retest this line as support and print a reasonably sized H4 bull candle, preferably a full, or near full-bodied candle, before looking to pull the trigger (as per the black arrows).
Data points to consider: FOMC member Brainard speaks at 5.30pm GMT+1.
Levels to watch/live orders:
- Buys: Watch for H4 price to close above the current trendline resistance and then look to trade any retest seen thereafter ([waiting for a H4 bull candle – preferably a full, or near full-bodied candle – to form following the retest is advised] stop loss: ideally beyond the candle's tail).
- Sells: Flat (stop loss: N/A).
GOLD
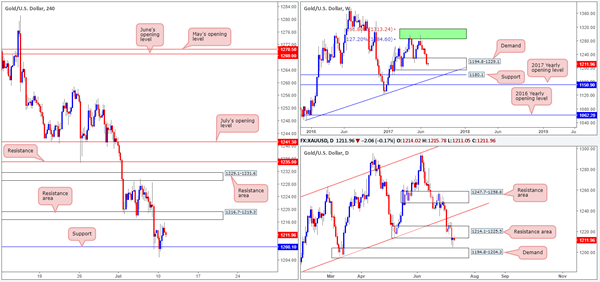
Kicking this morning's report off with a look at the weekly timeframe, we can clearly see the buyers and sellers battling for position within a demand zone at 1194.8-1229.1. This demand has held price higher once already back in early May, so there's a solid chance that history may repeat itself here. Punching down to the daily timeframe, Monday's action came within a cat's whisker of connecting with a demand base at 1194.8-1204.3 and printed a nice-looking buying tail. Although this is considered a buy signal by many, the yellow metal is also touching base with the underside of a resistance area at 1214.1-1225.5 as well.
H4 support at 1208.1 remains in a stable state right now and could eventually force the unit to challenge the H4 resistance area at 1216.7-1219.3. Given this, and the above notes, there is clearly conflicting signals evident in this market. Buying from the weekly demand not only places traders up against the current daily resistance area, but also the H4 resistance area seen within, as well.
Our suggestions: Before our team becomes buyers in this market, we would require a decisive H4 close above the said H4 resistance area. That way, we can be somewhat confident that the daily resistance area is weakened and the H4 candles will likely reach the H4 resistance area at 1229.1-1231.6, followed closely by H4 resistance at 1235.0.
Levels to watch/live orders:
- Buys: Watch for H4 price to close above 1216.7-1219.3 and then look to trade any retest of this area seen thereafter ([waiting for a H4 bull candle – preferably a full, or near full-bodied candle – to form following the retest is advised] stop loss: ideally beyond the candle's tail).
- Sells: Flat (stop loss: N/A).
European Open Briefing: Most Major Pairs Consolidated Overnight
Global Markets:
- Asian stock markets: Nikkei up 0.40 %, Shanghai Composite gained 0.90 %, Hang Seng rose 1 %, ASX 200 lost 0.10 %
- Commodities: Gold at $1211 (-0.10%), Silver at $15.57 (-0.40%), WTI Oil at $44.50 (0.45%), Brent Oil at $47.10 (0.45%)
- Rates: US 10 year yield at 2.38, UK 10 year yield at 1.28, German 10 year yield at 0.54
News & Data:
- Australia NAB Business Confidence Jun: 9 (Rev Prev 8)
- Australia NAB Business Conditions Jun: 12 (Rev Prev 11)
- Japan Money Stock M2 (Y/Y) Jun: 3.90% (Est 3.90%, Prev 3.90%)
- Japan Money Stock M3 (Y/Y) Jun: 3.30% (Est 3.40%, Prev 3.40%)
- PBoC Fixes USDCNY Reference Rate At 6.7983 (Prev 6.7964)
- Fed's Williams: His Own View Is To Start Adjustment Of Balance Sheet In Next Few Months
- Fed's Williams: Reasonable Vie To Expect One More Rate Hike This Year
Markets Update:
Most major pairs consolidated overnight, amid a lack of major data releases and events. USDJPY is struggling with resistance at 114.30. However, the outlook for the Yen is negative, so further gains seem likely in the near-term. The next notable resistance lies at 115, followed by 115.50.
The Euro continues to consolidate around 1.14. It has lost some momentum, but is not showing any signs of weakness yet. Key resistance is noted at 1.1450. A break above would signal a rally to at least 1.16. In the short-term, the outlook for the Euro remains positive both from a fundamental and technical perspective.
AUDUSD has recovered slightly, although resistance at 0.7630 has capped the topside so far. Should it break above it, the rally would likely extend to 0.77.
Markets should remain rather quiet today amid few important data releases. However, volatility will increase tomorrow. Especially in CAD pairs as the Bank of Canada is deciding on interest rates.
Upcoming Events:
- 09:00 BST – Italian Industrial Production
- 15:00 BST – US JOLTs Job Openings
Market Update – Asian Session: PBOC Returns To Open Market Operations, Kiwi Falls 0.5% To A 2-Week Low
Asia Summary
Hong Kong banks led the market higher with the PBoC resuming open market operations after 12 consecutive skips, this was speculated in the press ahead of the announcement given that the government and policy banks needed to sell at least CNY483B in bonds this week and a high chance companies would start to hoard cash ahead of tax payments later this month. According to Chinese press going forward OMO's are expected to remain more modest than prior to this latest hiatus.
NZD/USD fell to a two-week low of 0.7237, attributed to a technical move that then triggered stop losses. The A$ gained slightly on stronger business confidence and conditions for the month of June. However, Australian miners remained under pressure and next week will kick off with results from Rio Tinto, July 11th and then BHP on July 19th.
Key economic data
(AU) AUSTRALIA MAY HOME LOANS M/M: 1.0% V 1.5%E
(NZ) NEW ZEALAND JUN CARD SPENDING RETAIL M/M: 0.0% V 0.8%E; TOTAL M/M: 0.1% V -0.2% PRIOR
(UK) JUN BRC LFL SALES Y/Y: 1.2% V 0.8%E
(UK) UK June Barclays Card Consumer Spending Y/Y: 2.5% v 2.8% prior (15-month low)
(AU) AUSTRALIA JUN NAB BUSINESS CONFIDENCE: 9 V 8 PRIOR; CONDITIONS: 15 V 11 PRIOR
(CN) China Passenger Car Association (PCA): Jun vehicle sales +4.6% y/y; YTD sales -0.2% y/y
Speakers and Press
China
(CN) China may start to inject cash again through OMO due to Govt and policy banks need to sell at least CNY483B in bonds this week and companies may keep cash through July for tax payments - financial press
(CN) China Investment Corporation (CIC) reports 2016 net return on overseas investment 6.22% v -2.96% y/y
Japan
(JP) According to SMBC Nikko Securities analyst: BoJ is unlikely to be prompted into action by the rise in five-year yield unless it causes a spike in volatility or pushes 10-year yields higher
(JP) According to latest Asahi poll 61% feel that Japan PM Abe cannot be trusted
Australia/New Zealand
(NZ) New Zealand PM English: Government allocates NZ$1.0B to a housing infrastructure fund that will focus on 9 projects
US
(US) US President Trump may name Randal Quarles as the Fed's supervision vice chair later today - US press
(US) Fed's Williams (moderate, non-voter): US fiscal policy is on an unsustainable path; reasonable view to expect one more rate hike this year
Asian Equity Indices/Futures (00:30ET)
Nikkei +0.5%, Hang Seng 1.1%, Shanghai Composite -0.2%, ASX200 -0.1%, Kospi +0.3%
Equity Futures: S&P500 +0.1%; Nasdaq flat, Dax +0.2%, FTSE100 +0.1%
FX ranges/Commodities/Fixed Income (00:30ET)
EUR 1.1398-1.1391; JPY 114.26-114.03; AUD 0.7620-0.7603; NZD 0.7272-0.7230
Aug Gold -0.2% at 1,211/oz; Aug Crude Oil +0.4% at $44.58/brl; Sept Copper -0.2% at $2.65/lb
GLD SPDR Gold Trust ETF daily holdings fall 2.96 tonnes to 832.4 tonnes
(CN) PBOC SETS YUAN REFERENCE RATE AT 6.7983 V 6.7964 PRIOR
(CN) PBoC injects combined CNY40B in 7-day and 14-day reverse repos (1st injection in 12 sessions)
(TH) Thailand sells combined THB105B in 3-month, 6-month and 329-day bonds
(JP) Japan MoF sells ¥21.80T v ¥2.2T indicated in 0.10% 5-year JGB bonds; avg yield -0.0350% v -0.065% prior; bid-to-cover: 4.85x v 4.71x prior
Asia equities notable movers
Australia
Slater &Gordon, SGH.AU Reaches in-principle conditional agreement to settle Hall Proceeding; +12.2%
Japan
Suzuki Motor , 7269.JP Netherlands Vehicle Authority said to investigate possible misuse of vehicle emissions software – press; -3%
Hong Kong/China
Geely Automobile, 175.HK Positive profit alert: Guides H1 Net +100% v CNY1.91B y/y; Rev to substantially increase; +3.8%
Korea
005380.KR Hyundai and Kia said to discuss cutting China sales target - South Korean Press
US Session Highlights
(UK) PM May met with Australian PM Turnbull, as she vows to create closer ties, especially on trade. Over the weekend, May had met with Pres Trump, who promised a fast track to a free trade agreement. PM May, weakened after the unneeded early election, has been active in garnering support from third parties in terms of trade to strengthen her position with the EU. But after last week's reports that the EU and Japan were to agree to free trade terms, Japan has said that may not be the case, and in fact the UK may take their front seat on trade talks.
(US) US regulatory agency CFPB announced completion of a rule that would allow class action suits against banks. The rule would prevent banks and credit card companies from including class action bans in customer contracts. The new rules become effective in ~240 days, but under the Congressional Review Act, the GOP has 60 legislative days to block it.
US Treasuries managed to hold some ground today, as investors continued to sell fixed income but at a slower pace. 10-year yield dropped 1.3bps to 2.37%, and the 10s/30s yield curve widen, rising to 55.5bps, with 30-year bond yield only slightly lower at 2.93%.
US markets on close: Dow flat, S&P500 +0.1%, Nasdaq +0.4%
Best Sector in S&P500: IT
Worst Sector in S&P500: Real Estate
Biggest gainers: CF +6.6%; MOS +5.3%; FCX +5.2%
Biggest losers: M -7.1%; GPS -6.3%; BBY -6.3%
At the close: VIX 11.1 (-0.08pts); Treasuries: 2-yr 1.39% (-1.4%), 10-yr 2.37% (-0.8%), 30-yr 2.93% (-0.3%)
Cable Remains Flat Ahead Of Employment Data
Key Points:
- Strong support at 1.2849 likely to cap a further slide lower.
- Pair remains technically neutral.
- Keep a close watch on the U.S. CPI figures, due out during Friday's session.
The Cable experienced a relatively torrid week as the pair was initially beset by a negative UK Manufacturing PMI result of 54.3. In addition, the Construction PMI also proved disappointing, coming in fractionally lower at 54.8. Subsequently, the pair declined through most of the week to close around the 1.2885 mark. However, it's uncertain if the pair will retain its sideways direction in the week ahead. Subsequently, let's review the salient events from last week with a view to forming a directional bias for the coming days.
Last week proved highly negative for the Cable as the pair dealt with the release of some negative UK economic data points. In particular, the UK Manufacturing PMI result quickly turned negative, coming in well below estimates at 54.3, and commencing a slide in the GBPUSD. Additionally, the Construction PMI was also disappointing, slipping to 54.8, and adding to the selling pressure. Late in the week also saw a range of U.S. economic data released with the Non-Farm Payroll figures rising sharply to 222k. Subsequently, the pair saw some strong selling and closed the week out over 140 pips lower and around the 1.2885 mark.
Looking ahead, it could potentially be a relatively busy week for the Cable with the UK BRC Retail Sales and U.S. Core CPI figures due for release. The BRC Retail Sales figures are due for release early in the week and are forecast at 0.5% which represents a significant gain from the prior result of -0.4%. Subsequently, if the estimates are correct, expect the Cable to find some support from the positive result. In addition, the U.S. Core CPI figures are set for release and the forecast has them returning a 0.2% m/m result. However, there is mounting speculation that the U.S. economy could be suffering some headwinds presently. Subsequently, the inflation figures will be closely monitored by the market for signs of slowing. Finally, the Bank of England has a range of members, and their chief economist, due to speak in the coming week and may provide some illumination on when the central bank will choose to tighten.
From the technical perspective, the pair largely remained within a consolidation phase through most of last week. In addition, the RSI Oscillator remains within neutral territory and is presently trending sideways. Subsequently, our initial bias is neutral for the week ahead with the caveat to expect a gentle slide with strong support at 1.2849 capping any further downside moves. Support is currently in place for the pair at 1.2849, 1.2767, and 1.2706. Resistance exists on the upside at 1.3045, 1.3272, and 1.3441.
Ultimately, the coming few sessions are likely to focus heavily upon the U.S. Core CPI and UK employment change figures. However, given the recent lack of volatility, it might just take a significant event to alter the pair's present sideways direction. Subsequently, it is likely to be Friday's session, with the release of the US CPI data that sets the tone of the short term fundamental trend. So monitor the outcome closely because a miss of the estimate (0.2% m/m) could cause some significant upside moves for the pair.
Is Oil Ready To Rebound?
Key Points:
- A corrective ABC wave could carry oil higher moving forward.
- Despite any near-term bullishness, the long-term bias remains bearish.
- 48.55 level likely to be the next peak for oil prices.
Oil prices had a rather abrupt reversal last week, raising concerns that the declining channel was beginning to break down to some extent. However, this seems to be at odds with the broader technical bias which suggests that a rally back up to the 48.55 mark is still plausible. Indeed, oil is already showing early signs of a recovery – potentially a rather sizable one.
Nevertheless, on the face of things, oil's bias does look rather bearish and fears of continued losses may not be altogether unwarranted. What's more, in the long run, further losses are almost certain aswe aren't expecting the commodity to overcome the fundamental forces causing its long-term decline any time soon. However, the most recent push lower could very well be fleeting and a propertesting of the upside constraint of the channel is still a real possibility.
One of the key technical readings suggesting that recent losses are about to reverse is the MACD oscillator which, despite a nearly 6% fall in oil prices, continues to signal that bullish momentum is intact. When combined with the presence of some long shadows on the two prior candles, a reversal around the 44.30 handle is looking rather likely. Moreover, a reversal here would confirm the presence of a corrective ABC wave – a sign that the uptrend could resume very shortly.
If buying pressure does return, it should see oil back up to the top of the channel but no higher than the 48.55 handle. Indeed, any price action above the $47 mark is going to be up against some strong headwinds given the presence of the 100 day moving average and the prevailing pessimism over the future of oil prices. As a result of this, we should see yet another extended downtrend take hold eventually and this may reach as low as the $40 handle.
Ultimately, we may have to wait for the US Crude Oil Inventories data to be posted before oil prices really get moving again. Currently, a draw is expected which could be the spark needed to put the bulls back in the driving seat. Nevertheless, keep an eye on the release as an unexpected build could dash any hopes of a near-term rally and see oil plunge back to form a double bottom structure.
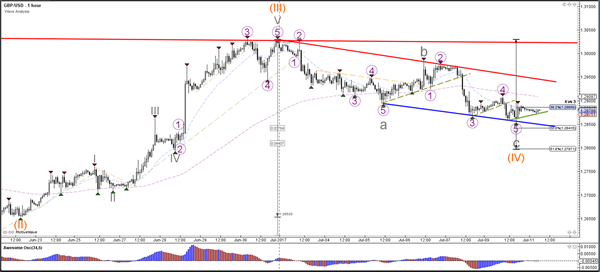
Elliott Wave View: USDJPY Bullish Against 112.86
Short term USDJPY Elliott Wave view suggests the pullback to 111.7 low on 6/29 ended Minor wave X. Up from there, wave Y is unfolding as an Elliott wave zigzag structure where Minute wave ((a)) ended at 113.68 and Minute wave ((b)) ended at 112.86. Up from there, Minutte wave (i) of ((c)) ended at 114.3. Minutte wave (ii) of ((c)) ended at 113.96, but a break above 114.3 will add validity to the view that the next leg higher has started. Until then, a double correction in Minutte wave (ii) still can’t be ruled out before pair resumes the rally higher. Near term, while dips stay above 112.86, and more importantly as far as pivot at 111.7 low stays intact, expect pair to extend higher. We don’t like selling the pair.
USDJPY 1 Hour Elliott Wave Chart
Market Morning Briefing: See Good Chances Of Fresh And Further Strength In The Euro
STOCKS
Dow (21408.52, -0.03%) is range-bound in the 21550-21250 region and could possibly continue to remain so for another couple of sessions. A corrective fall towards 21000 is on the cards for the medium term. For now, sideways consolidation may continue.
Dax (12445.92, +0.46%) opened with a gap up but could not move above 12500. Only on a sustained break above 12500 can we negate a possibility of a further fall towards 12300 or lower just now, else the index could start moving towards 12600 again in the near term. 12500 is a crucial level to watch.
Shanghai (3203.93, -0.27%) continues to remain in the near term up channel. A slight dip towards 3200-3190 is possible before resuming the uptrend. Medium term looks bullish.
Nikkei (20135.63, +0.27%) is rising as expected and could move up towards 20200-20300 in the near term.
Nifty (9771.05, +1.09%) shot up sharply yesterday, rising from levels near 9650, surprising the market. Yesterday’s move indicates sharp bullish momentum in force and while that holds, we could see a rise towards 9850-9900 in a few sessions. Near term looks bullish.
COMMODITIES
Gold (1211) and Silver (15.55) are trading within the range of 1188-1231 and 15.20-16.10 respectively. We will remain bearish on Bullion while they are trading below 1250 and 16.50 levels. We think the sideways modes within these ranges are expected to remain unchanged, and a bounce towards there resistances can be seen in the latter part of the week due to near term oversold condition.
No directional movement had been seen in Copper (2.66) as it is trading within the range of 2.66-2.78. We will remain bullish on copper while it is trading above 2.55 levels.
Brent (47.06) and WTI (44.58) are trading marginally higher to keep the upside possibilities open. The recent trading range could be 44.60-48 for Brent and 42-46 for WTI . Both of them are in a neutral trading zone and could move either side.We will be assured of strength of Brent and WTI only when a firm and sustainable closing above 48 and 46 are made by both of them. Otherwise a failure to close above those levels may push them towards 44 and 42 levels respectively.
Gold/WTI ratio (27.31)found support at 26 levels and could move towards 28.5-29 by the end of this week.
FOREX
See good chances of fresh and further strength in the Euro (1.1393) towards 1.1460, possibly higher, with good Support at 1.1360 and 1.1300. The Dollar Index (96.10) remains weak overall with decent chances of decline to 95.50-40.
The Euro holds onto strength against the Yen as well with Euro-Yen (130.10) likely to climb higher towards 131 over the course of the week. The Yen is possibly the weakest currency just now with Dollar-Yen (114.18) also looking like it can rise further towards 115, with intra-day Support at 113.75. The continued rise in the US-Japan yield spread provides Support to Dollar-Yen.
Although the Pound (1.2875) remains weak while below 1.2935, it may also have intra-day Support at 1.2850-40 now. Only if that breaks can we see further decline towards 1.2800-2750. So, the fall from the high of 1.3030 a couple of weeks ago could start slowing down. Careful about getting trapped in a Short there.
We called for a fall in the Aussie (0.7615) to 0.7530 yesterday, but the market appears a little uncertain as some Intra-day Support is also seen at 0.7600-7575. So, there could be spiky movement in the Aussie, a little like in Pound. The cleanest currencies to trade just now might be the Euro and the Yen.
The Chinese Yuan (USDCNY 6.8040) is weakening slowly, with emerging chances of further weakness towards 6.82. This one needs to the watched.
Dollar-Rupee came down to 64.53 yesterday and trades near 64.50 on the NDF just now. Range Support may be expected in the 64.45-40 region today.
INTEREST RATES
The US yields have come off as mentioned yesterday. The 5YR (1.93%), 10Yr (2.37%) and the 30YR (2.93%) are trading slightly lower from previous levels of 1.40%, 1.96% and 2.39% respectively.
The US 10-5Yr differential (0.44%) has reached the resistance and could come off towards 0.4250% by tomorrow.
The US-Japan 10YR (2.27%) has also started come off exactly as expected and could move down towards 2.2% in the near term. This could possibly pull down Dollar-Yen also towards levels near 112.
The German-Us 10Yr (-1.83%) and the German-US 2Yr (-1.99%) both have some scope to move on the upside and could rise in the near term, indicating a stronger Euro.
Inside the Forex Market: Fake News, Currency Wars & Corruption
Fake News, Read All About It!
Fake news has become one of the buzzwords of 2017, with almost weekly reports regarding politicians or political events, causing outrage due to their spurious nature. The growing importance of social media has exacerbated the problem with fake news reports spreading like wildfire and quickly garnering vast amounts of attention before they can be disputed and or corrected.
The term was widely used during President Trump's election campaign due to both Trump's own incorrect reporting of various facts and figures and also because of CNN's constant fictitious reporting of his campaign. The most famous of these episodes was CNN's incorrect reporting of the number of attendees at Trump's inauguration where they portrayed the event as being virtually empty. CNN have recently come under attack again for allegedly "staging" a protest in the aftermath of the recent London terror attacks.
The purpose of fake-news is typically to gain either financially or politically from the reaction achieved through the spreading of often sensationalist or controversial information.
Information Leaks & Anonymous Comments
Currency traders will be familiar with this concept as the Forex market has long been plagued by false reports, unchecked source comments, and anonymous leaks. These episodes are particularly common during periods of crisis. The European banking crisis, which was at its peak between 2010 and 2014, often saw currency markets whipsawed on the release of ECB leaks, which would later be denied, or source comments which would later be retracted.
During this time, it was not uncommon to see vicious volatility in EUR currency pairs traders reacted to the breaking news flooding their newswires. The common occurrence of these events made it a difficult period for intra-day traders who were often shaken out of positions because of this dynamic.
Verbal Intervention
There are, however, some instances when central banks will purposely use commentary to affect the markets. This is known as a verbal intervention. For example, the SNB's Jordan commonly takes to the wires to announce that the SNB are monitoring the Swiss Franc exchange rate and will act if it continues to strengthen. These comments are designed to deter traders from continuing to buy the Swiss Franc. The ECB are another central bank well known for using verbal intervention to drive the currency rate.
Following the announcement of a huge 1 trillion EUR stimulus program in February 2015, ECB members consistently took to the wires to drive the exchange rate down as it appeared that, despite the stimulus program, EUR was rapidly recovering against the US Dollar.
As you can see in the chart above, each time EURUSD approached the 1.14 mark, various ECB members would hit the wires, weighing on the currency rate.
Currency Wars
The matter of central banks and/or governments, purposely manipulating currency markets has been a hot topic over the last year. Over the course of Trump's election campaign, he frequently declared his intention to label China a currency manipulator. Trump has since dialled back on his claims though many economists that although they no longer fit the bill, at one point (specifically 2000-2014) China was manipulating currency markets to halt the rise of the Renminbi and maintain the country's competitive advantage.
The practice of suppressing currency rates to maintain a competitive advantage has commonly been referred to as a "race to the bottom", where global economies have been engaged in huge monetary easing since the GFC, to maintain their competitiveness and attempt to boost growth. Another phrase often used to describe this practice is "currency wars". In February, the issue of currency wars once again took the limelight as Trump's top trade adviser Peter Navarro accused Germany of profiting from a "grossly undervalued" Euro which he labelled an "implicit Deutsche mark."
Clearly, there is a huge financial gain to be made by anyone who is in a position to profit from leaked reports, false comments and anonymous reporting in the currency markets and indeed, one major issue over the years has been the early acquisition of economic data releases or central bank policy announcements.
Insider Trading
In 2012, Philipp Hilderbrand resigned his position as Chairman of the SNB after it was revealed that his wife, a former hedge fund trader, bought 400,000 Swiss Francs' worth of US Dollars just three weeks before the SNB declared their strategy cap the rise of the Swiss Franc. While Hilderbrand denied claims, many accused the SNB Chairman of giving his wife the information ahead of time to allow her to profit from the announcement.
In April of this year, a recording emerged of two Barclay's bankers in 2008 claiming that the Bank of England was putting significant pressure on commercial banks to keep LIBOR rates suppressed. The LIBOR rigging scandal has been a huge focal point of those seeking to illuminate corrupt banking practices, and this latest revelation once again throws into question the matter of central banks manipulating markets. With so many instances of subversive tactics being used by banks and governments to affect currency markets, the only real question is, who will be next?
Inside The Forex Market: Famous Fat Finger Trades & Flash Crashes
Efficient Markets?
Fat finger trades & flash crashes; these are terms that many of you might have heard on financial news channels or even seen plastered across headlines in newspapers, but do you really know what they mean?
Despite the fact that the global foreign exchange market is the most liquid market in the world and involves some of the brightest people and most sophisticated technology, errors still occur, and accidents still happen all the time. Like freak waves rising from an otherwise calm sea, these episodes might be fairly infrequent, but when they occur they can cause serious damage!
What Are Fat Finger Trades?
"Fat-finger trades" are the term given to a trade that is placed in error and the term alludes to the instance of someone accidentally hitting an extra digit on their keyboard when placing a trade. These type of errors have occurred since the beginning of electronic trading and have accounted for dramatic market shocks.
What Are Flash-Crashes?
A similar problem is that of "flash crashes" which are typically triggered by algorithmic trading programs which flood the market with orders and exacerbate sell-off. These programs, which are typically momentum based, chase the market and during times of thin liquidity can push markets to extreme lows in a matter of minutes. Below, we take a look at some famous episodes of these problems.
Famous Fat-Finger Trades & Flash Crashes
Drunk Trader Sends Oil to Eight Month Highs
In 2010 Steve Perkins, a futures trader at PVM Oil Futures, mistakenly bought 7 million barrels of crude during a late-night drinking session. The error saw Oil spike to an eight-month high, leaving markets dumbfounded. The next morning an admin clerk contact Perkins over the abnormally large trade but was unable to recall the incident. After attempting to cover his tracks with a story about trading alongside a client, Perkins was eventually forced to admit that he was unable to remember what happened after refusing to put his desk in touch with the client.
The drunken error pushed Oil up by more than $1.50 a barrel in less than 30 minutes. To put this in context, this type of acute price shift would only usually be seen in response to a significant geopolitical event and was 10 times the size of the typical quantity of oil futures traded in that timeframe. PVM eventually reversed the entire trade for a total loss of $9,763,252 which is roughly equal to the firm's annual revenue.
So, the next time you feel like placing a trade after a few evening drinks, think again!
Gold Goes Bust
Just this week we saw Gold cratering 1% due to an alleged "fat finger trade". On Monday, Gold plummeted from $1,254 to $1,236.46 due to a huge 18,500 lot order which equates to 1.85 million ounces of gold. This is way above the typical average dealing size for Gold and markets were once again rocked as they scrambled to figure out what was behind the crash. The person behind the error is not yet known, and some traders suspect that the error wasn't, in fact, a "fat finger" trade but an algo error which triggered a flash crash
You might be wondering what a flash crash is; a flash crash is essentially where a market crashes due to the rapid execution of algo orders which all trigger one after another. Typically these crashes occur during hours of thin liquidity such as overnight trading where there are gaps in the order book, and the price jumps lower, chased by algo orders which push the market deeper and deeper.
Sterling Flash Crash
In October 2016 GBP suddenly collapsed 6% lower during overnight trading due to heavy algo selling during thin liquidity. Flash crashes have become an increasingly common occurrence as algorithmic trading continues to gain market share and the risks of automatic execution programmes are a strongly debated area. Algorithmic programmes have the ability to act and react far quicker than human traders and periods of sharp price movement are accelerated due to this.
Summer Wipeout
The Sterling flash-crash echoed the events of August 24th, 2015 when the Dow Jones Index dropped a massive 1,100 points during just five minutes of trading, sending heavy ripples across global markets. Indeed, high beta currency pairs saw significant declines in response as automatic sell programs triggered massive collapses across risk-correlated pairs. However, automatic programs are not solely to blame, and one of the elements that has been named as exacerbating these episodes is that of dealers selling to hedge their options exposure.
How Options Hedging Affects Markets
During times of market panic, many traders buy put options which means that they make money if the market goes down. Consequently, the dealer loses money as the market sell off and so to try and mitigate their losses, they sell the underlying market. During period of mass panic where large amounts of put options are purchased, dealers need to sell equally large quantities of the underlying market to mitigate their losses
So there you go; the next time you see the market crash seemingly out of nowhere you can assume that either someone has accidentally added a few extra zeros to their order or the algos have gone wild!