
Sample Category Title
Dollar at 2-Month High vs Yen; Euro Falls as Bond Yields Ease
As the European session was coming to a close, the dollar edged higher against most major currencies. Falling yields on eurozone bonds as the bond sell-off eased, could have contributed to the euro pressure.
The dollar continued strengthening against most major currencies during the European session on the back of the better-than-expected jobs report on Friday. The dollar index, a broad measure of the greenback's strength, was up 0.16% percent on the day. Dollar/yen was last trading at 114.22, while dollar/loonie was at 1.2884. The rest of the day looks to be quiet as no high-importance data releases are scheduled out of the US till tomorrow.
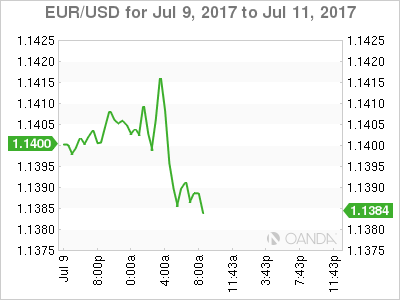
Today was a relatively quiet day for data releases out of the eurozone as well. The Sentix index of eurozone business and investor sentiment in July (28.3) narrowly beat the expected level of 28.2, but tempered from the decade-high level in June (28.4). The wave of eurozone bond sell-off eased today, causing the yields to fall. Germany's 10-year bund yield is down two basis points at 0.55%, easing back from Friday's 18-month high. Looking at the forex market, the eurozone currency weakened against the dollar during today's European session, after holding steady in the prior session. Euro/dollar was last trading at 1.1388.
Pound/dollar reversed the gains recorded during the Asian trading hours and is looking to close lower at the end of the European session. The pair was last trading at 1.2865. Looking ahead, sterling traders could focus on the speeches by two Bank of England members, scheduled tomorrow.
Oil prices declined, extending losses at the end of last week on the back of high drilling activity in the US and ample supplies from OPEC and non-OPEC nations. The number of total active rigs exploring oil and natural gas in the U.S. increased by 12 last week to 952. A year ago, just 440 rigs were active. WTI was last trading at $44.02 a barrel, while Brent crude was at $46.54 a barrel.
Similarly to oil prices, gold has been under pressure as well. The precious metal was last trading at $1,209.24 as European markets were looking to close for the day.
Elliott Wave Analysis: Gold Intraday Drop; Downside Can Be Limited
Gold is trading lower, now making a final drop within final wave 5. As we can see the upper channel line reacted as a resistance for the previous blue wave iv; which means current drop represents sub-wave v of five. That said, downside can still be limited in the near-term around Fibonacci ratio of 200.0. From the mentioned region, a new minimum three wave reversal higher can come in play. Even the relative strength index is pointing to the upside.
GOLD, 1H
USD/JPY Mid-Day Outlook
Daily Pivots: (S1) 112.85; (P) 113.14; (R1) 113.57; More...
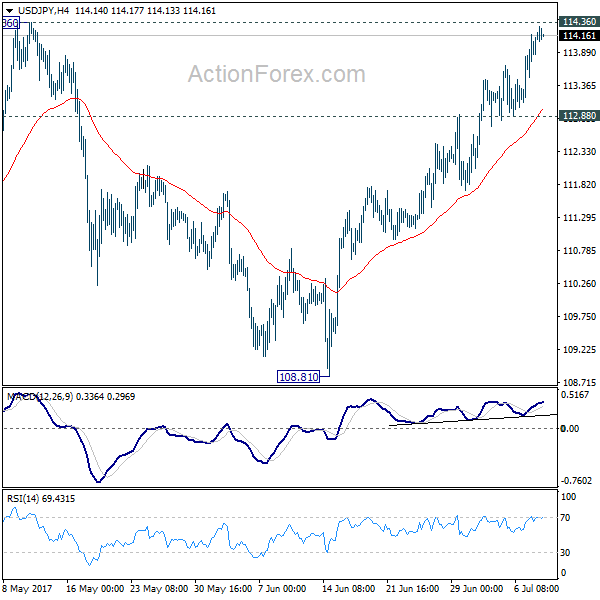
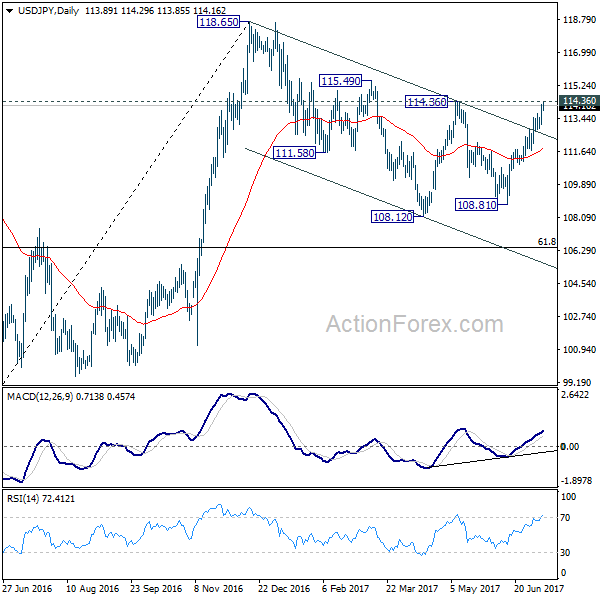
Intraday bias in USD/JPY remains on the upside for 114.36 resistance. Decisive break there will confirm our bullish view that corrective pull back from 118.65 has completed at 108.12. In that case, further rally would be seen to retest 118.65. On the downside, break of 112.88 support is needed to indicate short term topping. Otherwise, outlook will remain bullish in case of retreat.
In the bigger picture, the corrective structure of the fall from 118.65 suggests that rise from 98.97 is not completed yet. Break of 118.65 will target a test on 125.85 high. At this point, it's uncertain whether rise from 98.97 is resuming the long term up trend from 75.56, or it's a leg in the consolidation from 125.85. Hence, we'll be cautious on topping as it approaches 125.85.
USD/CHF Mid-Day Outlook
Daily Pivots: (S1) 0.9600; (P) 0.9627; (R1) 0.9663; More......
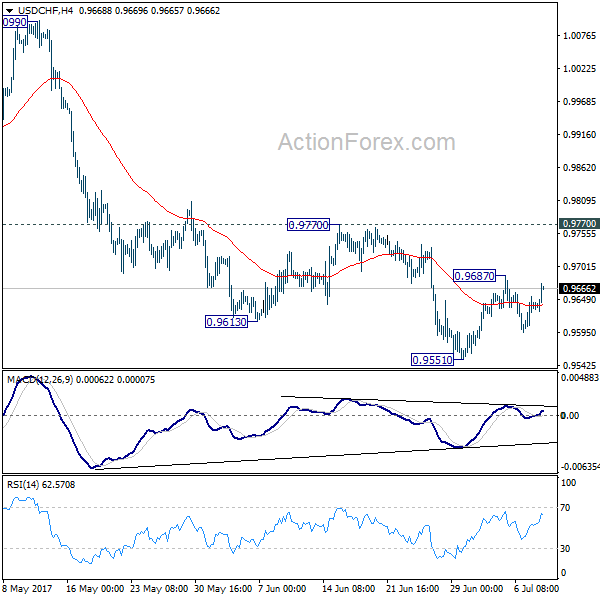
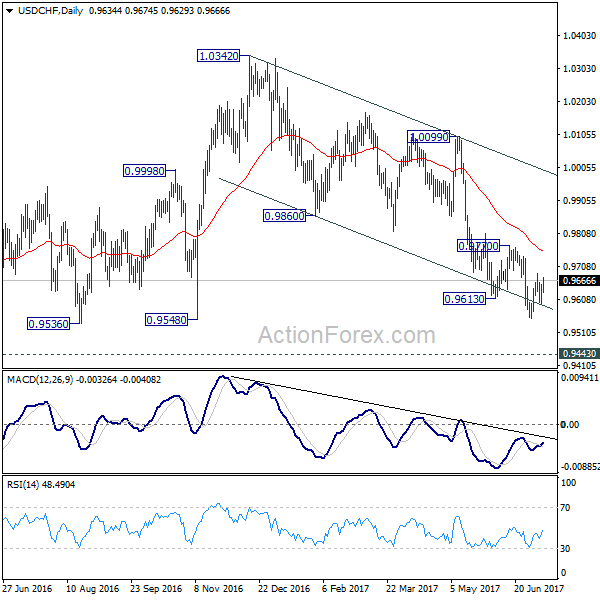
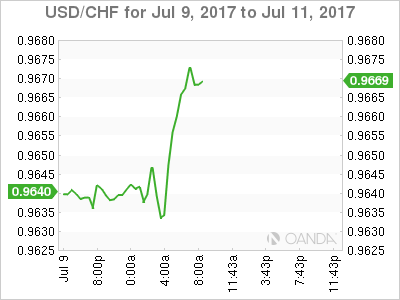
USD/CHF's consolidation from 0.9551 is still in progress and intraday bias remains neutral. In case of another rise, upside should be limited by 0.9770 resistance and bring fall resumption. Break of 0.9551 will extend the whole fall from 1.0342 and target 0.9443 key support level next. We'd expect strong support from there to bring rebound. Meanwhile, firm break of 0.9770 will indicate near term reversal, on bullish convergence condition in 4 hour MACD.
In the bigger picture, USD/CHF is still bounded in medium term range of 0.9443/1.0342 for the moment. Consolidative trading would likely continue and medium term outlook remains neutral. Break of 1.0342 key resistance is needed to confirm underlying bullish momentum in the pair. Meanwhile, downside attempts should be contained by 0.9443 key support level. However, sustained break of 0.9443 will carry larger bearish implication and target 0.9 handle.
GBP/USD Mid-Day Outlook
Daily Pivots: (S1) 1.2837; (P) 1.2905; (R1) 1.2945; More...
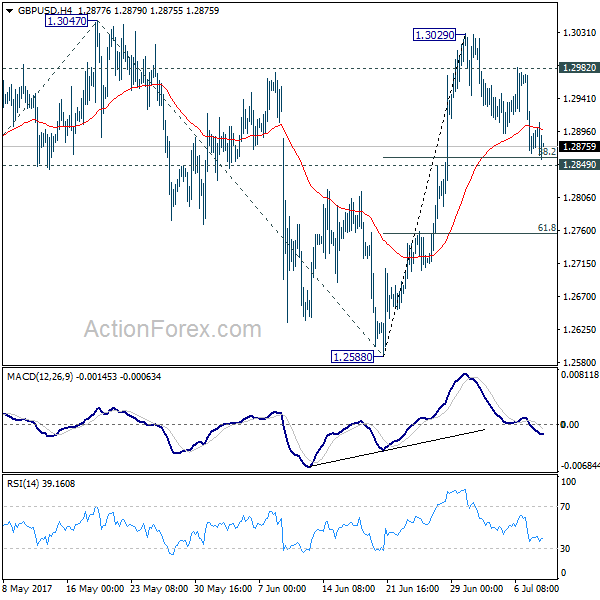
No change in GBP/USD's outlook as the correction from 1.3029 is still in progress. We'd continue to expect strong support from 1.2849 to contain downside and bring rise resumption. Above 1.2982 minor resistance should turn bias back to the upside for 1.3047 resistance. Break will target 61.8% projection of 1.2108 to 1.3047 from 1.2588 at 1.3168 next. However, sustained break of 1.2849 will dampen our near term bullish view and turn focus back to 1.2588 support.
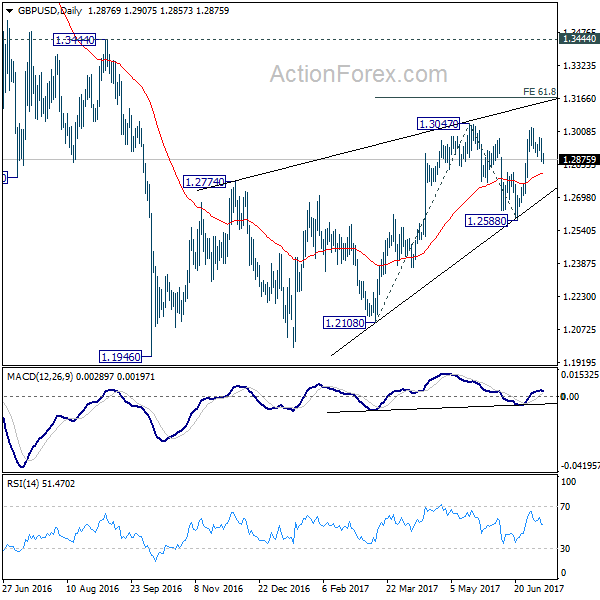
In the bigger picture, overall, price actions from 1.1946 medium term low are seen as a corrective pattern that is still in progress. While further upside is now in favor, overall outlook remains bearish as long as 1.3444 key resistance holds. Larger down trend from 1.7190 is expected to resume later after the correction completes. And break of 1.2588 will indicate that such down trend is resuming.
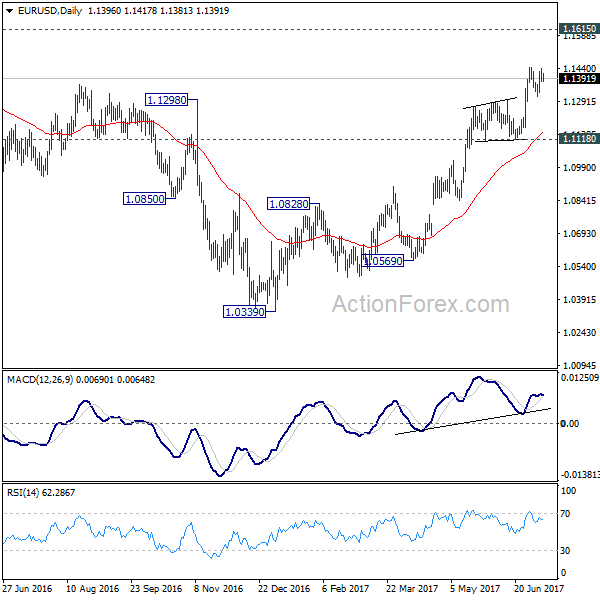
EUR/USD Mid-Day Outlook
Daily Pivots: (S1) 1.1371; (P) 1.1405 (R1) 1.1431; More.....
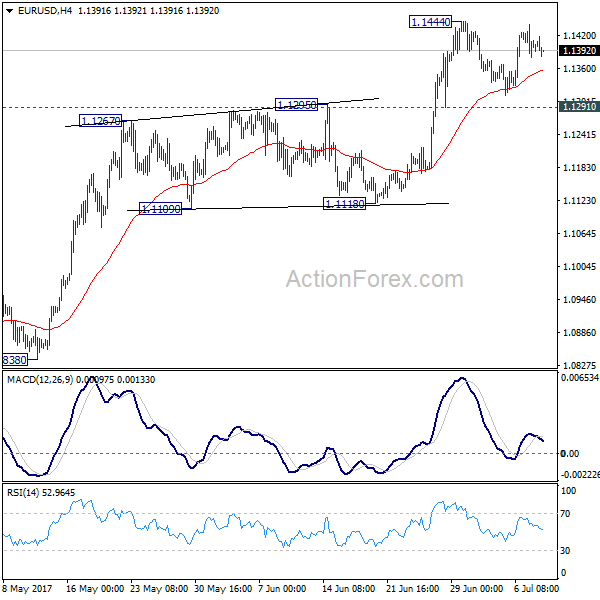
EUR/USD continues to stay in range below 1.1444 and intraday bias remains neutral. Consolidation could extend but in case of another fall, downside should be contained by 1.1291 resistance turned support to bring rise resumption. Break of 1.1444 will extend the rally from 1.0339 low to 1.1615 resistance next. Meanwhile, break of 1.1291 will turn focus back to 1.1118 support instead.
In the bigger picture, the firm break of 1.1298 resistance further affirm medium term reversal. That is an important bottom was formed at 1.0339 on bullish convergence condition in weekly MACD. Further rise would be seen to 55 month EMA (now at 1.1763). Sustained break there will pave the way to 38.2% retracement of 1.6039 (2008 high) to 1.0339 (2017 low) at 1.2516 next. This will now remain the favored case as long as 1.1118 support holds.
Euro Firm as Sentix Stayed Closed to 10 Year High, Markets in Range Trading
The forex markets are generally staying in tight range today. Yen is attempting to extend recent down trend but momentum is relatively weak. In particular, USD/JPY is feeling a bit heavy ahead of 114.36 key medium term resistance level. Euro is firm as Sentix investor confidence stayed closed to 10 year high in July. But both Dollar and Sterling are mildly stronger and they pare some of last week's losses. Canadian Dollar is also in consolidation even though markets are expecting BoC to deliver a 25bps rate hike later in the week. In other markets, Gold dips to as low as 1204 and is held below 1210 handle so far. WTI crude oil is mildly lower at around 44.0.
Eurozone Sentix stayed closed to 10 year high
Eurozone Sentix investor confidence dropped 0.1 to 28.3 in July but beat expectation of 28.3. That's also close enough to the 10 year high at 28.4 made last month. Sentix noted in the statement that "in the last few days, the fears of investors before a change in interest rate policy in the euro area determined market activity." While investors' assessment rose for the seven straight month, expectations "cannot quite keep up". "The trend continues to be in the Eurozone, but the momentum should have reached a certain zenith." It also noted that the central bank policy index dropped to -26 as "it has been clear to investors that the ECB must leave its expansive course." But the inflation expectation index had an opposing trend and rose to -15.75. Sentix said that "it would not be a surprise if Mario Draghi at the next ECB meeting would rather warn investors not to be certain in their assessment of the speed of monetary policy, not the direction itself."
ECB Villeroy: Next fall is time to adapt the intensity of stimulus
ECB Governing Council member Francois Villeroy de Galhau said that it will be the central bank's decision "next fall" on "on adapting the intensity" of the monetary policy that "progress toward our inflation target and toward economic recovery." He used the phrase "adapt the intensity" a total of three times. That is seen by analysts as sign that ECB could pare back stimulus that would have least impact to tighten up financial conditions. Executive Board member Benoit Coeure also said last Friday that the central bank's decision to lower monthly bond purchase from EUR 80b to 60b is a guide for future policy adjustments. For now, markets generally expect ECB to announce a tapering plan in September that would bring down monthly asset purchase to zero in 2018.
BoJ offered another upbeat assessment on economy
In a BoJ quarterly report, the central bank upgraded the assessment on regional Japan. Six regional economies are described as "expanding moderately" or "moving toward a moderate expansion". That's seen as the most upbeat language since 2005. BoJ Governor Haruhiko Kuroda also said that "Japan's economy is expected to continue expanding moderately ahead." Nonetheless, Kuroda also remained cautious and reiterated the pledge to maintain ultra-loose monetary policy until the 2% inflation target is met. Released from Japan, machines orders dropped -3.6% mom in May versus expectation of 0.7% mom rise. Current account surplus narrowed to JPY 1.40T in May. Eco Watchers sentiment rose to 50 in June.
EUR/USD Mid-Day Outlook
Daily Pivots: (S1) 1.1371; (P) 1.1405 (R1) 1.1431; More.....
EUR/USD continues to stay in range below 1.1444 and intraday bias remains neutral. Consolidation could extend but in case of another fall, downside should be contained by 1.1291 resistance turned support to bring rise resumption. Break of 1.1444 will extend the rally from 1.0339 low to 1.1615 resistance next. Meanwhile, break of 1.1291 will turn focus back to 1.1118 support instead.
In the bigger picture, the firm break of 1.1298 resistance further affirm medium term reversal. That is an important bottom was formed at 1.0339 on bullish convergence condition in weekly MACD. Further rise would be seen to 55 month EMA (now at 1.1763). Sustained break there will pave the way to 38.2% retracement of 1.6039 (2008 high) to 1.0339 (2017 low) at 1.2516 next. This will now remain the favored case as long as 1.1118 support holds.
Economic Indicators Update
| GMT | Ccy | Events | Actual | Forecast | Previous | Revised |
|---|---|---|---|---|---|---|
| 23:50 | JPY | Machine Orders M/M May | -3.60% | 1.70% | -3.10% | |
| 23:50 | JPY | Current Account (JPY) May | 1.40T | 1.63T | 1.81T | |
| 1:30 | CNY | CPI Y/Y Jun | 1.50% | 1.60% | 1.50% | |
| 1:30 | CNY | PPI Y/Y Jun | 5.50% | 5.50% | 5.50% | |
| 5:00 | JPY | Eco Watchers Survey Current Jun | 50 | 49 | 48.6 | |
| 6:00 | EUR | German Trade Balance (EUR) May | 20.3B | 20.3B | 19.8B | |
| 8:30 | EUR | Eurozone Sentix Investor Confidence Jul | 28.3 | 28.1 | 28.4 | |
| 14:00 | USD | Labor Market Conditions Index Change Jun | 2.3 |
Dollar Firms While Oil Remains Under Pressure
It appears that equity markets have taken inspiration from the performance on Wall Street at the conclusion of last week, with Asian stocks trading broadly higher and European shares looking positive at the time of writing. The "Goldilocks" US jobs report seems to have acted as a catalyst to help risk sentiment, with the mixed nature of the June jobs report providing a platform of a support for the USD, while exciting equity bulls as strong job growth is a characteristic of a healthy economy, with the tepid wage growths suggesting a slower pace of monetary changes from the Federal Reserve.
With both the Asian and European markets marching into the new trading week on solid footing and investors appearing optimistic over the current outlook for the global economy, Wall Street could be in line to trade higher this afternoon
OPEC turns to Nigeria and Libya
It's quite remarkable how the supply cut exemptions from some OPEC members have come back to punish the cartel, as production in June climbed to the highest level so far in 2017. With the increasing output from Nigeria and Libya threatening to disrupt the efforts made by the rest of the group to rebalance the markets and not being something that was priced in, the price of oil could remain under pressure. There are reports circulating over the possibility that OPEC will request both Nigeria and Libya to cut production and while these might read as desperate, increased production from both nations was likely not factored into consideration when OPEC greed to extend its production cut. With the oversupply dynamics still weighing heavily on the mind of investors, the price of oil remains under pressure as oversupply remains the name of the game when it comes to price fluctuations
Dollar regains its footing
The Greenback stood tall during Monday's trading session as investors digested June's mixed employment report. While the impressive NFP headline number of 222k boosted sentiment towards the US economy and supported expectations of the Federal Reserve raising rates, the tepid wage growth fanned concerns over inflation lagging for prolonged periods. Although June's "Goldilocks" report may inspire Dollar bullish investors, the upside could still face headwinds as the lower inflation levels suggest a slower pace of monetary changes from the Federal Reserve. With the economic calendar fairly light today, price action may dictate where the Dollar Index trades with bulls eyeing 96.40.
Investors will be paying very close attention to Janet Yellen's testimony on Wednesday and Thursday for clues on when the central bank plans to unwind its balance sheet and raise US interest rates in the second half of 2017. It will be interesting to hear Yellen's thoughts on the latest jobs and inflation data and if she maintains her hawkish tone.
Commodity spotlight - Gold
Gold was under renewed selling pressure on Monday as the combination of Dollar strength and rising prospects of tighter global monetary policies punished the zero-yielding metal. With June's mixed jobs report supporting expectations of the Federal Reserve taking action this year, bears seem to be back. It will be interesting to see how prices react to the $1200 support and if buyers use this opportunity to propel the metal higher. From a technical standpoint, the yellow metal is coming under increasing selling pressure on the daily charts. The breakdown below $1214 may encourage a further decline towards $1200.
Will the Bank of Canada Pull the Trigger?
Monday July 10: Five things the markets are talking about
To date, rising interest rates continue to overshadow geopolitical developments and it's the Bank of Canada (BoC) turn this week to practice what G7 Central Banks have been preaching of late.
Over the past fortnight, markets have reassessed the outlook for tighter monetary policies from major central banks following a string of hawkish remarks.
Given the good economic news recently in Canada, Governor Poloz is expected to increase its policy interest rate by +25 bps points to +0.75% on Wednesday (10:00 am EDT). At the same time the Bank will publish its Monetary Policy Report with its current forecasts.
However, if they disappoint it will get very messy again for the loonie (C$1,2910) - over the last month, the CAD's painful rise has taken the 'bears' by surprise.
Note: The last time the BoC changed rates was two years ago when it lowered its policy rate by -25 bps.
Friday's solid U.S employment growth without inflation should keeps the Fed normalizing policy at a 'slow' pace, which is positive for equities, mixed for the dollar and yields.
Also on Wednesday, capital markets will look to the Fed's Janet Yellen's testimony before Congress for guidance on when the Fed could start reducing its balance sheet.
1. Stocks like employment reports
In Japan, stocks rallied to more than one-week highs overnight, following U.S equities after Friday's non-farm payroll (NFP) report supported the dollar outright against the yen (¥114.22). The Nikkei gained +0.8% while the broader Topix Index added +0.5%.
Down-under, Australia's S&P/ASX 200 Index gained +0.4%, while in Hong Kong, the Hang Seng Index rose +0.7%.
In mainland China, stock indexes were little changed as investors awaited fresh catalysts ahead of a plethora of data due next week.
Note: On July 17, China will release Q2 gross domestic product (GDP), along with June industrial output, retail sales and January-June fixed asset investment.
Overnight, markets shrugged off China's June inflation data, which met expectations and did little to alter the view that economic growth is cooling after a solid Q1 - June CPI rallied +1.5% y/y.
In Europe, markets have opened higher and continue to remain positive, as risk sentiment has improved over the weekend. Consumer discretionary sector lead the gains, while energy stocks again weigh on indexes.
U.S equities are set to open in the red (+0.1%).
Indices: Stoxx50 +0.4% at 3,475, FTSE +0.3% at 7,374, DAX +0.6% at 12,464, CAC-40 +0.2% at 5,158, IBEX-35 -0.3% at 10,460, FTSE MIB +0.6% at 21,147, SMI +0.7% at 8,944, S&P futures +0.1%
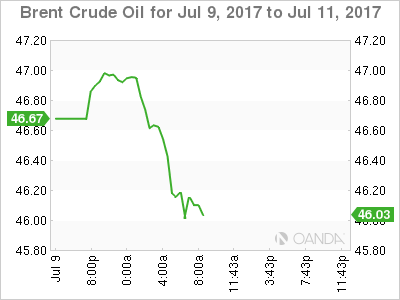
2. Oil edges up but market still under pressure
Last week, crude oil prices rolled over mid-week giving back half of gains seen since June 21.
Nevertheless, oil prices have recovered some losses overnight after its -3% fall Friday, but markets remain under pressure from high drilling activity in the U.S and ample supplies from OPEC.
Brent crude futures are at +$46.80 per barrel, up +9c or +0.2% percent from their Friday's close. U.S West Texas Intermediate (WTI) crude futures are at +$44.33 per barrel, up +10c c, or +0.2%.
The dynamics have not changed for oil; speculators are predominately booking some profits.
Note: Brent prices are -17% below their 2017 opening despite a deal OPEC to cut production from January.
On Friday Baker Hughes data showed that U.S energy firms added +7 oil drilling rigs last week, marking a 24th week of increases out of the last 25 and bringing the total count up to +763, the most since April 2015.
Note: U.S oil production has risen over +10% since mid-2016 to +9.34m bpd.
Gold is little changed overnight (-0.3% to +$1,207.88 an ounce) hovering atop of its four-month lows after stronger than expected U.S jobs data indicated that the Fed would maintain its stance on monetary tightening. On Friday, the yellow metal fell to its lowest print since March 15 and -2.3% on the week.
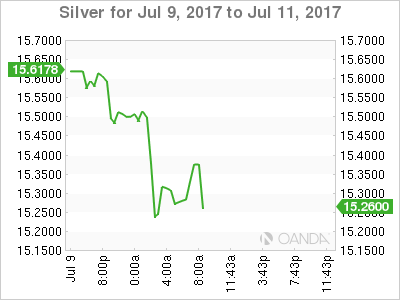
Silver fell about -6% last week to +$14.86 an ounce, its lowest in 15 months.
3. Global Yield curves getting steeper
Recent moves in the fixed income market are not for the faint hearted.
The U.S 10-year yield (+2.385%) has climbed nearly +25 bps from its 2017 low at the end of last month as investors brace for the possibility that the ECB will begins to withdraw its bond-buying stimulus.
With European economic data continuing to surpass expectations has resulted in the German 10-year Bund yield moving back above the psychological +0.5% level not seen since early last year.
Currently, U.S rates are tracking Euro yields higher, a move that appears justified by Friday's robust June jobs report.
Current consensus expects the 10-year yield to rise to +2.66% by year-end, +0.45% above where it was trading at the beginning of June.
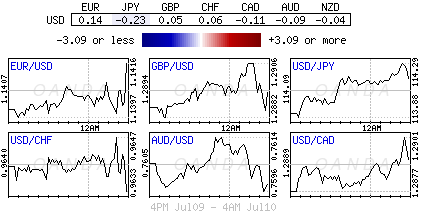
4. USD steady, EUR toppish, JPY weaker, Pound vulnerable
Over the last week, the EUR (€1.1383) has moved to a one-month high outright, while GBP (£1.2863, €0.8848) has suffered after U.K economic releases significantly lagged that of continental Europe's. The 'big' dollar has also rallied to the highest level since early May against the Yen (¥114.20) - supported by the BoJ's actions Friday who were forced to offer an unlimited amount of bids in its fixed-rate bond operation to stem the rise in JGB bond yields.
Where to from here? Further gains for EUR may be tough, there seems to be few near-term catalysts to build on this recent rally, while the recent weak U.K data makes an interest-rate rise by the BoE unlikely for now, leaving sterling vulnerable to further declines - especially against the dollar.
5. Swiss Sight Deposits Little Changed
The latest sight deposits data from the Swiss National Bank (SNB) suggests the bank largely refrained from intervening in currency markets last week, as the EUR (€1.0998) flirts with one-year highs against the franc.
Sight deposits - considered a proxy for intervention - were +578.7B CHF, little changed from the previous week.
DAX Edges Higher as Eurozone Investor Confidence Beats Estimate
The DAX index has edged higher in the Monday session, as the index is up 0.32% on the day. Currently, the DAX is at 12,437.00. On the release front, Germany's trade surplus widened to EUR 20.3 billion, matching the forecast. The Eurozone Sentix Investor Confidence edged up to 28.4, above the estimate of 28.1.
The new trading week has started with positive data. Germany's trade surplus climbed to EUR 20.3 billion in May, which was the second highest surplus this year. A boom in exports continues to lead to a favorable trade balance, and the manufacturing sector has also benefited from stronger global demand for German products. The German economy has also received a boost from strong domestic demand, and the labor market remains tight. The IMF has upgraded its forecast for the German growth to 1.8 percent in 2017, up from its estimate of 1.6 percent in April.
With the euro-area continuing to record stronger growth, the ECB is tiptoeing towards a tighter policy, as underscored by the ECB's June minutes. Policymakers discussed removing its "easing bias" at the June meeting, but ultimately decided not to make a move, since stronger economic conditions had not resulted in higher inflation. At the same time, minutes were cautious in tone, noting that "it was necessary to avoid signals that could trigger a premature tightening of financial conditions". ECB chief economist Peter Praet reiterated the bank's stance at a conference in Paris last week. Praet noted that eurozone economic growth is accelerating, but said that the ECB still needs to provide a "steady hand" in order to spur stubbornly low inflation levels. The ECB holds its next policy meeting on July 20. In June, the bank removed an easing bias towards lowering interest rates. However, policymakers may now be wary about sending more signals of tightening policy, so as to avoid another run on the euro, as was the case after Draghi's comments at the ECB forum. The ECB doesn't want the rate statement to shake up markets, so we could see an innocuous statement, to the effect that the economy is headed in the right direction, but QE will remain in place until inflation levels move higher.