Sample Category Title
USD/CAD Daily Outlook
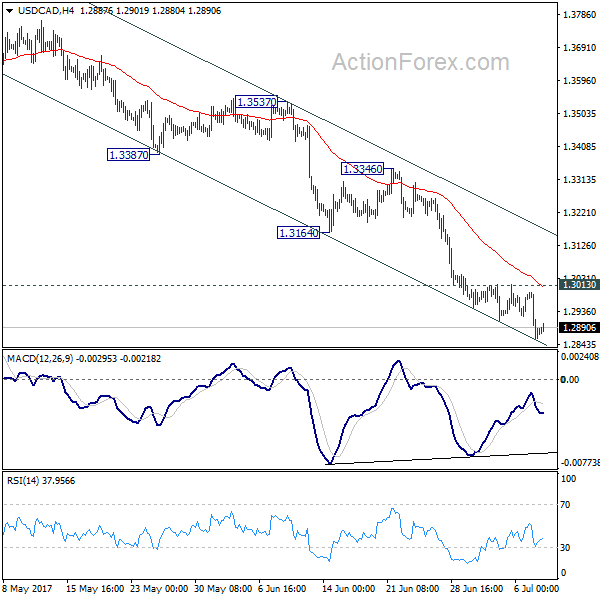
Daily Pivots: (S1) 1.2826; (P) 1.2909; (R1) 1.2960; More....
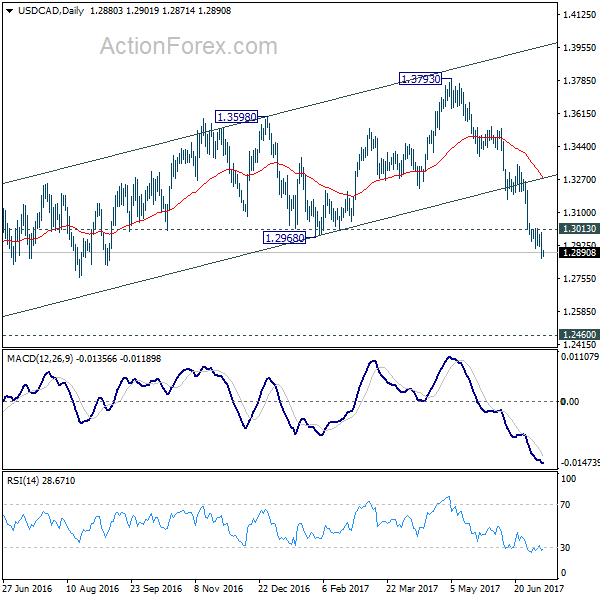
Intraday bias in USD/CAD remains on the downside for the moment. Current decline from 1.3793 should target a test on 1.2460 low next. On the upside, break of 1.3013 resistance is needed to signal short term bottoming. Otherwise, outlook will remain bearish in case of recovery.
In the bigger picture, price actions from 1.4689 medium term top are seen as a correction pattern. The second leg should have finished at 1.3793. Break of 1.2460 will extend such correction to 50% retracement of 0.9406 to 1.4869 at 1.2048. At this point, we'd look for strong support from there to contain downside and bring rebound. However, firm break there will target 100% projection of 1.4689 to 1.2460 from 1.3793 at 1.1564.
EUR/USD Daily Outlook
Daily Pivots: (S1) 1.1371; (P) 1.1405 (R1) 1.1431; More.....
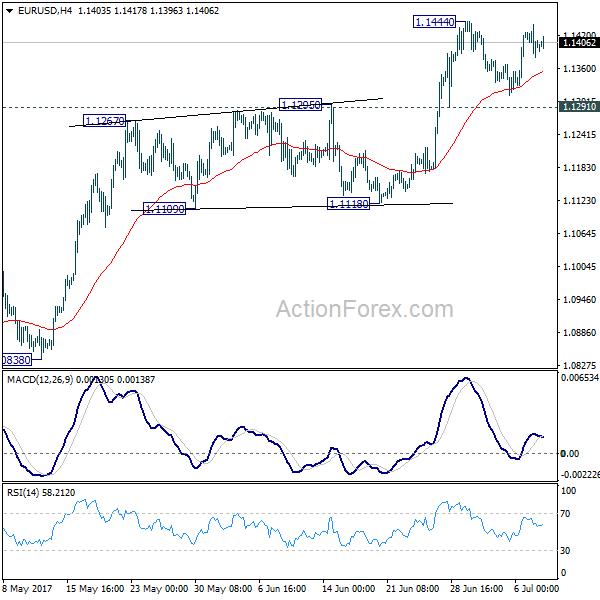
Intraday bias in EUR/USD remains neutral as consolidation from 1.1444 is still in progress. In case of another fall, downside should be contained by 1.1291 resistance turned support to bring rise resumption. Break of 1.1444 will extend the rally from 1.0339 low to 1.1615 resistance next. Meanwhile, break of 1.1291 will turn focus back to 1.1118 support instead.
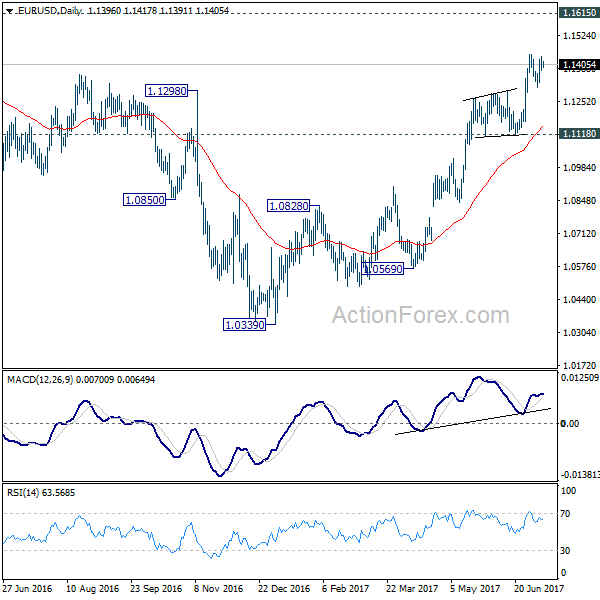
In the bigger picture, the firm break of 1.1298 resistance further affirm medium term reversal. That is an important bottom was formed at 1.0339 on bullish convergence condition in weekly MACD. Further rise would be seen to 55 month EMA (now at 1.1763). Sustained break there will pave the way to 38.2% retracement of 1.6039 (2008 high) to 1.0339 (2017 low) at 1.2516 next. This will now remain the favored case as long as 1.1118 support holds.
GBP/USD Daily Outlook
Daily Pivots: (S1) 1.2837; (P) 1.2905; (R1) 1.2945; More...
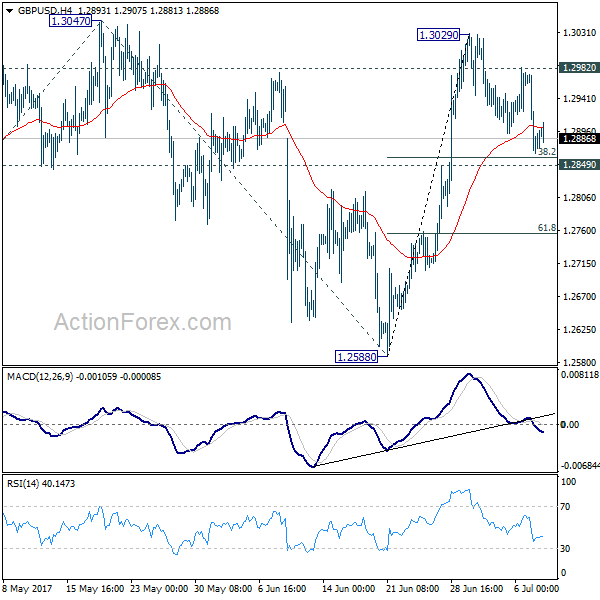
Intraday bias in GBP/USD remains neutral as consolidation from 1.3029 continues. We'd continue to expect strong support from 1.2849 to contain downside and bring rise resumption. Above 1.2982 minor resistance should turn bias back to the upside for 1.3047 resistance. Break will target 61.8% projection of 1.2108 to 1.3047 from 1.2588 at 1.3168 next. However, sustained break of 1.2849 will dampen our near term bullish view and turn focus back to 1.2588 support.
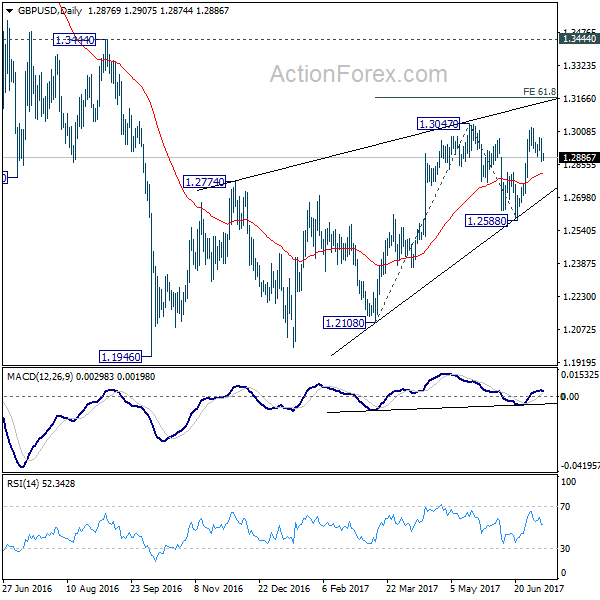
In the bigger picture, overall, price actions from 1.1946 medium term low are seen as a corrective pattern that is still in progress. While further upside is now in favor, overall outlook remains bearish as long as 1.3444 key resistance holds. Larger down trend from 1.7190 is expected to resume later after the correction completes. And break of 1.2588 will indicate that such down trend is resuming.
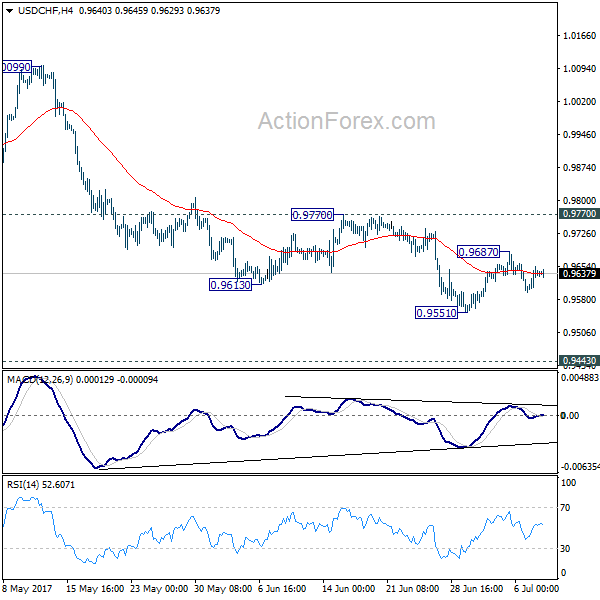
USD/CHF Daily Outlook
Daily Pivots: (S1) 0.9600; (P) 0.9627; (R1) 0.9663; More......
Intraday bias in USD/CHF remains neutral at this point. Consolidation from 0.9551 could extend. In case of another rise, upside should be limited by 0.9770 resistance and bring fall resumption. Break of 0.9551 will extend the whole fall from 1.0342 and target 0.9443 key support level next. We'd expect strong support from there to bring rebound. Meanwhile, firm break of 0.9770 will indicate near term reversal, on bullish convergence condition in 4 hour MACD.
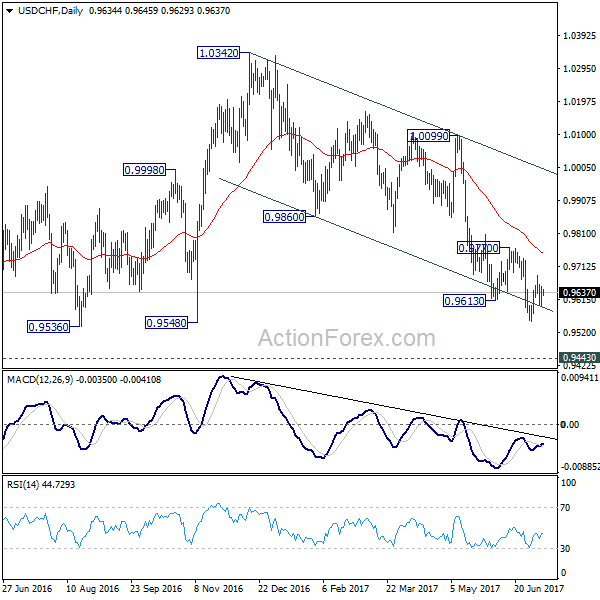
In the bigger picture, USD/CHF is still bounded in medium term range of 0.9443/1.0342 for the moment. Consolidative trading would likely continue and medium term outlook remains neutral. Break of 1.0342 key resistance is needed to confirm underlying bullish momentum in the pair. Meanwhile, downside attempts should be contained by 0.9443 key support level. However, sustained break of 0.9443 will carry larger bearish implication and target 0.9 handle.
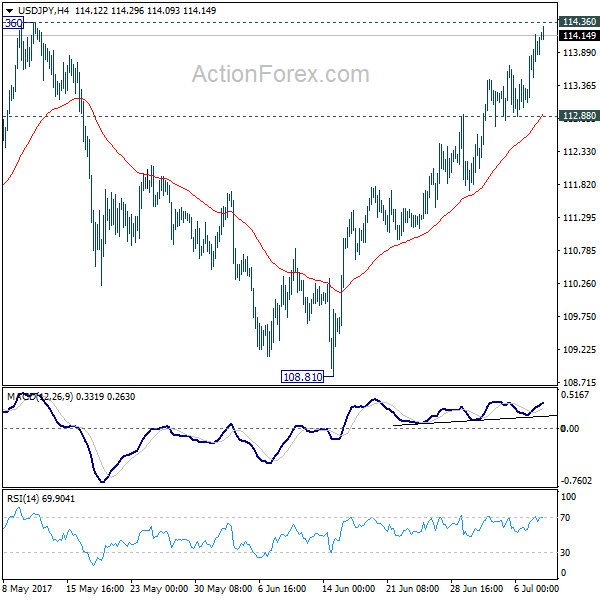
USD/JPY Daily Outlook
Daily Pivots: (S1) 112.85; (P) 113.14; (R1) 113.57; More...
USD/JPY's rally continues today and reaches as high as 114.29 so far. Intraday bias remains on the upside for 114.36 resistance. Decisive break there will confirm our bullish view that corrective pull back from 118.65 has completed at 108.12. In that case, further rally would be seen to retest 118.65. On the downside, break of 112.88 support is needed to indicate short term topping. Otherwise, outlook will remain bullish in case of retreat.
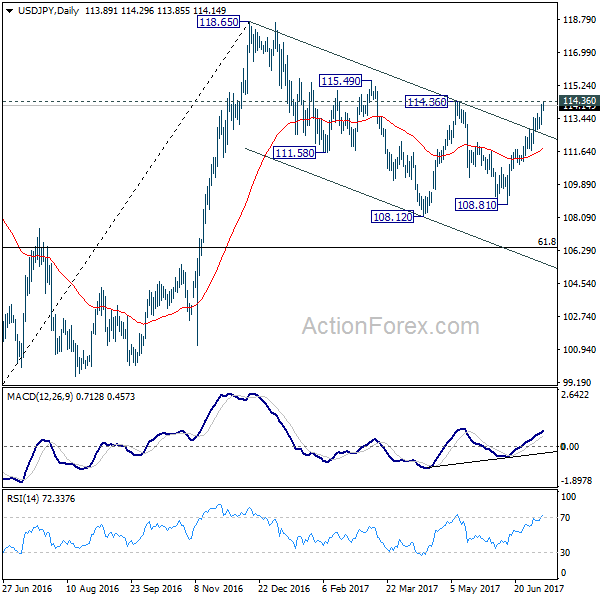
In the bigger picture, the corrective structure of the fall from 118.65 suggests that rise from 98.97 is not completed yet. Break of 118.65 will target a test on 125.85 high. At this point, it's uncertain whether rise from 98.97 is resuming the long term up trend from 75.56, or it's a leg in the consolidation from 125.85. Hence, we'll be cautious on topping as it approaches 125.85.
EUR/GBP Daily Outlook
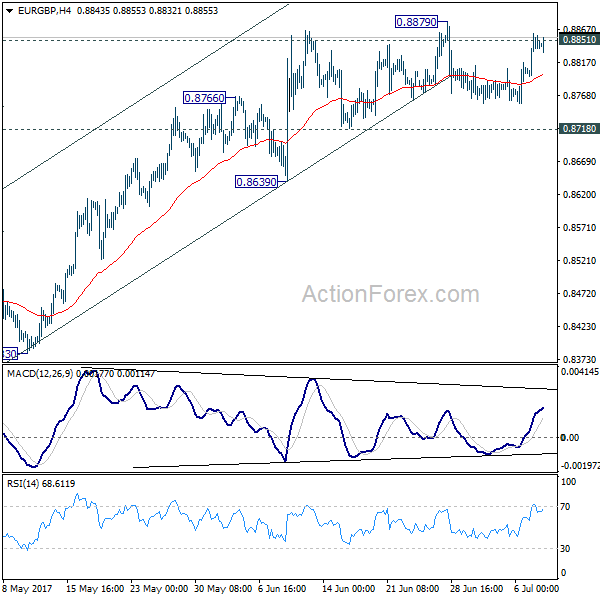
Daily Pivots: (S1) 0.8809; (P) 0.8835; (R1) 0.8873; More
Intraday bias in EUR/GBP remains neutral as sideway trading from 0.8879 continues. On the downside, break of 0.8718 support will argue that rise from 0.8312 has completed. In that case, intraday bias with be turned back to the downside for lower side of the range at 0.8312. Meanwhile, break of 0.8879 and sustained trading above 0.8851 will pave the way to retest 0.9304 high.
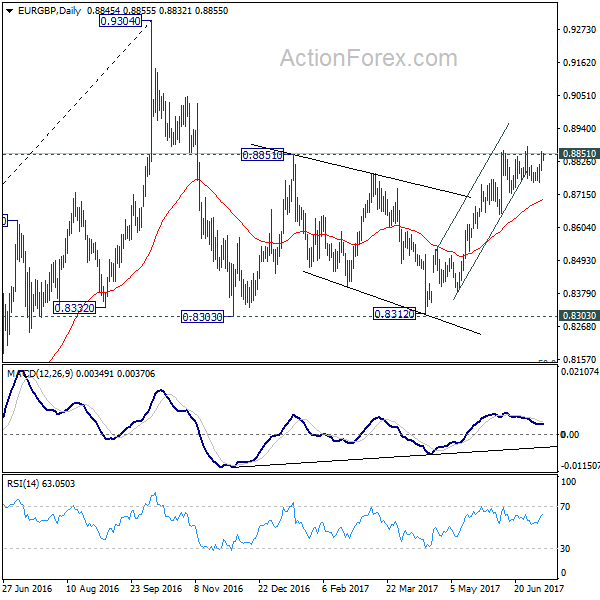
In the bigger picture, price actions from 0.9304 are viewed as a medium term corrective pattern. It's uncertain whether it is finished yet. But in case of another fall, we'd expect strong support from 0.8116 cluster support (50% retracement of 0.6935 to 0.9304 at 0.8120) to contain downside and bring rebound. Whole up trend from 0.6935 is expected to resume after consolidation from 0.9304 completes.
EUR/AUD Daily Outlook
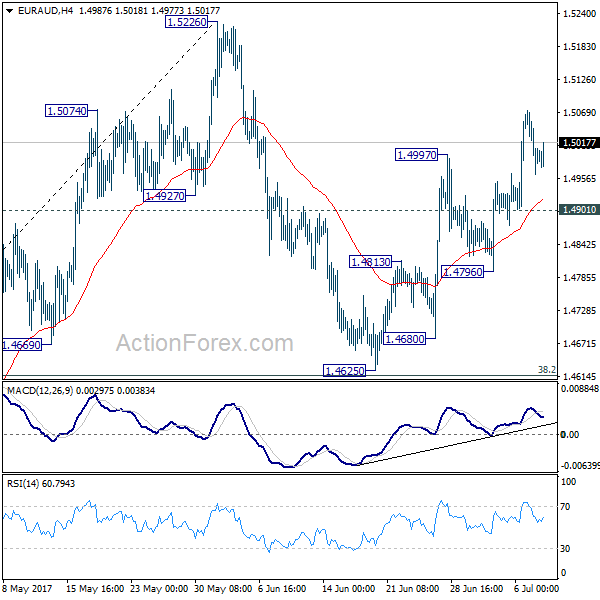
Daily Pivots: (S1) 1.4939; (P) 1.5006; (R1) 1.5050; More...
With 1.4901 minor support intact, further rise is expected in EUR/AUD to 1.5226 resistance. Break there will confirm resumption of whole rally from 1.3624. In such case, EUR/AUD would target 1.5455 fibonacci level next. On the downside, however, break of 1.4901 minor support will dampen this bullish view and turn bias back to the downside.
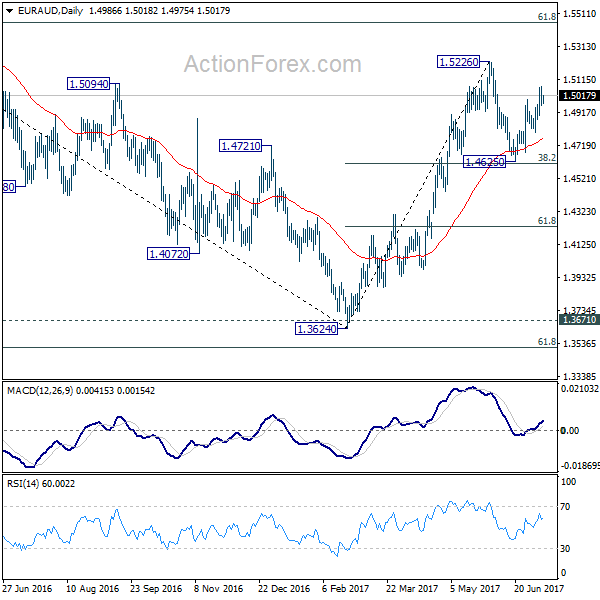
In the bigger picture, price actions from 1.6587 medium term top are viewed as a corrective pattern. Such correction should be completed at 1.3624 after defending 1.3671 key support. Rise from 1.3642 would extend to 61.8% retracement of 1.6587 to 1.3624 at 1.5455. Sustained break there will pave the way to retest 1.6587. However, sustained break of 1.4625 support will dampen this bullish view. In that case, we'll assess the outlook later after looking at the structure and depth of the pull back.
Oil Traders Are Whipsawed As Gold Gets De-rated
Talk of OPEC cuts is a false dawn with traders whipsawed, as higher global rates leave gold on the back foot.
CRUDE
Two weeks away was well timed as oil prices rallied over 10% from their early June lows only for both crude contracts to give back the majority of those gains in just as short time. It is especially concerning against a backdrop of massive drawdowns in U.S. Crude Inventories last week. Looking from the outside in the rally in oil looked more about systematical traders being whipsawed out of short term positioning rather than a fundamental change in the oil market itself.
Talk of deeper OPEC cuts is we feel, premature and indeed OPEC's Secretary General appeared to quash this over the weekend, commenting that they would not be considered at the July 24th meeting. It could lead to crude prices coming under some pressure in Asia and Europe to start the trading week. In all honesty, it would be unrealistic for OPEC to get themselves and the Non-OPEC's “ducks in a row” in the timeframe available even had they wished to consider it.
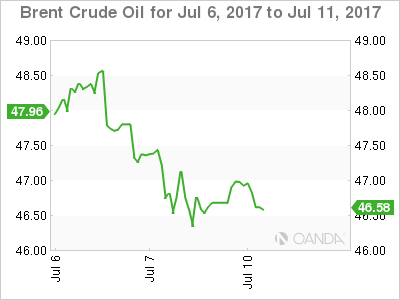
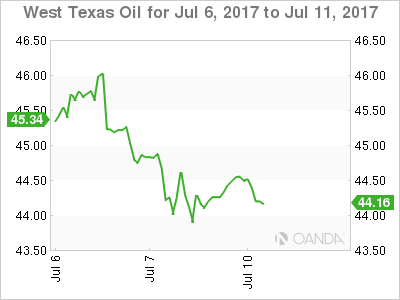
As the new reality that both Brent and WTI's medium term ranges are more likely to be $40 to $50 a barrel, OPEC can at least take some solace that both contracts are trading approximately mid-range.
Brent spot opened at $47.00 in Asia after falling two percent on Friday. Resistance lies at $47.80 with key short-term support at $46.00.
WTI spot opened at $44.50 in early Asia after a similar Friday fall. Resistance lies at 45.20 with $43.50 possibly seeing more stop-loss selling as the whipsaw comes out to slice traders positioning again.
GOLD
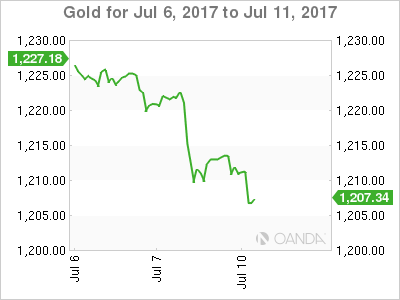
Friday's higher Non-Farm Payrolls print ripped gold out of its consolidation range of last week, with the yellow metal falling at 1.70% at one stage before climbing off the floor to close at 1212.50, still some one percent down on the day. With the hindsight of two weeks away, gold itself appears though to have been treading water anyway with the bearish chart patterns most definitely still to the fore.
More troubling going forward for gold bulls will be the moves of last week in U.S. and German rates. With yields on both marching higher as talk of ECB tapering and good U.S. further undermining gold's appeal as an asset class.
This morning gold opened in Asia at 1212.00.
Daily support lies at the 50% retracement just below at 1208.85 followed by the psychological 1200.00 and then 1195.00.
Resistance is well defined at 1230.00, just ahead of the 200-day moving average at 1232.50.
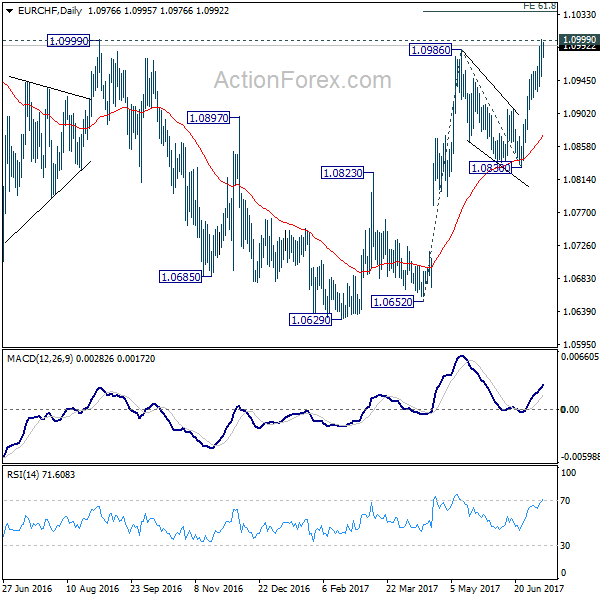
EUR/CHF Daily Outlook
Daily Pivots: (S1) 1.0965; (P) 1.0982; (R1) 1.1004; More...
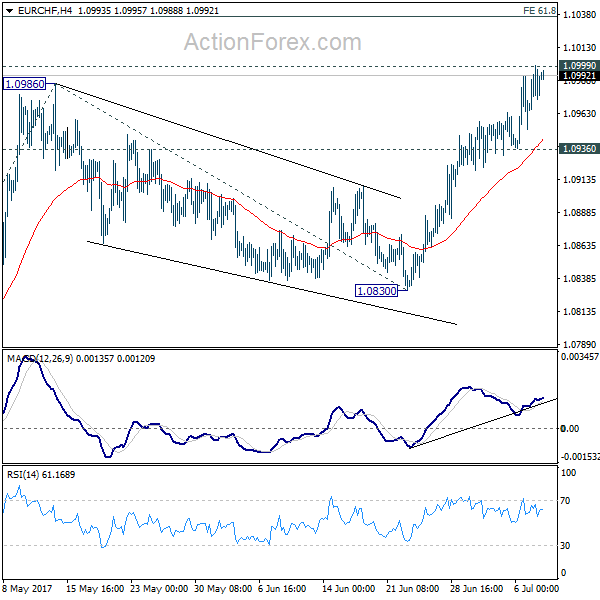
Intraday bias in EUR/CHF remains on the upside for the moment. Decisive break of 1.0999 medium resistance will target 61.8% projection of 1.0652 to 1.0986 from 1.0830 at 1.1036 next. On the downside, break of 1.0936 support is needed to indicate short term topping. Otherwise, outlook will remain bullish in case of retreat.
In the bigger picture, the price actions from 1.1198 are seen as a corrective move. Such correction could have completed after defending 38.2% retracement of 0.9771 to 1.1198 at 1.0653. Decisive break of 1.0999 resistance will target a test on 1.1198 high. For now, this will be the preferred case as long as 1.0830 support holds.
GBP/JPY Daily Outlook
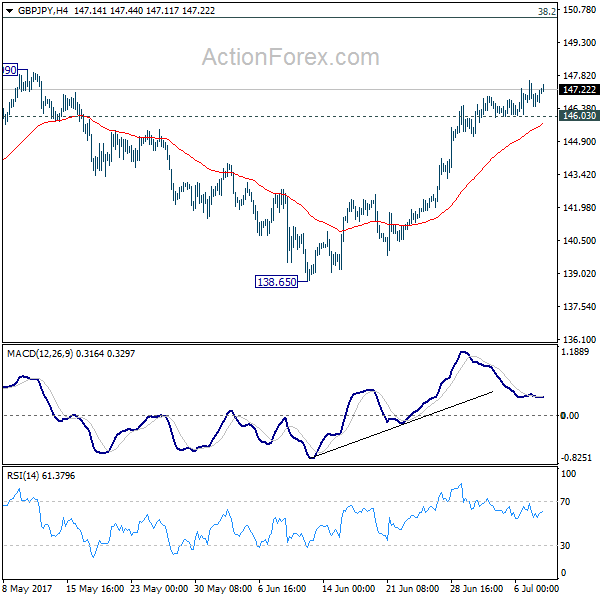
Daily Pivots: (S1) 146.17; (P) 146.88; (R1) 147.40; More....
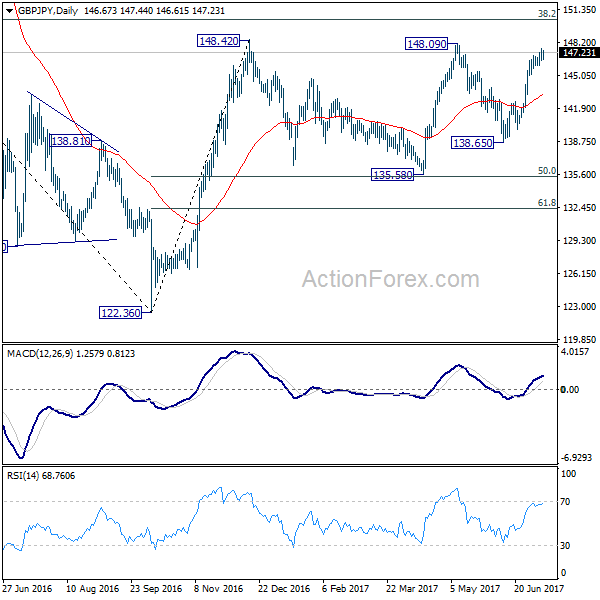
Upside momentum in GBP/JPY remains a bit weak. Still, with 146.03 minor support intact, further rise is expected for 148.09/42 resistance zone. Decisive break there will extend whole rally from 122.36 to long term fibonacci level at 150.43 next. Nonetheless, break of 146.03 minor support will indicate short term topping. In such case, bias will be turned back to the downside for pull back towards 55 day EMA (now at 143.30).
In the bigger picture, rise from medium term bottom at 122.36 is expected to continue to 38.2% retracement of 196.85 to 122.36 at 150.43. Decisive break there will carry long term bullish implications and pave the way to 61.8% retracement at 167.78. In case the sideway pattern from 148.42 extends, we'd be looking for strong support from 135.58 and 50% retracement of 122.36 to 148.42 at 135.39 to contain downside.