
Sample Category Title
Elliott Wave Analysis: USD Index Showing First Signs Of A Reversal, More Upside In View
USD Index is turning up from recent 95.45 lows where market might have accomplished a bigger impulsive drop down in wave C. That said, current bounce can be a new change in trend, maybe even part of a big impulsive rally, but as always we need to focus on minimum expectation which is a recovery up to the upper channel line, towards 96.70.
USD Index, 4H
Forex Technical Analysis: EUR/USD, USD/JPY, GBP/USD
EUR/USD
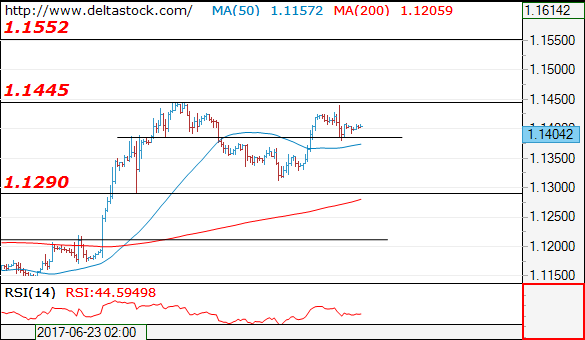
Current level - 1.1404
The initial reaction after the test of 1.1445 led to a dip to 1.1380 support and there is an intraday risk of diving lower, for the final leg of the prolonged consolidation pattern. The outlook on the senior frames remains bullish, for 1.1550.
| Resistance | Support | ||
| intraday | intraweek | intraday | intraweek |
| 1.1445 | 1.1550 | 1.1380 | 1.1020 |
| 1.1550 | 1.1610 | 1.1290 | 1.0838 |
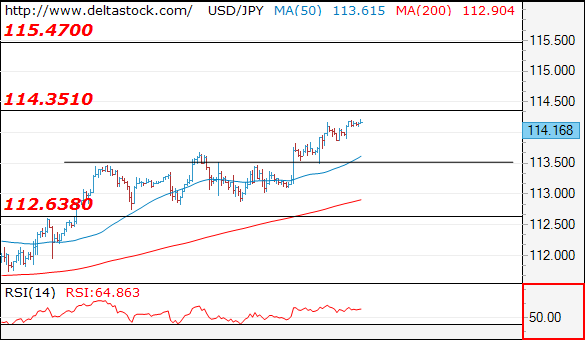
USD/JPY
Current level - 114.16
The bias is positive and my outlook is bullish, for a rise towards 115.40 area. Key support lies at 113.50.
| Resistance | Support | ||
| intraday | intraweek | intraday | intraweek |
| 114.30 | 114.30 | 113.50 | 110.30 |
| 115.40 | 115.50 | 112.60 | 108.81 |
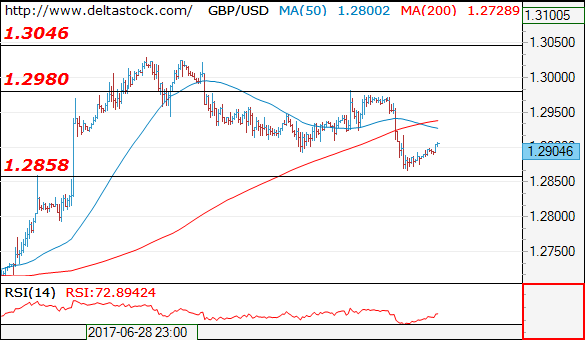
GBP/USD
Current level - 1.2904
The recent slide from 1.2980 led to a tight test at 1.2860 support and my outlook is already positive, for a renewal of the general uptrend towards 1.3050.
| Resistance | Support | ||
| intraday | intraweek | intraday | intraweek |
| 1.2980 | 1.3130 | 1.2860 | 1.2635 |
| 1.3130 | 1.3500 | 1.2790 | 1.2480 |
EUR/JPY Daily Outlook
Daily Pivots: (S1) 129.30; (P) 129.71; (R1) 130.25; More...
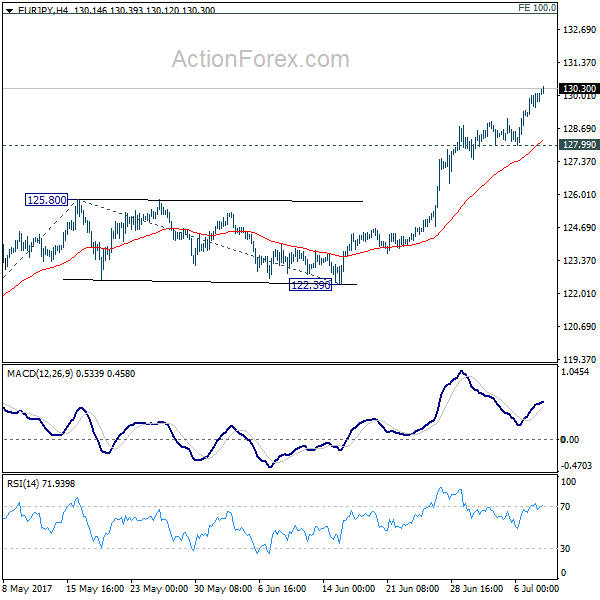
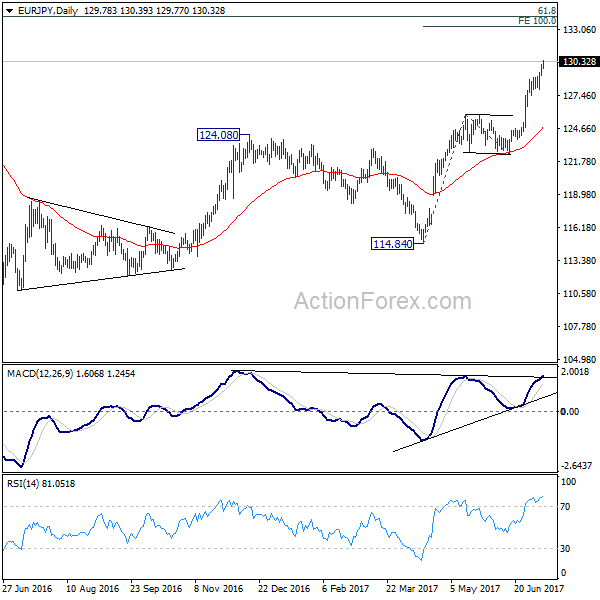
EUR/JPY rises further to as high as 130.39 so far and intraday bias remains on the upside for 100% projection of 114.84 to 125.80 from 122.39 at 133.35 next. On the downside, break of 127.99 support is needed to indicate short term topping. Otherwise, outlook will remain bullish in case of retreat.
In the bigger picture, the break of 126.09 support turned resistance should have confirmed completion of down trend form 149.76 (2014 high), at 109.03 (2016 low). Current rise from 109.03 would now target 61.8% retracement of 149.76 to 109.03 at 134.20 and above. Medium term outlook will remain bullish as long as 122.39 support holds.
Yen Stays Weak in Quiet Start, G20 Shrugged
Yen stays weak in an otherwise quiet start to the week. G20 meeting didn't give impact to the markets. Global leaders pledge to continue to "fight protectionism including all unfair trade practices" and "recognize the role of legitimate trade defense instruments in this regard." While leaders have taken note of US's withdrawal from the climate accord, all but US "agree that the Paris Agreement" is irreversible. Regarding migration, G20 somewhat toughen up and said that "we emphasize the sovereign right of states to manage and control their borders and in this regard to establish policies in their own national interests and national security, as well as the importance that repatriation and reintegration of migrants who are not eligible to remain be safe and humane."
BoJ offered another upbeat assessment on economy
In a BoJ quarterly report, the central bank upgraded the assessment on regional Japan. Six regional economies are described as "expanding moderately" or "moving toward a moderate expansion". That's seen as the most upbeat language since 2005. BoJ Governor Haruhiko Kuroda also said that "Japan's economy is expected to continue expanding moderately ahead." Nonetheless, Kuroda also remained cautious and reiterated the pledge to maintain ultra-loose monetary policy until the 2% inflation target is met. Released from Japan, machines orders dropped -3.6% mom in May versus expectation of 0.7% mom rise. Current account surplus narrowed to JPY 1.40T in May. Eco Watchers sentiment rose to 50 in June.
ECB Villeroy: Next fall is time to adapt the intensity of stimulus
In Eurozone, ECB Governing Council member Francois Villeroy de Galhau said that it will be the central bank's decision "next fall" on "on adapting the intensity" of the monetary policy that "progress toward our inflation target and toward economic recovery." He used the phrase "adapt the intensity" a total of three times. That is seen by analysts as sign that ECB could pare back stimulus that would have least impact to tighten up financial conditions. Executive Board member Benoit Coeure also said last Friday that the central bank's decision to lower monthly bond purchase from EUR 80b to 60b is a guide for future policy adjustments. For now, markets generally expect ECB to announce a tapering plan in September that would bring down monthly asset purchase to zero in 2018.
Elsewhere
China PPI was unchanged at 1.5% yoy in June. PPI also unchanged at 5.5% yoy. German trade surplus widened slightly to EUR 20.3b in May. Eurozone Sentix investor confidence will be release in European session. US will release labor market conditions index. Looking ahead, the economic calendar is not particularly heavy this week. BoC rate decision is the main focus and recent developments are setting up for a 25bps rate hike to 0.75%. UK job data will be watched as recent disappointing data cooled some BoE hike expectations. US will release PPIU and CPI. But most attention will be on Fed chair Janet Yellen's testimony .
Here are some highlights for the week ahead:
- Tuesday: Australia NAB business confidence, home loans; Japan machine tools orders; Canada housing starts
- Wednesday: Japan tertiary industry index; UK employment; Eurozone industrial production; BoC rate decision
- Thursday: China trade balance; German CPI final; Swiss PPI; Canada housing starts; US PPI, jobless claims; Fed chair Yellen testimony
- Friday: Eurozone trade balance; US CPI, retail sales, industrial production, U of Michigan sentiment; business inventories
EUR/JPY Daily Outlook
Daily Pivots: (S1) 129.30; (P) 129.71; (R1) 130.25; More...
EUR/JPY rises further to as high as 130.39 so far and intraday bias remains on the upside for 100% projection of 114.84 to 125.80 from 122.39 at 133.35 next. On the downside, break of 127.99 support is needed to indicate short term topping. Otherwise, outlook will remain bullish in case of retreat.
In the bigger picture, the break of 126.09 support turned resistance should have confirmed completion of down trend form 149.76 (2014 high), at 109.03 (2016 low). Current rise from 109.03 would now target 61.8% retracement of 149.76 to 109.03 at 134.20 and above. Medium term outlook will remain bullish as long as 122.39 support holds.
Economic Indicators Update
| GMT | Ccy | Events | Actual | Forecast | Previous | Revised |
|---|---|---|---|---|---|---|
| 23:50 | JPY | Machine Orders M/M May | -3.60% | 1.70% | -3.10% | |
| 23:50 | JPY | Current Account (JPY) May | 1.40T | 1.63T | 1.81T | |
| 1:30 | CNY | CPI Y/Y Jun | 1.50% | 1.60% | 1.50% | |
| 1:30 | CNY | PPI Y/Y Jun | 5.50% | 5.50% | 5.50% | |
| 5:00 | JPY | Eco Watchers Survey Current Jun | 50 | 49 | 48.6 | |
| 6:00 | EUR | German Trade Balance (EUR) May | 20.3B | 20.3B | 19.8B | |
| 8:30 | EUR | Eurozone Sentix Investor Confidence Jul | 28.1 | 28.4 | ||
| 14:00 | USD | Labor Market Conditions Index Change Jun | 2.3 |
US Dollar Trades Mixed On Payrolls Report
The US dollar closed on Friday with some modest gains following a broadly better than expected jobs report. Data from Labor department showed that payrolls increased 222,000 in the month of June. This was higher than the estimates of 173,000 that was forecast by economists. The unemployment rate inched higher to 4.4%, from 4.3% previously while average earnings remained steady at 2.5% on the year.
The greenback was mixed as the currency posted gains across the board, but the Canadian dollar managed to emerge on the top last Friday. This was followed by the Australian and the Kiwi dollars which posted gains.
Looking ahead, the economic calendar today is light. China's inflation figures released earlier in the day showed that consumer prices rose 1.5% on the month, missing estimates of 1.6% increase. China's producer prices index was also steady, rising 5.5%, same as the previous month.
The German trade balance figures and the Eurozone Sentix investor confidence will be the other data points that will be released later today.
EURUSD intraday analysis
EURUSD (1.1402): The EURUSD attempted to rally back to the $1.1400 handle last week. The positive gains on Thursday were partly erased by Friday's declines as EURUSD closed at 1.1403. In the short term, price action is likely to trade within a range ahead of key events this week that includes the semi-annual testimony to Congress by Fed Chair, Janet Yellen. The lower high formed in EURUSD on the 4-hour chart suggests that price action could be biased lower. Support is seen at 1.1357 followed by 1.1300. A breakdown below this level could see the common currency post further declines. However, if support is established at 1.1357 or 1.1300, then expect further gains with the currency pair likely to remain consolidating above this level.
GBPUSD intraday analysis
GBPUSD (1.2893): The British pound posted strong declines on Friday after price reversed near the resistance level of 1.2975 as expected. The declines came as the UK's industrial and manufacturing production data was weaker than expected. Industrial output fell 0.1% while manufacturing production declined 0.2% on the month. The GBPUSD fell to a 7-day low, closing on Friday at 1.2893. Price action is currently looking to retrace some of those declines but resistance at 1.2900 could likely cap the retracement. This will confirm a decline in GBPUSD towards 1.2800 where support is very likely to be tested.
USDJPY intraday analysis
USDJPY (114.14): The USDJPY continues its ascent with prices now seen trading near the 114.00 handle. The strong gains have managed to push USDJPY closed to testing the May 10th highs of 114.37. Establishing resistance here could see a short-term decline back to the lower support at 112.00. However, a breakout above 114.37 could keep the bullish momentum going. In the near term, watch for support at 113.36 which has already witnessed some strong consolidation.
GBPJPY Bullish In The Short- And Medium-Term, Eyes One-Month High
GBPJPY has advanced by nearly half a percent in today’s trading so far, eyeing Friday’s one-month high of 147.60.
The short-term momentum as depicted by the RSI is bullish. Specifically, the indicator is well above its 50 neutral-perceived level and currently maintains a positive slope. Notice though that at 69, it is close to the 70 overbought level.
If the price keeps advancing, resistance could be met around Friday’s high of 147.60. Further up, a potential psychological level, namely the 148.00 handle, combined with the seven-month high of 148.10 from May 10, might form an additional barrier to the upside.
Should the price decline, the area around the 146.00 handle, which is another potential psychological level that was of significance in the recent past, could provide support. Further declines would shift the focus to the area around the current level of the 50-day moving average (MA) at 143.96 for additional support.
Regarding the medium-term outlook, the pair recorded a bullish cross in January. This is a positive medium-term signal whose strength is supported by the price being above the 50- and 200-day MAs, as well as by both MAs currently being upward sloping. The divergence between the price and the two MAs could be a sign of an overextended rally though.
Overall, both the short- and medium-term are currently bullish.
EURUSD Consolidates Around 1.14, Maintains Bullish Trend
EURUSD is consolidating around the key psychological level at 1.1400. After hitting a 13-month high of 1.1445 on June 29, there was a slight pullback since the market reached overbought conditions, as was indicated by the RSI rising to 70.
Upside momentum has weakened and a neutral phase is expected in the near term. Any corrective move lower would likely find support at 1.1290. This is considered to be an important level since it was recently tested as both support and resistance. Further weakness below this level may see EURUSD slip towards 1.1108. A break from here would target 1.0822, which is where the 200-day moving average converges and was also a level previously tested as support and resistance.
Looking at the bigger picture, the uptrend that started from the January 3 low of 1.0340 to the June 29 high of 1.1445 is still intact. There are no signs of a reversal in the uptrend yet. The risk is to the upside based on the bullish market structure on the daily chart. There was a bullish crossover of the 50-day MA with the 200-day MA on May 23, while the 50-day MA is still rising. RSI remains in bullish territory above 50. All these technical signals highlight the bullish bias in the market.
A successful break above the 1.1445 high would open the way towards the key 1.1500 area with scope to target the May 3, 2016 peak of 1.1616. Such a move would strengthen the medium-term bullish bias.
Market Update – Asian Session: China CPI/PPI In Line And BOJ Affirms Policy Stance
Asia Summary
Markets take a risk on sentiment at the start of the week, seemingly unconcerned about the G20 who met over the weekend in Hamburg, Germany among heavy protesting. The Communique was fairly standard, reiterating to fight protectionism and secure free trade. New elements include to agree by November steps to reduce global overcapacity of steel and in afirst ever dissent: 19 members affirmed the Paris accord with the US (dissenter) saying it will help other countries "access and use fossil fuels more cleanly and efficiently."
Japan govt cut its assessment of machinery orders for the first time since September 2016 after May orders fell 3.6% m/m and only rose 0.6% y/y v the expected 7.6%. USD/JPY rose 0.1% to 113.99 after the data and later tested 114.20. The PBOC again skipped open market operations for the 12th consecutive day, while local press highlighted financial stability as a major topic for the National Financial Work Conference, which will start in mid-July. CPI and PPI were a non-event in the session.
Global shipping names rallied after Cosco Shipping (1919.HK) confirmed it will acquire Orient Overseas for HK$78.67/shr in a HK$49.2B deal. Maersk gave their support of the deal, saying consolidation would be good for the industry.
Key economic data
(CN) CHINA JUN CPI M/M: -0.2% V -0.1% PRIOR; Y/Y: 1.5% V 1.6%E
(CN) CHINA JUN PPI Y/Y: 5.5% V 5.5%E
(JP) JAPAN JUN BANK LENDING (INC TRUSTS) Y/Y: 3.3% V 3.2%E; BANK LENDING (EX-TRUSTS) Y/Y: 3.3% V 3.3%E
(JP) JAPAN MAY TOTAL CURRENT ACCOUNT: ¥1.65T V ¥1.79TE; ADJ TOTALCURRENT ACCOUNT: ¥1.40T V ¥1.63TE; TRADE BALANCE BOP BASIS: -¥115.1B V -¥45.0BE
(JP) JAPAN MAY MACHINE ORDERS M/M: -3.6% V 1.7%E; Y/Y: 0.6% V 7.6%E
(JP) Japan Jun Bankruptcies Y/Y: -7.5% v 19.5% prior
Speakers and Press
China
(CN) China Head of State Administration of Foreign Exchange (SAFE) Pan Gongsheng said no intention of devaluing yuan currency to boost its competitiveness – financial press
(CN) Overseas M&A expected to be major talking point at National Financial Work Conference in mid-July - SCMP
Japan
(JP) Bank of Japan (BOJ) Gov Kuroda: Economy is turning towards moderate expansion; BOJ will continue to adjust policy as needed
(JP) According to Yomiuri poll Japan PM Abe approval rating fell to 36% from 49% in June (lowest reading since being in office)
Australia/New Zealand
(AU) Australia Department of Industry, Science and Innovation: Iron ore will sink back below $50/ metric ton next year as global supply expands and demand moderates in China
(NZ) New Zealand Ministry of Business, Innovation and Employment: Find no evidence of China steel coil dumping
US
(US) Fed's Kashkari says large banks need to raise 'much more' equity - US financial press
Asian Equity Indices/Futures (00:30ET)
Nikkei +0.8%, Hang Seng 1.0%, Shanghai Composite -0.2%, ASX200 +0.5%, Kospi +0.3%
Equity Futures: S&P500 +0.2%; Nasdaq +0.4%, Dax +0.2%, FTSE100 +0.3%
FX ranges/Commodities/Fixed Income (00:30ET)
EUR 1.1409-1.1390; JPY 114.20-113.89; AUD 0.7615-0.7596; NZD 0.7281-0.7265
Aug Gold +0.1% at 1,210/oz; Aug Crude Oil +-0.8% at $44.58/brl; Sept Copper +0.2% at $2.66/lb
(AU) Australia repurchases A$500M in Oct 2018 and March 2019 bonds
(CN) PBoC skips open market operations (12th straight session)
(CN) PBOC SETS YUAN REFERENCE RATE AT 6.7964 V 6.7914 PRIOR
(KR) Bank of Korea (BOK) sells KRW1.20T v KRW1.2T offered in 1-yr monetary stabilization bonds; avg yield 1.46% v 1.47% prior
(KR) South Korea sells 5-year bonds at 1.985%
(JP) Japan 5-year JGB yield hits highest level since Jan 2016, near -0.03%
Asia equities notable movers
Australia
Bellamy's Australia, BAL.AU China suspends export licence of newly acquired canning facility
Ardent Leisure Group,AAD.AU Reports June theme park unit visitation -30.5% y/y, Rev A$4.4M, -35.3% y/y; +2.5%
88 Energy,88E.AU Gives update on Project Icewine, located onshore North Slope of Alaska; -25.5%
Japan
KDDI Corp, 9433.JP President comments on mobile price cuts: Says price cuts needed to compete with Mvnos; -3.1%
Hong Kong/China
316.HK China COSCO Shipping Holdings confirms to bid HK$49.2B ($6.3B) or HK$78.67/share in cash for Orient Overseas International (~31% premium); +24.2%
China Life, 2628.HK China Development said to seek to buy up to 25.3% of China Life - US financial press; +0.4%
US
MYCC To be acquired by Apollo Global Management for $17.12/shr cash (~31% premium); declares one time dividend of $0.13
PBR Federal Court of Appeals in New York partially grants appeal related to class action
WFC Court Grants Preliminary Approval of $142M Settlement in Wells Fargo Unauthorized Accounts Class Action
US market Friday Summary
US stock markets moved up after the June jobs report offered more of the same for investors and the Fed to ponder. Fears that the Fed might have made (or is about to make) a policy mistake should ease, but the data are likely to suggest to the Fed that there is no urgency about raising rates again soon. Job growth accelerated ahead of forecasts, but wage growth came up short of expectations once again. The unemployment rate ticked up along with the participation rate, indicating some slack likely still exists for the US labor market. The NASDAQ reversed course once again, adhering to the fickle nature of trade that has engulfed technology stocks in recent weeks. Along with the strength in technology, homebuilding stocks move higher along with healthcare and deep cyclical sectors. The energy complex moved lower along with crude oil prices.
US rates drifted higher, while the Treasury curve continued to steepen, and TIPS breakeven spreads came off, helped by the decline in oil prices. The US Dollar firmed almost across the board, with the exception being the Loonie. The Canadian Dollar surged after a Canada jobs report crushed expectations. The Yen remained under pressure after the BOJ offered to buy unlimited amount in fixed-rate bonds as part of their yield control operations. Gold prices dropped back towards the 1200 mark, hitting that level for the first time since March.
US Data Brings On USD Bulls
U.S. job growth surged more than expected in June and employers increased hours for workers, with signs of a labor market strengthening that is likely to keep the Federal Reserve on course for a 3rd interest rate increase this year, despite lackluster inflation. Non-farm payrolls increased by 222,000 jobs in June beating expectations for a 179,000 gain. Data for April and May was revised to show 47,000 more jobs were created than previously reported. US unemployment rose to 4.4%, from a 16-year low of 4.3%, because more people were looking for work; a sign of confidence in the labor market. The jobless rate has dropped 0.4% this year and is close to the most recent Fed median forecast for 2017.
UK data released on Friday showed output by British factories unexpectedly fell in May, indicating that the UK economy has struggled to gain any momentum after a slow start to 2017 and further raising questions about the likelihood of the Bank of England raising interest rates this year. Markets were expecting an increase of 0.5% in Manufacturing Production (MoM) but were surprised with a very poor reading of -0.2%. GBPUSD reacted immediately dropping from 1.2955 to 1.28664 (-0.7%) whilst EURGBP climbed from 0.87964 to 0.88602 (+0.55%). GBPUSD is currently trading around 1.2905 and EURGBP around 0.8840.
The G20 meeting in Hamburg over the weekend had little to no impact on the markets. The highlights were the first-time meetings of Trump, Putin & Xi Jinping. The general undertone was that this was the G19 plus 1 meeting as the US was not a particularly welcome attendee.
USDJPY initially dropped by 0.6% on Friday, to trade as low as 113.148, before rebounding higher following the NFP to reach a high of 114.176 – a 0.8% increase on the day. In early trading USDJPY is around 114.15.
EURUSD had a similar story reaching a high of 1.14393 after the data release before retracing down to a low of 1.13791 a relatively small loss of 0.2% on the day. Currently EURUSD is trading around 1.1410.
Gold had heavy selling pressure, dropping 1% on Friday to trade as low as $1,207.17 – close to a 4-month low. Gold is down over 1.6% on the week resulting in its worst performance since May. Currently Gold is trading around $1,212.
WTI closed down 4% on the week as the decline in US inventories did not convince traders that global production was anywhere near rebalancing. On Friday WTI traded down 1.8% to hit a low of $43.88pb. Currently WTI is trading around $44.65pb.
Today & Tomorrow is light on impactful economic data releases – traders are focusing on Wednesday July 12 when, at 09:30 BST, the UK will release its Average Earnings Index followed, at 15:00 BST, by the Bank of Canada interest rate decision and Fed Chair Yellen’s Testimony.
The Week Ahead: Will Janet Yellen Provide Additional Support To The Greenback?
After testing a nine-month low late June, the U.S. dollar finally managed to gather some momentum last week to end higher against most of its counterparts, thanks to the latest jobs report. The U.S. economy added 222 thousand jobs in June and job creations in April and May were revised higher. Nonetheless, unemployment ticked slightly higher to 4.4% in June from 4.3% May, but this may also be considered a positive development with more Americans joining the Labor force.
The initial reaction of the greenback and Treasury yields after the release was kind of mixed. In fact, there was a tug of war between bulls and bears suggesting that some market participants were not entirely convinced in the overall report. This is due to lack of significant wage growth which has been disappointing for many months now.
Fed Chair Janet Yellen is a big believer of the Phillips Curve which suggests that inflation has an inverse relation with unemployment. However, without wage growth and inflationary pressures it is hard to convince markets that interest rates will increase at the pace suggested by monetary policy makers. Given that the U.S. economy is at full employment levels one questions why wage growth is not accelerating? Probably there isn’t a one simple explanation to this question, but it could be due to the weak bargaining power of employers, globalization which allows U.S. companies to shift production where cost is cheaper, shrinking productivity, a decline of union power, and the list goes no. Though the problem is clearly structural here and if investors remain skeptical that wages will rise soon any rise in the dollar will be limited.
Janet Yellen’s will try to give an explanation on why wage growth is still missing in her semiannual testimony before Congress on Thursday. Overall, I believe she will be optimistic and reiterate the same hawkish tone from the last monetary policy statement. She is still convinced that inflation is on the upside and the latest jobs report will not change her mind. So again dollar bulls will likely find the needed support to encourage them to go long on USD.
On the U.S. data front, it is a busy week with many tier-one economic releases. Producer and consumer prices will be closely scrutinized as markets remain divided on how the Fed will respond to low inflation levels. Retail sales are also a key figure to watch on Friday to see if American people are encouraged to spend after the 0.3% dip in May. Fed’s Beige Book, consumer credit industrial production, and Michigan consumer sentiment are also on the calendar next week.
The Canadian dollar was the only outlier last week, which managed to beat the USD and hit a new 10-month high despite the fall in oil prices. Although it was not given much attention, the Canadian economy added 45 thousand jobs in June, sending unemployment 0.1% lower to 6.5%. The recent upbeat economic releases added further to the speculation that Bank of Canada will likely raise interest rates when it meets on Wednesday. However, I think it is not a done deal yet. With low oil prices, strong currency, drop in home sales, and uncertainty on NAFTA negotiations the central bank will have to think twice. Given that many market participants have started to price in a rate hike on Wednesday, the Loonie has more downside risk than the upside. However, traders should be prepared for surprises.