
Sample Category Title
US Data Brings On USD Bulls
U.S. job growth surged more than expected in June and employers increased hours for workers, with signs of a labor market strengthening that is likely to keep the Federal Reserve on course for a 3rd interest rate increase this year, despite lackluster inflation. Non-farm payrolls increased by 222,000 jobs in June beating expectations for a 179,000 gain. Data for April and May was revised to show 47,000 more jobs were created than previously reported. US unemployment rose to 4.4%, from a 16-year low of 4.3%, because more people were looking for work; a sign of confidence in the labor market. The jobless rate has dropped 0.4% this year and is close to the most recent Fed median forecast for 2017.
UK data released on Friday showed output by British factories unexpectedly fell in May, indicating that the UK economy has struggled to gain any momentum after a slow start to 2017 and further raising questions about the likelihood of the Bank of England raising interest rates this year. Markets were expecting an increase of 0.5% in Manufacturing Production (MoM) but were surprised with a very poor reading of -0.2%. GBPUSD reacted immediately dropping from 1.2955 to 1.28664 (-0.7%) whilst EURGBP climbed from 0.87964 to 0.88602 (+0.55%). GBPUSD is currently trading around 1.2905 and EURGBP around 0.8840.
The G20 meeting in Hamburg over the weekend had little to no impact on the markets. The highlights were the first-time meetings of Trump, Putin & Xi Jinping. The general undertone was that this was the G19 plus 1 meeting as the US was not a particularly welcome attendee.
USDJPY initially dropped by 0.6% on Friday, to trade as low as 113.148, before rebounding higher following the NFP to reach a high of 114.176 – a 0.8% increase on the day. In early trading USDJPY is around 114.15.
EURUSD had a similar story reaching a high of 1.14393 after the data release before retracing down to a low of 1.13791 a relatively small loss of 0.2% on the day. Currently EURUSD is trading around 1.1410.
Gold had heavy selling pressure, dropping 1% on Friday to trade as low as $1,207.17 – close to a 4-month low. Gold is down over 1.6% on the week resulting in its worst performance since May. Currently Gold is trading around $1,212.
WTI closed down 4% on the week as the decline in US inventories did not convince traders that global production was anywhere near rebalancing. On Friday WTI traded down 1.8% to hit a low of $43.88pb. Currently WTI is trading around $44.65pb.
Today & Tomorrow is light on impactful economic data releases – traders are focusing on Wednesday July 12 when, at 09:30 BST, the UK will release its Average Earnings Index followed, at 15:00 BST, by the Bank of Canada interest rate decision and Fed Chair Yellen’s Testimony.
The Week Ahead: Will Janet Yellen Provide Additional Support To The Greenback?
After testing a nine-month low late June, the U.S. dollar finally managed to gather some momentum last week to end higher against most of its counterparts, thanks to the latest jobs report. The U.S. economy added 222 thousand jobs in June and job creations in April and May were revised higher. Nonetheless, unemployment ticked slightly higher to 4.4% in June from 4.3% May, but this may also be considered a positive development with more Americans joining the Labor force.
The initial reaction of the greenback and Treasury yields after the release was kind of mixed. In fact, there was a tug of war between bulls and bears suggesting that some market participants were not entirely convinced in the overall report. This is due to lack of significant wage growth which has been disappointing for many months now.
Fed Chair Janet Yellen is a big believer of the Phillips Curve which suggests that inflation has an inverse relation with unemployment. However, without wage growth and inflationary pressures it is hard to convince markets that interest rates will increase at the pace suggested by monetary policy makers. Given that the U.S. economy is at full employment levels one questions why wage growth is not accelerating? Probably there isn’t a one simple explanation to this question, but it could be due to the weak bargaining power of employers, globalization which allows U.S. companies to shift production where cost is cheaper, shrinking productivity, a decline of union power, and the list goes no. Though the problem is clearly structural here and if investors remain skeptical that wages will rise soon any rise in the dollar will be limited.
Janet Yellen’s will try to give an explanation on why wage growth is still missing in her semiannual testimony before Congress on Thursday. Overall, I believe she will be optimistic and reiterate the same hawkish tone from the last monetary policy statement. She is still convinced that inflation is on the upside and the latest jobs report will not change her mind. So again dollar bulls will likely find the needed support to encourage them to go long on USD.
On the U.S. data front, it is a busy week with many tier-one economic releases. Producer and consumer prices will be closely scrutinized as markets remain divided on how the Fed will respond to low inflation levels. Retail sales are also a key figure to watch on Friday to see if American people are encouraged to spend after the 0.3% dip in May. Fed’s Beige Book, consumer credit industrial production, and Michigan consumer sentiment are also on the calendar next week.
The Canadian dollar was the only outlier last week, which managed to beat the USD and hit a new 10-month high despite the fall in oil prices. Although it was not given much attention, the Canadian economy added 45 thousand jobs in June, sending unemployment 0.1% lower to 6.5%. The recent upbeat economic releases added further to the speculation that Bank of Canada will likely raise interest rates when it meets on Wednesday. However, I think it is not a done deal yet. With low oil prices, strong currency, drop in home sales, and uncertainty on NAFTA negotiations the central bank will have to think twice. Given that many market participants have started to price in a rate hike on Wednesday, the Loonie has more downside risk than the upside. However, traders should be prepared for surprises.
Daily Technical Analysis: EUR/USD Trapped Between Resistance Top And Wave 4 Fibonacci
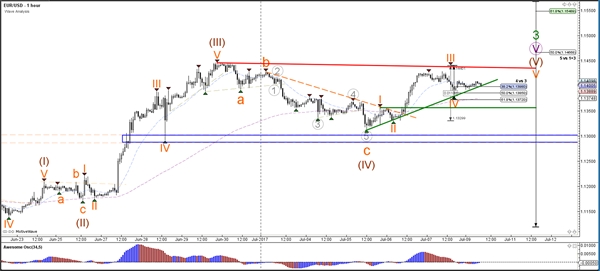
Currency pair EUR/USD
The EUR/USD bullish bounce at support (blue) was unable to break above the previous top (red). A bullish breakout above the top could see price move towards the Fibonacci target of wave 5 vs 1+3 and the round level of 1.15.
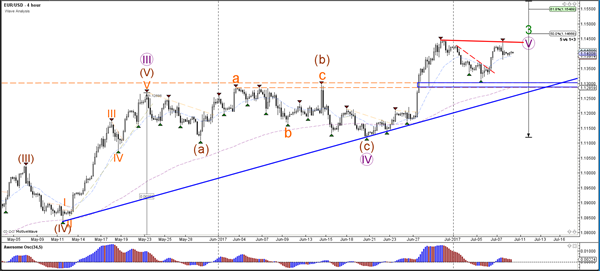
The EUR/USD retraced back and bounced at the Fibonacci levels of wave 4 vs 3. The wave 4 (orange) becomes unlikely if price breaks below the 61.8% Fibonacci level.
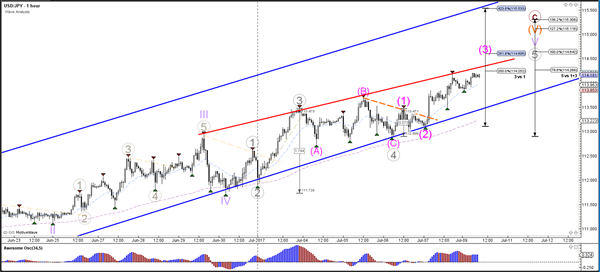
Currency pair USD/JPY
The USD/JPY uptrend continues within the uptrend channel (blue) and is moving towards the Fibonacci targets of wave 5 vs 1+3. The price angle however is slowing down (red resistance).
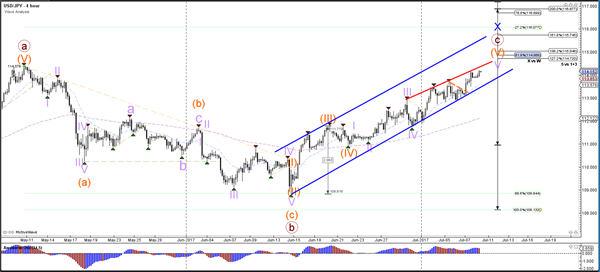
The USD/JPY broke above resistance (dotted orange) which could indicate a wave 3 (pink) breakout.
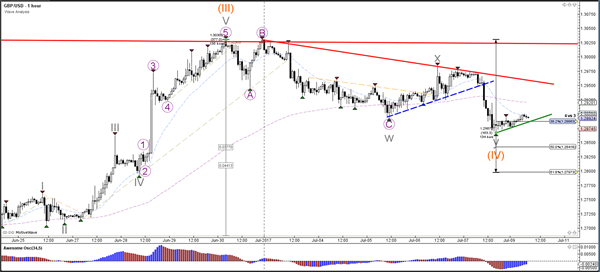
Currency pair GBP/USD
The GBP/USD retraced to deeper Fibonacci support levels of wave 4 vs 3 (orange). A bullish bounce could confirm the wave 4-5 (orange).
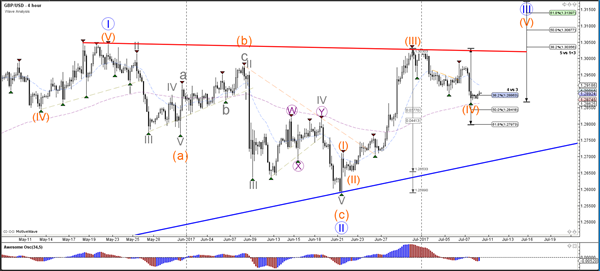
The GBP/USD could have completed a wave 4 (orange) as long a price stays above the 61.8% Fibonacci level.
Central Banks Remain The Focus This Week
- Will there be any substance to BoC hawkish warnings?
- Central bank policy makers scheduled to appear throughout the week;
- Oil pares losses but remains under pressure;
- Yen stumbles again after weaker data, with BoJ bond buying also weighing.
Central banks are likely to remain a key focus for investors this week, with the sudden hawkish shift among a number of them in recent weeks pushing bond yields higher and weighing on risk appetite.
This sudden and seemingly coordinated move from a number of central banks including the ECB, Bank of England and Bank of Canada, caught investors a little off-guard, forcing them to start pricing in a tightening of monetary policy that previously appeared very unlikely. We’ll see just how much substance there is to these comments on Wednesday, when the BoC announces its latest decision, with investors now expecting a 25 basis point increase.
It’s not exactly clear why we’ve seen a sudden change of heart from central banks all of a sudden but it seems clear that something has spooked them into action and should they follow through, further tightening may need to be priced in. While the impact of this hasn’t weighed too heavily on equity markets so far, it does appear to have taken the edge off the rally and may continue to do so in the coming months.
A number of policy makers across the major central banks are scheduled to appear throughout the week, which under the circumstances will likely draw a lot of attention. Monday will be a little quiet though on that front, with only John Williams of the Federal Reserve – a non-voter this year – scheduled to appear. Instead we’ll have to focus on the data, with eurozone investor confidence and US labour market conditions and consumer credit numbers due to be released.
Oil has started the week on a positive note, trading around 1% higher overnight, although this is perhaps nothing more than a little profit taking with Brent and WTI falling that 7% from last week’s high at one stage. The yen is under pressure once again, with softer machinery orders and current account data chipping away at the currency. This also comes after the Bank of Japan took the opposite stance to other central banks and increased its bond buying last week in an attempt to offset higher yields.
Aussie Trading Higher In The Morning Session
For the 24 hours to 23:00 GMT, the AUD rose 0.22% against the USD and closed at 0.7600 on Friday.
LME Copper prices declined 0.3% or $19.5/MT to $5809.0/MT. Aluminium prices declined 0.3% or $5.5/MT to $1920.0/MT.
In the Asian session, at GMT0300, the pair is trading at 0.7612, with the AUD trading 0.16% higher against the USD from Friday's close.
Earlier today in China, Australia's largest trading partner, the consumer price index (CPI) advanced 1.5% on an annual basis in June, lower than market expectations for an advance of 1.6%. The CPI had registered a similar rise in the prior month. Moreover, the nation's producer price index (PPI) rose 5.5% YoY in June, meeting market expectations and compared to a similar rise in the prior month.
The pair is expected to find support at 0.7582, and a fall through could take it to the next support level of 0.7551. The pair is expected to find its first resistance at 0.7633, and a rise through could take it to the next resistance level of 0.7653.
Going ahead, market participants will focus on Australia's NAB business confidence index for June, slated to release overnight.
The currency pair is trading above its 20 Hr and 50 Hr moving averages.

German Industrial Production Surged To A 3-Month High Level In May
For the 24 hours to 23:00 GMT, the EUR declined 0.18% against the USD and closed at 1.1401 on Friday.
On the economic front, Germany's seasonally adjusted industrial production rose 1.2% on a monthly basis in May, advancing by the most since February 2017 and surpassing market expectations for a gain of 0.2%. In the previous month, industrial production had registered a revised rise of 0.7%.
The greenback gained ground against most of its major counterparts, following robust non-farm payrolls data in the US.
Non-farm payrolls indicated that the US economy added 222.0K jobs in June, adding the most number of jobs since February, signalling that strength in the nation's labour market is strong enough to warrant one more interest rate hike this year by the Federal Reserve. Non-farm payrolls had recorded a revised increase of 152.0K in the previous month, while markets had expected for an advance of 178.0K. However, the nation's average hourly earnings of all employees climbed less-than-expected by 0.2% MoM in June, highlighting that wage growth remains anaemic despite strong hiring in the world's largest economy. Investors had anticipated average hourly earnings of all employees to gain 0.3%, following a revised rise of 0.1% in the previous month. Also, the nation's unemployment rate nudged up to 4.4% in June, while markets participants had envisaged the unemployment rate to remain steady at 4.3%.
In the Asian session, at GMT0300, the pair is trading at 1.1405, with the EUR trading marginally higher against the USD from Friday's close.
The pair is expected to find support at 1.1377, and a fall through could take it to the next support level of 1.1348. The pair is expected to find its first resistance at 1.1437, and a rise through could take it to the next resistance level of 1.1468.
Moving ahead, investors will look forward to the Euro-zone's Sentix investor confidence index for July and Germany's trade balance figures for May, slated to release in a few hours. Moreover, the US labour market conditions index for June, set to release later in the day, will be eyed by traders.
The currency pair is showing convergence with its 20 Hr moving average and trading above its 50 Hr moving average.

UK’s Manufacturing And Industrial Production Surprisingly Dropped In May, Total Trade Deficit Sharply Widened In The Same Month
For the 24 hours to 23:00 GMT, the GBP declined 0.64% against the USD and closed at 1.2886 on Friday, following dismal economic data in the UK that offered multiple signs of slowdown in Britain's economic momentum.
Data indicated that UK's industrial production unexpectedly dropped 0.1% MoM in May, defying market expectation for a rise of 0.5% and compared to an advance of 0.2% in the prior month. Further, the nation's manufacturing production surprisingly eased 0.2% on a monthly basis in May, confounding market consensus for a rise of 0.5%. Manufacturing production had advanced 0.2% in the prior month. Additionally, the nation's construction output unexpectedly declined 1.2% MoM in May, compared to market expectations for an advance of 0.7% and following a revised fall of 1.1% in the previous month.
Moreover, the nation's total trade deficit widened more-than-expected to a level of £3.1 billion in May, following a revised deficit of £2.1 billion in the prior month. Markets were expecting the nation's total trade deficit to rise to a level of £2.5 billion. Also, the nation's Halifax house price index recorded an unexpected drop of 1.0% in June, declining for the first time in 5 months and compared to a revised advance of 0.3% in the previous month. Markets were expecting the index to climb 0.2%.
On the other hand, NIESR estimated that UK's gross domestic product (GDP) climbed 0.3% in the three months to June 2017. NIESR estimated UK's economy expanded 0.2% in the March-May period.
In the Asian session, at GMT0300, the pair is trading at 1.2896, with the GBP trading 0.08% higher against the USD from Friday's close.
The pair is expected to find support at 1.2851, and a fall through could take it to the next support level of 1.2805. The pair is expected to find its first resistance at 1.2958, and a rise through could take it to the next resistance level of 1.3019.
The currency pair is showing convergence with its 20 Hr moving average and trading below its 50 Hr moving average.

Japan Posted A Trade Deficit In May
For the 24 hours to 23:00 GMT, the USD rose 0.7% against the JPY and closed at 113.92 on Friday.
On the data front, Japan's preliminary leading economic index climbed more-than-expected to a level of 104.7 in May, compared to a level of 104.2 in the prior month. Moreover, the nation's flash coincident index eased to a level of 115.5 in May, at par with market expectations. In the prior month, the index had registered a reading of 117.1.
In the Asian session, at GMT0300, the pair is trading at 114.12, with the USD trading 0.18% higher against the JPY from Friday's close.
Overnight data indicated that Japan surprisingly posted a higher-than-expected trade deficit (BOP basis) of ¥115.1 billion in May, compared to a surplus of ¥553.6 billion recorded in the preceding month, while investors had envisaged the nation to register a deficit of ¥45.0 billion. Also, the nation's machinery orders surprisingly declined 3.6% in May, compared to a fall of 3.1% in the previous month and confounding market consensus for a gain of 1.7%.
The pair is expected to find support at 113.68, and a fall through could take it to the next support level of 113.24. The pair is expected to find its first resistance at 114.38, and a rise through could take it to the next resistance level of 114.64.
The currency pair is trading above its 20 Hr and 50 Hr moving averages.

Switzerland’s Unemployment Rate Remained Unchanged In June
For the 24 hours to 23:00 GMT, the USD rose 0.34% against the CHF and closed at 0.9639 on Friday.
In economic news, Switzerland's seasonally adjusted unemployment rate remained steady at 3.2% in June, at par with market expectations.
In the Asian session, at GMT0300, the pair is trading at 0.9639, with the USD trading flat against the CHF from Friday's close.
The pair is expected to find support at 0.9611, and a fall through could take it to the next support level of 0.9584. The pair is expected to find its first resistance at 0.9660, and a rise through could take it to the next resistance level of 0.9682.
With no major economic releases in Switzerland today, investors will look forward to global events for further direction.
The currency pair is trading above its 20 Hr and 50 Hr moving averages.

Canada’s Unemployment Rate Surprisingly Fell In June, Job Growth Surged In The Same Month
For the 24 hours to 23:00 GMT, the USD declined 0.69% against the CAD and closed at 1.2888 on Friday.
The Canadian Dollar gained ground against the USD, following robust Canadian jobs report that cemented expectations of an interest rate hike later this week.
Data indicated that Canada's unemployment rate unexpectedly dropped to 6.5% In June, compared to market expectations of an unchanged reading. In the previous month, the unemployment rate had registered a reading of 6.6%. Further, the net number of people employed in Canada sharply climbed by 45.3K in June, following an increase of 54.5K in the previous month, while markets anticipated for a rise of 10.0K.
In the Asian session, at GMT0300, the pair is trading at 1.2881, with the USD trading slightly lower against the CAD from Friday's close.
The pair is expected to find support at 1.2829, and a fall through could take it to the next support level of 1.2778. The pair is expected to find its first resistance at 1.2963, and a rise through could take it to the next resistance level of 1.3046.
The currency pair is trading below its 20 Hr and 50 Hr moving averages.
