

Sample Category Title
03 – Correlations in Other Financial Markets
Aside from watching economic data releases or keeping track of central bank policy biases, monitoring other financial markets can also be helpful in predicting forex price moves. To be specific, there are currencies that move in tandem with asset prices or precious metals while others are negatively correlated to other financial markets.
For one, the Australian dollar has been observed to have a positive correlation with gold prices. This is probably because Australia is the third-largest gold producer in the world and any increases in the precious metal's value is bound to be positive for the Land Down Under's export revenues. This then translates to better growth prospects, which boost the Aussie's value.
Another interesting financial market correlation with forex is that of U.S. dollar and gold. Unlike the Australian dollar, the U.S. dollar has an inverse correlation to the precious metal's price. After all, gold is usually treated as a hedge to U.S. inflation.
Aside from that, traders tend to park their money in gold if risk appetite is strong. This takes place when global economic performance is strong and traders are more confident in pursuing riskier assets. In that case, the lower-yielding and safe-haven U.S. dollar gets dumped in favor of gold. On the other hand, when risk aversion is in play, traders buy up the U.S. dollar and let go of their gold positions.
More often than not, the Swiss franc also has a positive correlation with gold, as most of the country's reserves are linked to gold.
When it comes to other commodities and currencies, it has also been observed that crude oil and the Canadian dollar have a positive correlation. This is because Canada is one of the top oil producers in the world, with roughly $2 million worth of barrels per day. The U.S. economy is its top oil buyer, which means that rising fuel demand from the global economy can drive the Canadian dollar higher.
Aside from commodity prices, bond prices also tend to have a correlation with forex market price action. Simply put, a bond is an IOU issued by an entity to its bondholders. Bond prices and yields that are monitored by traders are usually government debt securities.
What's particularly tricky about this type of financial instrument and its correlation to currency trading is that bond yields instead of prices are usually monitored. Bond yields refer to the rate of return when one buys government bonds and these are inversely correlated to bond prices.
Bond yields usually serve as an indicator of local stock market strength. When stock prices are rising, bond yields are also rising while bond prices are falling. On the other hand, when stock prices are falling, bond yields are also dropping while bond prices are rising. In relation to the forex market, the local currency tends to move in tandem with bond yields.
Fixed income securities also show correlations with the forex market, more often than not. Economies that offer higher returns on their fixed income securities tend to have a stronger local currency while those that offer lower returns on their fixed income securities usually have a weaker local currency.
02 – Economic Releases You Can Trade
The forex economic calendar is one of the most useful tools for traders, especially those who incorporate fundamental analysis in determining their currency biases. A typical forex calendar lists the upcoming data releases and indicates whether those could have a strong or low impact on the currency involved. These also post the previous period's data results to provide the trader with a point of comparison in gauging if improvements were made, along with the market consensus.
Simply put, a stronger than expected release or one that marks a considerable improvement from the previous period's data could lead to a rally for the currency since these could eventually translate to tighter monetary policy. On the other hand, a weaker than expected release or one that is lower compared to the previous period's data could lead to a selloff for the currency since these could result to easier monetary policy.
Not all economic reports listed on the forex calendar are ideal to trade though, as some could simply generate small price reactions or serve as bigger picture indicators rather than resulting to significant short-term moves. The larger reports, such as the GDP and CPI, tend to large and prolonged price movements since these provide more or less an idea of how the economy is faring from a bird's eye view.
In particular, the GDP or gross domestic product provides a neat number that sums up how the economy fared and this is usually reported on a quarterly basis. As such, it is one of the clearest gauges of economic growth, as a positive GDP reading would mean that the economy expanded over the period while weak GDP reading would signal contraction. Consecutive quarters of economic contraction would then constitute a recession, which turns out to be very bearish for that country's currency.
The CPI or consumer price index measures changes in price levels and this is usually reported on a monthly basis. It is also closely linked to monetary policy since the central bank's mandate is to maintain price stability. When prices keep climbing, the central bank has to employ its monetary policy tools in order to prevent inflation from surging out of control. Conversely, when prices keep dropping, the central bank also has to make monetary policy adjustments in order to stoke inflationary pressures and prevent a deflationary cycle from occurring.
On the other hand, data such as producer prices or wholesale sales don't generally result to significant price moves for the currency involved. Instead, these could serve as underlying data when one is trying to predict how larger reports such as core CPI or consumer spending might turn out.
Retail sales, manufacturing production, or trade balance releases tend to have varying levels of impact depending on the currency involved. Trade-dependent exporting economies, such as Australia and New Zealand, have currencies that are more sensitive to trade balance data. Meanwhile, economies that are heavily reliant on the consumer sector have currencies that react to retail sales and household spending reports.
01 – Monetary Policy and Central Banks
Monetary policy and interest rate expectations play a central role in fundamental analysis, as these determine the rate of return for holding a country's assets and therefore the demand for its currency. As mentioned in the previous section, central banks' decisions carry a major influence in this regard.
Of course these decisions are based on a number of economic factors, including overall growth, inflation, consumer spending and confidence, and trade activity among many others. These data can be found in economic databases online and fresh releases can be tracked using an economic calendar.
Generally speaking, consistent economic improvements and expectations of strong performance could lead a central bank to tighten monetary policy. This involves decreasing the amount of money in circulation, which then causes the value of the currency to go up, or increasing interest rates. These tools are employed in order to prevent the economy from overheating or inflation from spiking out of control.
When traders see consecutive improvements in economic data, interest rate hike expectations tend to build up and push the value of the currency higher even before the actual monetary policy decision is announced.
On the other hand, consecutive declines in economic performance could convince a central bank to ease monetary policy. They can either increase the amount of money in circulation, which then causes the value of the currency to drop, or by decreasing interest rates. Both of these moves are designed to encourage lending and spending, which eventually translate to stronger economic performance.
When traders see a prolonged weakness in economic data, interest rate cut expectations grow and push the value of the currency lower even before the actual policy decision is made.
Central banks can also intervene in the foreign exchange market, as the Swiss National Bank has been notorious for doing. These are very rare occasions when the central bank thinks that the currency is overvalued and is starting to take its toll on the country's export industry. After all, a higher currency value means that exports are relatively more expensive in the international market, which could then hurt demand. A central bank can conduct currency intervention by selling a large amount of its local currency in order to drive its value down.
Testimonies by central bank officials also tend to influence forex market price action as these contain clues on what their next monetary policy moves might be. This is why central bankers' speeches are also marked on the economic calendar, usually as a top-tier event when it's the central bank head speaking.
Minutes of policy meetings also carry weight in price action, as these also provide hints on how the other members of the board think the economy is faring and whether monetary policy adjustments are needed or not. Traders usually monitor when there is a change in bias and start pricing in potential policy tightening or easing ahead of time.
00 – A Beginner’s Guide to Fundamental Analysis
What is Fundamental Analysis?
Fundamental analysis mostly refers to the use of economic data to predict forex price movements. While technical analysis focuses on historical price action and repeating behavior, fundamental analysis takes into consideration the demand and supply for a currency based on the current and expected return in holding it.
Demand and supply of a currency are influenced mostly by central banks and monetary policy. When a central bank decides to add to money supply or lowers interest rates, the value of the local currency goes down since there is more of it in circulation and the rate of return on assets denominated in that currency is lower. On the other hand, when a central bank decides to lessen money supply or increases interest rates, the value of a local currency goes up since there is less of it in circulation and the rate of return on securities denominated in that currency is higher.
What influences the central bank's decision to adjust monetary policy by adding or reducing money supply and by increasing or decreasing interest rates? This is where economic data comes in.
Bear in mind that the central bank's mandate is to maintain price stability. When an economy is doing well, inflation tends to climb and the central bank would need to tighten monetary policy by reducing money supply or hiking rates. When an economy is performing poorly, inflation tends to drop and the central bank would need to loosen monetary policy by increasing money supply or cutting interest rates. This is just a general simplified view of monetary policy changes, which will be covered in the next section, but of course there are plenty of other economic factors that could influence central bank decisions.
Traders who use fundamental analysis often make use of an economic calendar to keep track of how economies are doing. These calendars list down the upcoming data releases, usually for major economies, and their potential impact on price action. There are reports that could trigger a large or long-term effect on forex movements while there are other reports that result to small reactions only. Economic calendars also typically include the previous report's result and the analysts' consensus for the upcoming release in order to give the trader a basis of comparison in whether or not improvements were seen.
Aside from economic events, market sentiment also usually factors in fundamental analysis. This refers to traders' appetite for risk, with higher-yielding riskier currencies usually rallying when confidence is up and lower-yielding safe-haven currencies climbing when confidence is down.
This can be gauged by looking at equity market performance, as stock indices generally surge when risk is on. When traders are feeling risk averse in general, this cautious trading behavior can also be monitored in global stock exchanges. Commodity prices are also sometimes used in gauging market sentiment, as covered in the latter sections.
23 – Using Multiple Time Frame Analysis
While using a combination of technical indicators can help confirm price movements and filter out false signals, most traders opt to conduct multiple time frame analysis for additional confirmation. This method simply involves looking at the same currency pair across various time frames, from the short term 15-minute to the long-term daily or weekly charts. The reason behind this approach is that some trends are more visible on longer-term time frames. Meanwhile, some reversal signals or potential entry levels might be clearer on shorter-term time frames. With that, it helps to have both a bird's eye view of price action then to zoom in to determine exact entry or exit levels for a trade.
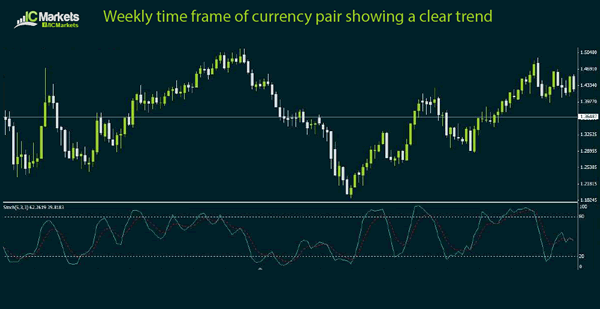
In this example, the daily time frame of the currency pair is showing a very clear trend but it can be difficult to determine precise entry points for a long trade simply based on this chart.
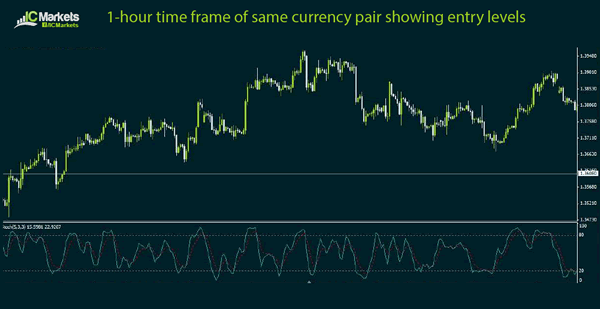
Zooming in to the 1-hour time frame of the same currency pair can be helpful in pinpointing possible Fibonacci retracement levels or breakouts of nearby inflection points, which would confirm that the ongoing trend will continue. There are no definite rules that state which time frames you should look at, as you have to determine this based on your trading style or what works for you. If you are a swing trader, you might be more comfortable looking at the daily chart and the 4-hour chart. If you're a scalp trader, you might want to watch the 1-hour chart then zoom in to the 15-minute time frame. Some traders find price action longer-term time frames too slow and they'd rather take quick moves with tight stops based on short-term time frames. Other traders are not too comfortable about fast price movements on minute charts so they'd rather trade the long-term charts and hold on to their trades for days or weeks. Of course there are a few advantages and disadvantages to favoring certain time frames. For instance, the advantage of sticking to longer-term charts is that it allows the trader to maintain his bias without having to check intraday charts every now and then. The disadvantage, however, is that this approach generates fewer trade signals. On the other hand, the advantage of looking at shorter-term time frames is that the trader is able to spot several trade opportunities very often. However, transaction costs for these trades could pile up and eat part of the profits. This also requires the trader to be flexible and able to change biases quickly. Another factor to consider, apart from one's trading style, when it comes to deciding which time frames to trade is capital. Trading shorter-term charts usually requires lower margin while longer-term trades may require a bigger account to avoid getting a margin call.
22 – How to Trade Divergences
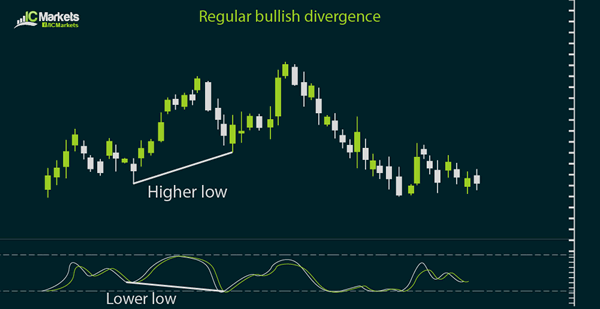
As you've learned in the previous sections, technical indicators and price action tend to move in tandem. For instance, when stochastic starts heading lower from the overbought zone, the corresponding currency pair usually sells off. On the other hand, stochastic climbing out of the oversold area indicates that the currency pair could rally. There are instances, however, when technical indicators and price action seem to be showing different results. Traders refer to these scenarios as divergences. Divergences take place when indicators make different highs or different lows. To be specific, higher highs in price and lower highs for the technical indicator constitute a trading divergence. So does lower highs in price and higher highs for the technical indicator. Meanwhile, lower lows in price and higher lows for the technical indicator or higher lows in price and lower lows in the indicator are also divergences.
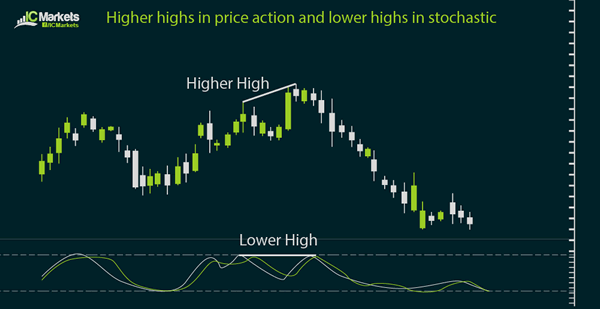
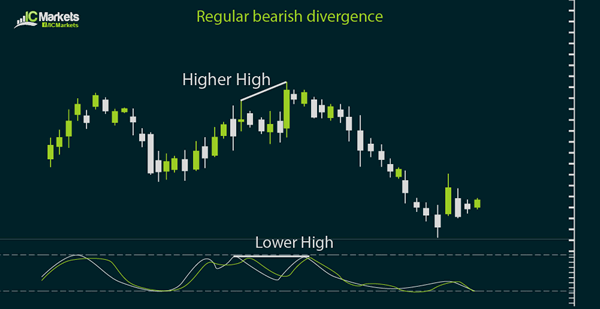
These may be a challenge to remember at first so it might be easier to group these trading divergences into two main categories: regular and hidden. A regular divergence suggests a reversal in price action. In an uptrend, price usually makes higher highs but once the technical indicator shows lower highs, it could mean that the trend is about to turn.
In a downtrend, price usually makes lower lows but once the technical indicator draws higher lows, it might be a sign that the trend is almost over.
A hidden divergence indicates that the current trend is likely to resume. In an uptrend, price usually makes higher lows but when the technical indicator starts making lower lows in a pullback, it could be a sign that the correction is over and that the previous trend could resume
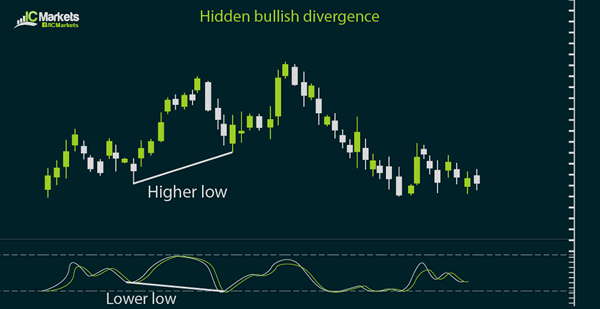
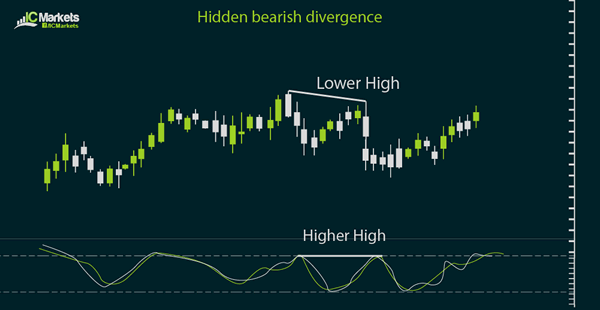
In a downtrend, price tends to make lower highs but once the technical indicator draws higher highs in a retracement, it could be a signal that the pullback is over and that the previous downtrend could carry on.
Divergences tend to work better in longer-term time frames than in shorter-term ones, as trends are more visible on those charts. Aside from that, there are also some requirements that must be fulfilled before trading a valid divergence. For one, successive highs and lows must be connected. You must also make sure that the highs or lows on the price are vertically aligned with the highs or lows in the technical indicator.
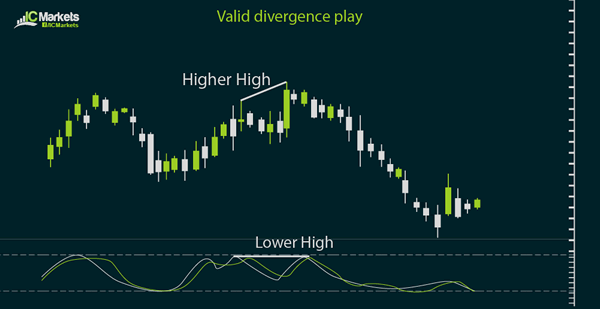
Of course there are some instances when divergence fails and you simply have to be prepared with a good risk management strategy in these cases. To lessen the odds of this happening to you though, you might want to consider a multiple time frame analysis, as discussed in the next section.
21 – Understanding Harmonic Price Patterns
Harmonic price patterns comprise another set of chart formations involving Fibonacci retracement and extension levels. The rule of thumb in trading these patterns is to wait for the entire formation to be completed before entering any long or short positions.
There are six main kinds of harmonic price patterns, namely the ABCD, the three-drive, the Gartley, the crab, the bat, and the butterfly. The last three chart pattern names are based on the animals that the chart patterns resemble. This makes it easier for traders to remember what kind of harmonic price pattern is forming.
First off, the ABCD pattern is comprised of lines AB and CD known as the legs and line BC, which is the retracement. Here are the bullish and bearish illustrations of the ABCD pattern.
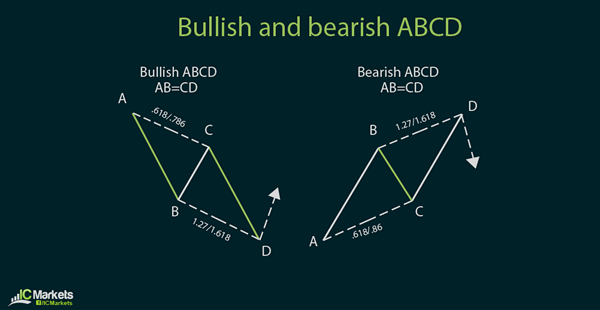
For this pattern to be valid, the length of leg AB should be around the same as the length of leg CD.
Next, the three-drive pattern is similar to the ABCD pattern, except that it has three legs and not just two. This is also a variation of the basic 5-3 Elliott Wave pattern discussed in the previous section.
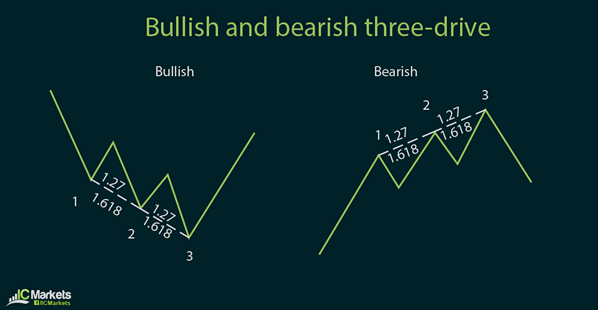
For this pattern to be valid, the legs of the three-drive need to be equal in length. Aside from that, the time it takes for each leg to be completed should also be equal.
In the 1930s, stock market advisor Harold McKinley Gartley applied scientific and statistical methods to come up with a set of harmonic price patterns guiding traders on what to trade and when to enter trades. The most basic among these patterns is the "222 Pattern" found on Gartley's book entitled Profits in the Stock Market.
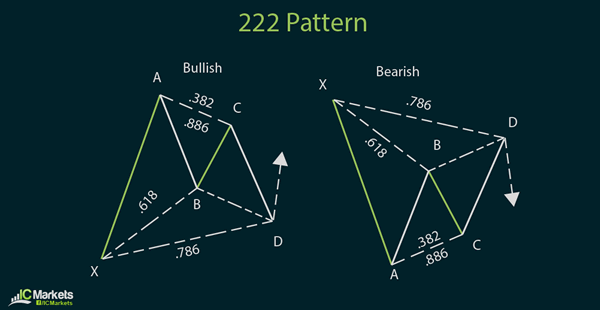
These 222 patterns form as corrective formations in the middle of an overall trend, telling the trader when to take a trade and take advantage of the trend continuation at a bargain price. These reversal points are marked by Fibonacci retracement and Fibonacci extension levels.
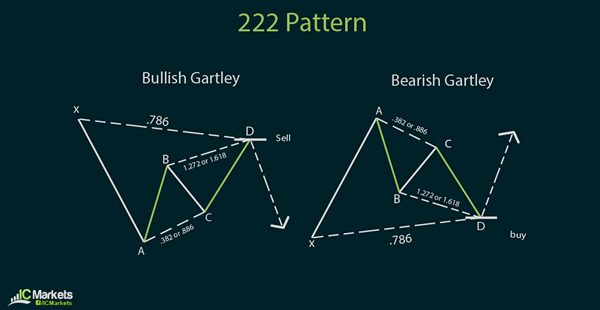
For the pattern to be valid, it should have the following characteristics:
- Move AB should be the .618 retracement of move XA.
- Move BC should be either .382 or .886 retracement of move AB.
- If the retracement of move BC is .382 of move AB, then CD should be 1.272 of move BC. If move BC is .886 of move AB, then CD should extend 1.618 of move BC.
- Move CD should be .786 retracement of move XA
The crab, bat, and butterfly patterns are simply variations of this basic 222 pattern, based on varying levels of the Fibonacci retracement and extension points.
20 – Elliott Wave Analysis 101
A combination of repeating price patterns with Fibonacci analysis yields another branch of technical analysis known as Elliott Waves. This is named after its founder Ralph Nelson Elliott who analyzed 75 years' worth of stock data before formulating and compiling his theories in a book entitled The Wave Principle. He discussed how price movements are not completely random and that markets traded in repeating cycles. He noted that the upward or downward swings in price action are a result of a collective market psychology, central to which are emotions of traders. In his book, he outlined ways in which traders can catch trends at ideal prices as he detailed methods of catching market corrections and continuations. One of the most basic wave patterns discussed in his book is the 5-3 pattern, wherein the first five waves are the impulse waves and the last three waves are corrective waves.
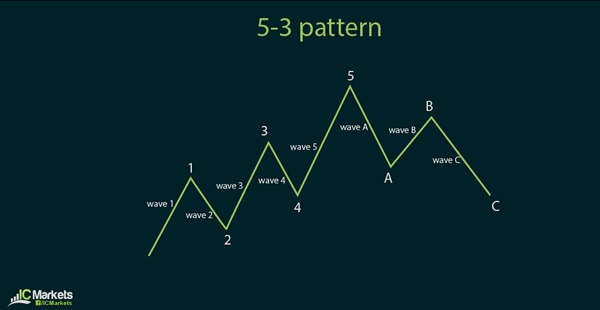
The first wave consists of the initial move upwards (or downwards in a downtrend) which is sparked by a sudden influx of buyers (or sellers), spurred to take long (or short) positions and causing the price to make a big rally (or selloff). The second wave occurs in the opposite direction of the first one as traders book profits off a key inflection point or start to believe that the asset or currency pair is already overvalued (or undervalued). This leads to a move lower (or higher) but not beyond the initial price before the first wave started. The third wave takes place when more buyers (or sellers) pay attention to the asset and see that it is moving in a strong trend. This pullback allows them to get in the trend at a relatively good price so they set their long (or short) orders and push the price up (or down). The fourth wave happens because traders once again think that the asset is becoming overvalued and that it may be time to book profits once again. The fifth and last wave occurs to extend the price rally to a point wherein it becomes extremely overvalued (or undervalued), before the trend starts to reverse. The first, third, or fifth impulse waves may have a chance of being extended, which means that they can be longer than the other two impulse waves. Again, this depends mostly on market psychology or sentiment. Apart from that, fundamental and technical factors may also combine for a stronger push in price action. What's particularly interesting about Elliott Waves is that you can see these impulse and corrective waves occur in longer-term time frames and even as you zoom in to much shorter-term time frames, such as the 1-minute chart. Elliott has mentioned that there are roughly 21 wave patterns illustrating this phenomenon. These depend on the strength of the waves or the sharpness or shallowness of each pullback. These can be in the form of zig-zags, flat formations, or triangle patterns – all of which have the same general appearance as the 5-3 wave pattern. What's important to note about these Elliott Waves are the three cardinal rules. First is that the third wave can never be the shortest impulse wave. Second is that the second wave can never go beyond the start of the first wave. Third is that the fourth wave can never cross into the same area as the first wave.
19 – Basic Forex Chart Formations
Aside from technical indicators and Japanese candlestick patterns, another main component of technical analysis is chart formations. Remember that the concept behind technical analysis is that price patterns tend to repeat themselves, which means that these chart patterns more or less result to the same price behavior later on.
The sheer number of classic chart formations may seem intimidating and difficult to memorize at first but this comes with practice. More often than not, the names of the chart formations describe how the patterns look like on the charts.
For instance, the double top and double bottom patterns are one of the easiest ones to remember. A double top looks like two peaks in price action while the double bottom looks like two lows.
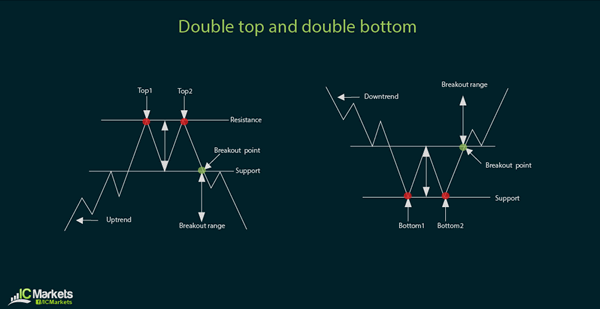
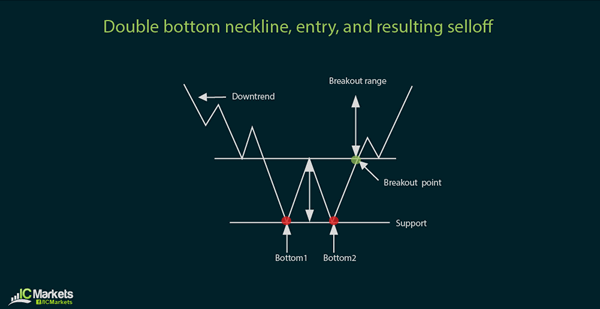
These are considered reversal signals, as a break beyond the neckline of the formation suggests the start of a new trend. To trade this, you can set a buy order above the neckline of a double bottom or set a sell order below the neckline of a double top.
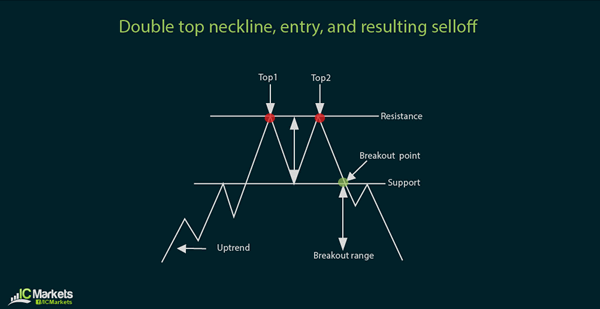
Drawing necklines take practice but a good rule of thumb to remember is to simply connect the price turn in between the bottoms or the tops with a horizontal line.
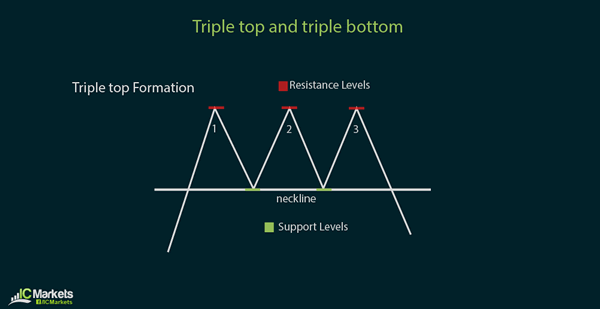
A variation of the double top and double bottom is the triple top and triple bottom, which are also reversal signals. These are rare finds though but can be potent signals of a new trend.
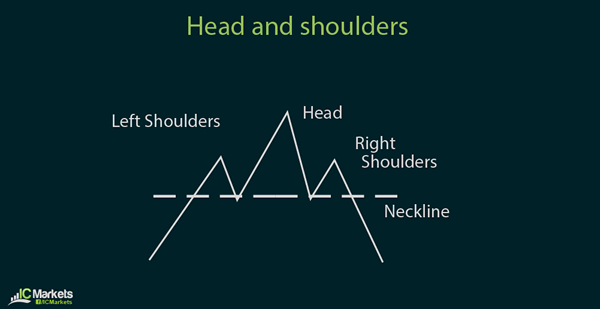
A more complex reversal chart pattern is the head and shoulders. When it forms on top of an uptrend, it is a sign that a selloff might take place if price is able to break below the neckline.
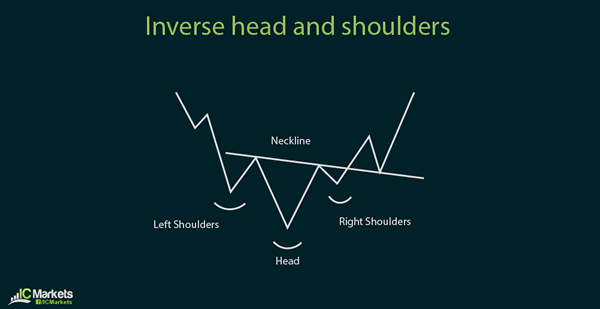
Conversely, an inverse head and shoulders pattern forming at the bottom of a downtrend is a sign that price will turn and may move in an uptrend after breaking above the neckline.
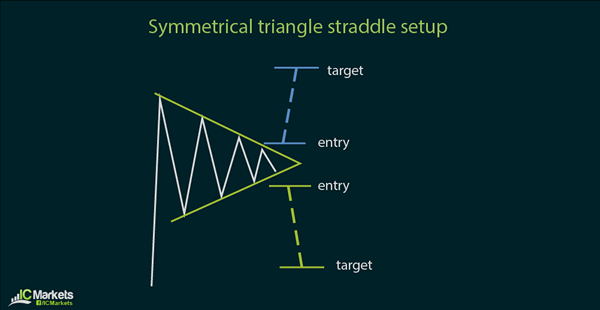
Another group of chart patterns is the triangle formations. These can be descending, ascending, or symmetrical.
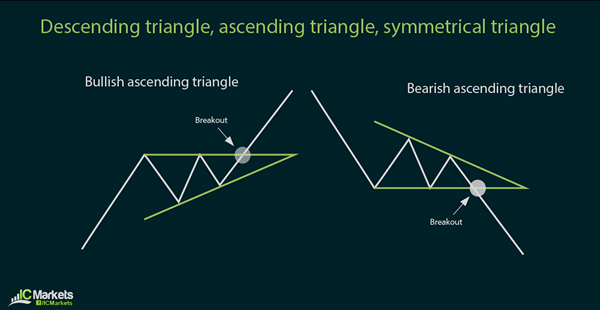
There is no hard and fast rule in saying whether these formations result to reversals or continuations. When price is consolidating tighter towards the rightmost tip of the triangle, it is a sign that a breakout may occur in either direction. Traders try to catch an up or down move by setting buy and sell orders outside the triangle.
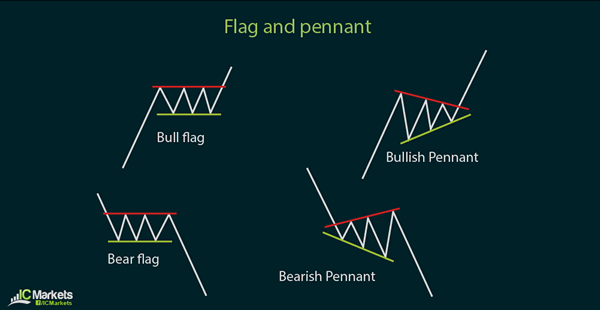
Last but not least, another popular group of chart formations are the flags and pennants. These are typically treated as continuation patterns, as price simply consolidates for a short while inside a flag or pennant before resuming its ongoing trend.
There are other kinds of chart patterns such as wedges or cup and handle formations, which will be covered in a later section.
18 – Using Momentum or Lagging Indicators
As opposed to leading indicators which generate early trade signals, momentum or lagging indicators give confirmation signals when the trend has already found directional momentum. Because of that, lagging indicators are also known as trend-following indicators.
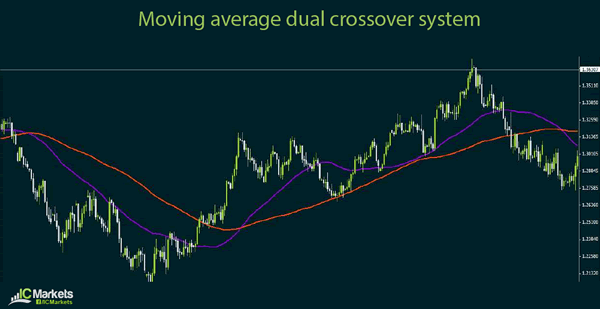
One of the most basic examples of lagging indicators is the moving average crossover system. This can employ either simple or exponential moving averages with different parameters in combination to come up with buy or sell signals. When the shorter-term moving average crosses above the longer-term moving average, it is considered a buy signal. When the shorter-term moving average crosses below the longer-term moving average, it can be a sell signal.
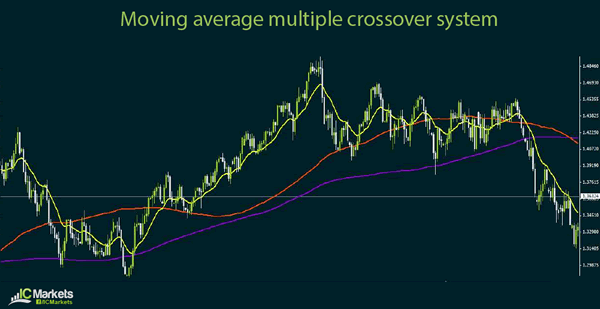
Some traders opt to use a number of moving averages in combination. Conservative rules suggest that when the moving averages are arranged in a descending manner from top to bottom, it could be a sell signal. When moving averages are arranged in an ascending manner from top to bottom, it could be a sell signal.
Another kind of lagging indicator is the MACD, which is short for moving average convergence divergence. As the name suggests, this method also makes use of moving averages but focuses more on the convergence or divergence of these indicators.
The MACD chart also includes the histogram, which keeps track of the difference between the moving average. The criss-crossing lines at the bottom, which is the actual MACD, shows the moving average of the difference between the moving averages.
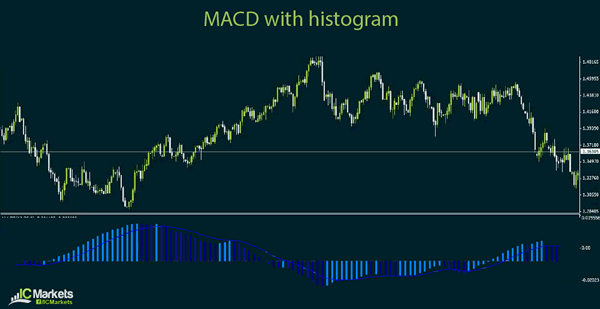
As mentioned in an earlier section, it is not important to memorize how these indicators are derived but that it is more crucial to understand how to apply them. While the MACD may seem like a complicated tool at first, it pretty much functions in the same manner as moving averages.
When the MACD lines move closer to each other, this means that the actual moving averages are converging and that a market turn might be in the cards. On the other hand, when the MACD lines move apart form each other, this means that the actual moving averages are diverging and that the trend is getting stronger. In a way, MACD can also be treated as both a leading and lagging indicator.
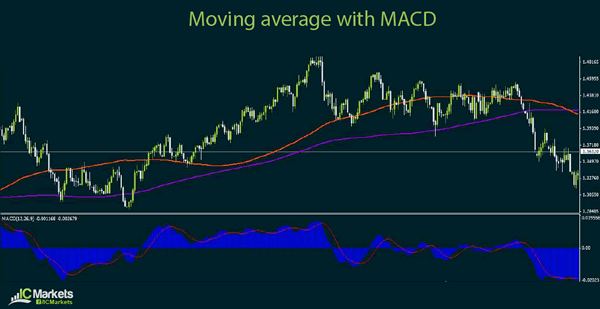
Trading using the MACD can also make use of the crossover method. When the MACD lines cross, it indicates the start of a new trend. Waiting for a few histogram bars to grow larger can be a way of getting confirmation that the trend will be strong.
As with leading indicators, the parameters of lagging indicators can also be tweaked to suit the trader's style and preferences. Generally speaking, shorter periods tend to result in more trade signals but with the higher chance of getting false ones. Longer periods generate fewer trade signals, which means that one might miss out on a few good trade opportunities.