

Sample Category Title
07 – Trend Lines and Channels
Forex traders often say that "The trend is your friend" because a market uptrend or downtrend provides several reliable opportunities to catch pips. During these kinds of market behavior, trend lines and channels can be the most reliable technical analysis tools.
Trend lines are drawn simply by connecting the recent highs or lows of price action. To be specific, an uptrend line or ascending trend line is drawn by connecting the latest lows with a straight line. A downtrend line or descending trend line is created by connecting the latest highs with a straight line.
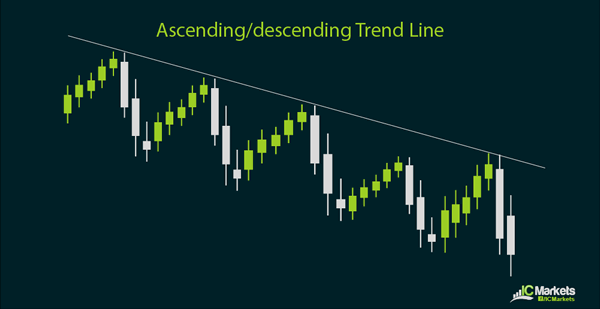
An ascending trend line tends to act as support for price action if the uptrend continues. Price often pulls back to the rising support level and bounces if buying momentum remains strong. The creation of new highs indicates that the uptrend will carry on.
On the other hand, a descending trend line is treated as resistance for price action if the downtrend is strong. Price often pulls back to the falling resistance level and bounces if selling momentum carries on. The formation of new lows suggests that the selloff is likely to continue.
As with other types of inflection points, a break above the falling trend line resistance indicates that the downtrend may be over and that a reversal could take place. Conversely, a break below a rising trend line support suggests that the uptrend is about to turn.
Channels are simply trend lines drawn parallel to one another. In particular, an ascending channel is formed when the rising trend line connecting the lows of recent price action has a parallel rising trend line connecting the latest highs. A descending trend channel is created by drawing a trend line connecting the latest highs and having a parallel downtrend line connecting the latest lows.
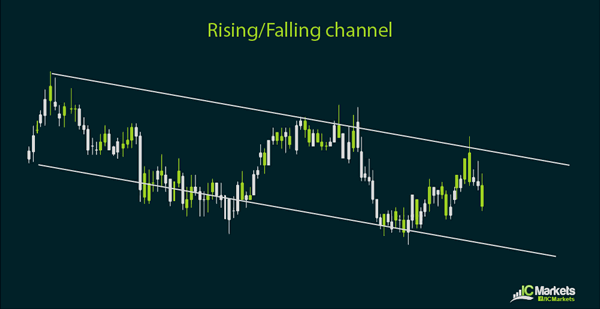
Channels tend to be more potent trade signals since these could also provide potential take-profit levels. Trend-following traders could enter trades in the same direction of the overall market trend, which means shorting at the top of the falling channel or going long at the bottom of a rising channel. Countertrend traders could enter trades in the opposite direction of the channel trend, which means going long at the bottom of a falling channel or shorting at the top of a rising channel.
Of course, countertrend trades tend to be a little more risky while trend-following setups do have a higher probability of winning. Traders often look for confluence or the lining up of several kinds of inflection points for confirmation before deciding to jump in a countertrend setup.
06 – Support and Resistance
Support and resistance are two of the most frequent forex terms you will come across in technical analysis. Simply put, support refers to a floor in price action where a downward movement changes course. On the other hand, resistance stands for a ceiling in price action where an upward movement reverses.
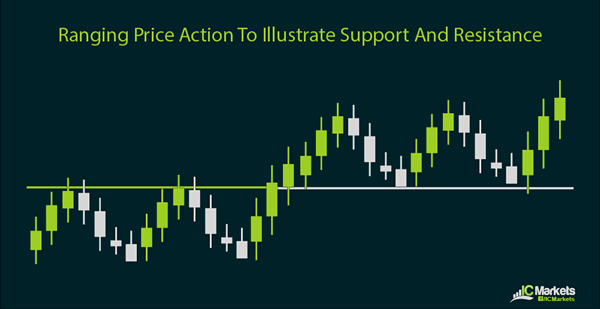
A good rule of thumb for identifying support and resistance levels is waiting for a couple of tests or bounces, which indicate that the levels are holding. However, as the number of bounces off those levels increase, so does the probability of breaking in the next tests.
When support or resistance levels do break, they tend to flip roles especially when there is trending market behavior. In particular, when a support level breaks during a downtrend, it could act as resistance for future price action. When a resistance level is broken during an uptrend, it may act as support for later movements.
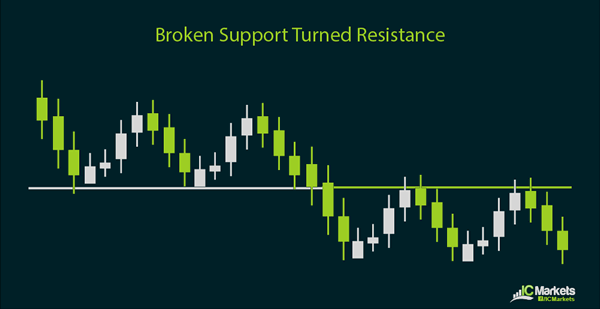
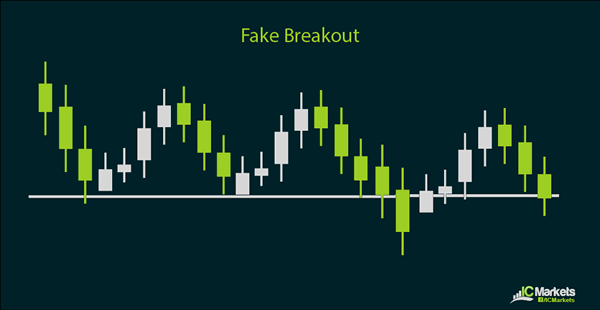
What you should be careful of though is fakeouts or false breakouts. There may be instances when it appears that price action is already making a break above resistance or below support, but you should look at the close of longer-term candlesticks to determine whether those inflection points have been broken or not.
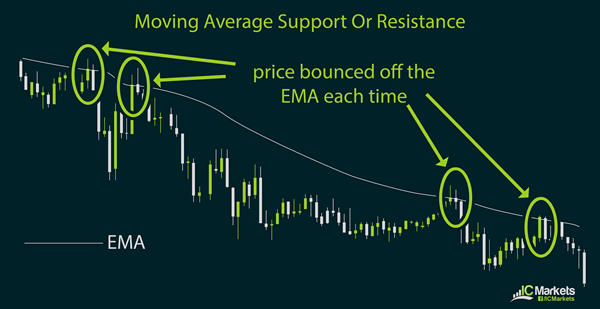
Another thing to remember is that support and resistance are not always horizontal levels, although those are the most basic and commonly seen inflection points. Support and resistance can come in the form of trend lines or channels, which are diagonal lines connecting recent price highs or lows. Moving averages or other technical indicators may also act as dynamic support and resistance levels.
There are other technical tools that can be employed to calculate potential support and resistance levels, even if these floors and ceilings haven't been established by past price action. For intraday traders, pivot points are typically calculated using various formulas to identify potential barriers for price action for that particular trading day.
In addition, Fibonacci retracement and extension tools can be used to pinpoint potential support and resistance as the market trend progresses. When these line up with horizontal levels or other possible inflection points, they tend to act as stronger floors or ceilings for price movement.
These types of support and resistance levels are covered in the next section, which details how various inflection points can be combined to generate better trade setups for predicting market turns.
05 – Group Candlestick Patterns
Group candlestick patterns are more creative but take time to form. Generally, these are believed to be more effective signals when they occur on the longer-term time frames.
First is the three-inside-up or three-inside-down pattern, which is basically indicative of a possible reversal. It can be considered a harami double candlestick pattern plus an additional confirmation candle.
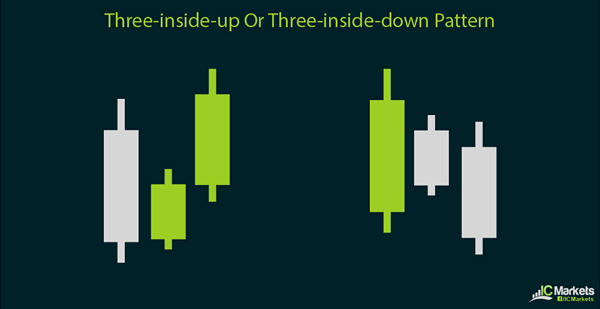
The first candle is a long one in the direction of the previous trend, with the second candle as an inside day pattern. The third or confirmation candle is another long one in the direction of the reversal trend, closing higher than the first candle for a bullish signal or lower than the first candle for a bearish signal.
Next is the three-outside-up or three-outside-down pattern, which basically looks just as it sounds. This can also be considered an engulfing double candlestick pattern with an additional confirmation candle.
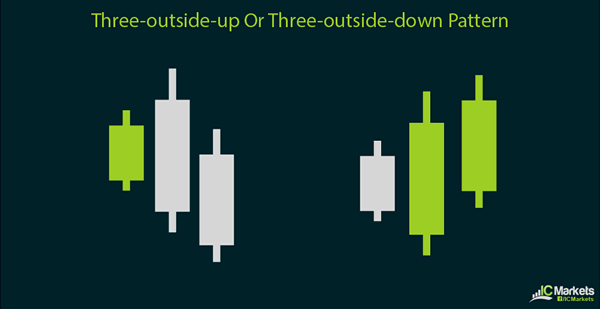
The difference is that the first candle is a short one in the opposite direction of the previous trend. The second candle should engulf the first one and should be in the direction of the reversal. The third or confirmation candle should also be in the direction of the new trend and must close higher than the second candle for a bullish signal or close lower than the second candle for a bearish signal.
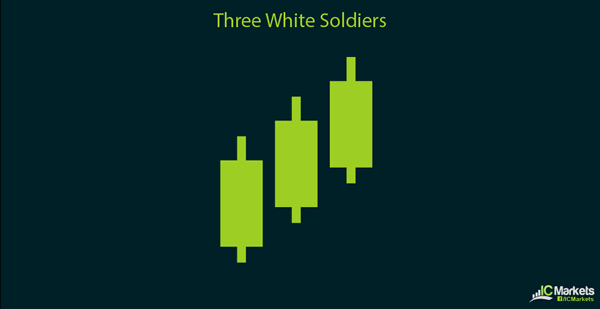
Another interesting and reliable triple candlestick formation is the three white soldiers. This is a bullish signal simply comprised of three long white or green candles, hinting at further gains for the forex pair.
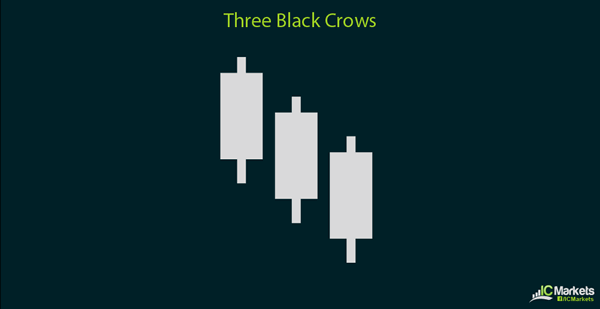
The bearish counterpart of the three white soldiers is the three black crows. This is comprised of three long black or red candlesticks, indicating that a deeper selloff is in the cards for the pair.
The morning star, which is a bullish signal, occurs at the end of a downtrend and signals the start of an uptrend. The first candle is a bearish one while the second candle gaps down for the open but closes higher. The third candle is a bullish one, covering most of the first candle's body.
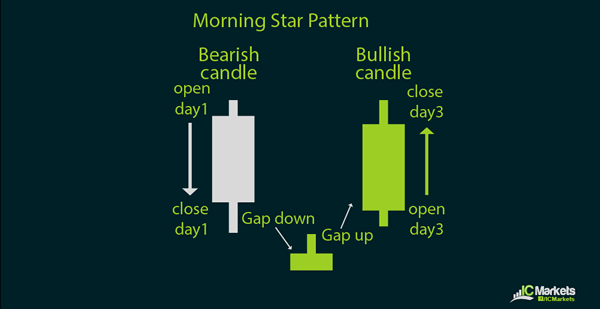
The second candle could also be a doji, which would make the pattern a bullish doji star formation.
The evening star, which is the bearish counterpart of the morning star, occurs at the end of an uptrend and signals a potential downtrend. The first candle is a bullish one while the second candle gaps higher for the open then closes lower. The third candle is a bearish one, covering most of the first candle's body.
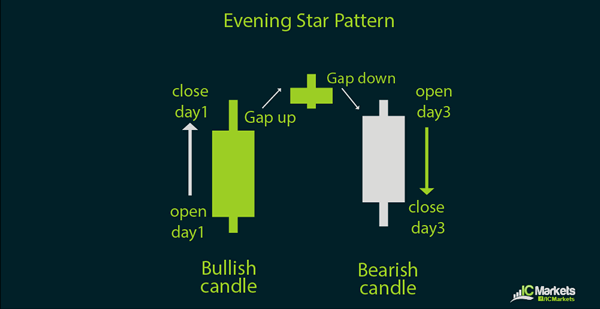
As with the morning star formation, the second candle can also be a doji, making tis a bearish doji star pattern.
A triple candlestick pattern similar to the morning and evening star patterns is the abandoned baby. This is also suggestive of a price reversal.
A bullish abandoned baby pattern has a first candle that is bearish, followed by a gap down and a doji for the next candle. This is then succeeded by a bullish candle gapping higher and closing inside the first candle.
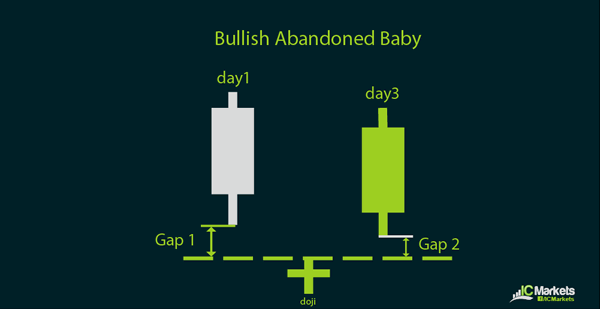
Conversely, a bearish abandoned baby pattern has a first candle that is bullish, followed by a gap higher and a doji for the second candle. This is then followed by a bearish candle gapping lower and closing inside the first candle.
04 – Double Candlestick Patterns
Memorizing double candlestick patterns can be a bit more challenging, but the trading results can be very rewarding. As with the single Japanese candlestick patterns, these come in bullish and bearish versions.
The most basic type of dual candlestick formation is the bullish or bearish engulfing pattern. Simply put, the engulfing pattern occurs at the end of a market trend, with the first or setup candle showing signs of exhaustion and the confirmation candle indicating a complete takeover or reversal.
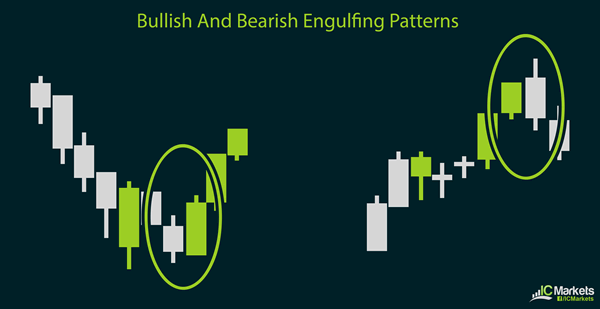
In other words, the confirmation or second candle's high is higher than that of the setup candle and its low is lower as well. Another kind of dual candlestick formation is the harami. In Japanese, this translates to "pregnant", which is an easy way of remembering how the pattern looks like. It can be considered a reverse of the engulfing pattern, as the confirmation candle has a lower high and a higher low compared to the first candle.
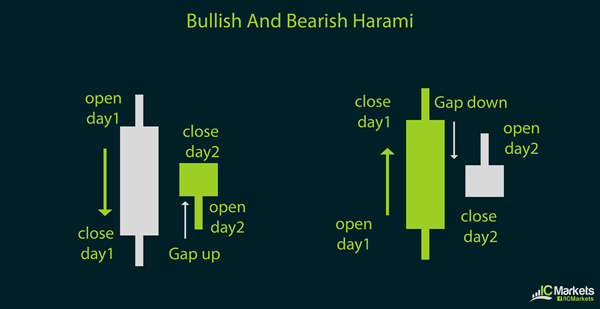
This pattern is also known as an inside day formation. A variation of this pattern is known as the harami cross, wherein the second candle is a doji that is inside the first candle. This also has a bullish and bearish version, both of which indicate a potential price reversal.
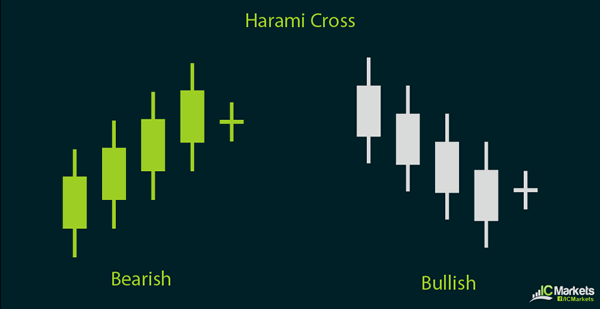
Next up are the tweezer tops and bottoms. This kind of double candlestick pattern also occurs on top of an uptrend or at the bottom of a downtrend, signaling a possible price reversal. The name of the formation is given because of the double highs of tweezer tops or double lows of tweezer bottoms which should be of equal length.
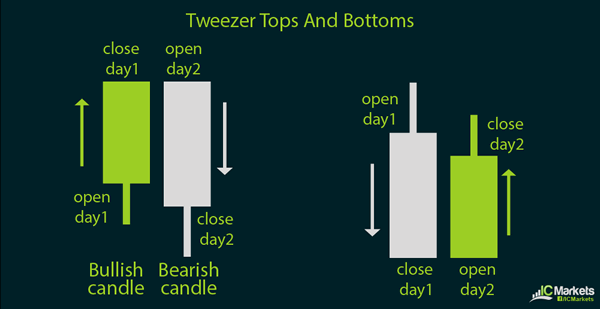
Furthermore, the first candle of the tweezer top or bottom should be in the direction of the previous trend. In other words, a tweezer top should have a bullish first candle while a tweezer bottom should have a bearish first candle. Then the second candle should be the opposite of the previous trend, which means that a tweezer top should have a bearish second candle while a tweezer bottom should have a bullish second candle.
One of the more rare double candlestick patterns are the hammer and inverted hammer, both of which also hint at possible reversals. The hammer has a small body with a long lower wick and no upper wick while the inverted hammer has a small body with a long upper wick and no lower wick.
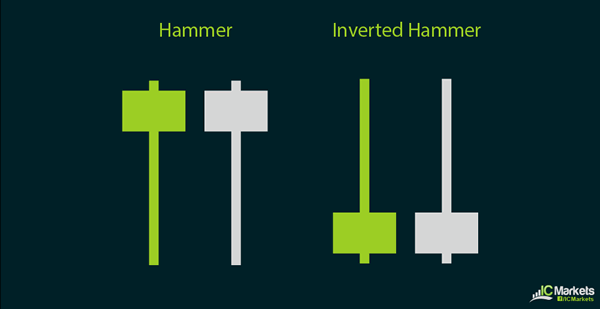
The bearish hammer is also known as a hanging man while the bearish inverted hammer can also be called a shooting star. For these dual candlestick patterns, the first or signal candlestick is a long candle followed by a gap down before the second or setup candle.
03 – Common Candlestick Formations
Single candlestick patterns are perhaps one of the most straightforward ways of reading price action and interpreting market psychology. Candlesticks with long bodies and short wicks signify strong buying or selling momentum that is likely to carry on until a reversal candlestick is formed. Meanwhile, candlesticks with long wicks and short bodies can either reflect indecision or a battle between buyers and sellers. The most well-known single long candlestick pattern is the marubozu, which means bald in Japanese. Strictly speaking, a marubozu is either a long green or red candle with no wick at all. However, a long candlestick with very small upper or lower wicks can still fall under this category. A bullish marubozu is a long green or white candle, which has an open price equal to the low of the period and a close price equal to the high of the period. A bearish marubozu is a long red or black candle, with the open price equal to the high of the period and a close price equal to the low.
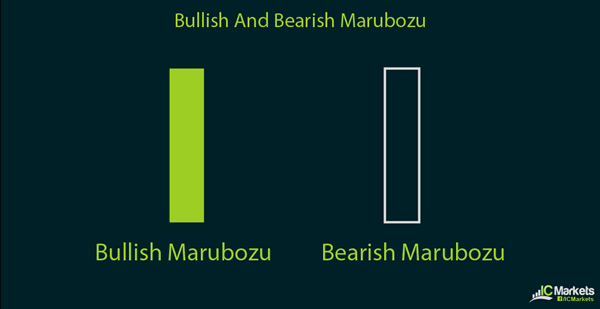
When a bullish marubozu is formed on a daily chart, this means that buying has occurred throughout the day and is likely to carry on the next day. Conversely, a bearish marubozu on a daily chart indicates that sellers were in control of price action the entire trading day and are likely to push the pair lower for the next day. Another common single candlestick pattern is the doji. This is easily recognized as a candle with long upper and/or lower wicks with practically no body. In Japanese, doji translates to a mistake, which means that plenty of action took place during the period but that price eventually closed right where it opened. There are several varieties of doji candlesticks and these are usually associated with reversals. For instance, a dragonfly doji, which is formed when the open, high, low and close of price action for the period are all equal, acts as a bullish signal when it forms at the bottom of a downtrend. A gravestone doji, on the other hand, is formed when the open, close, and low for the period are all equal and it can serve as a bearish signal when it occurs at the top of an uptrend.
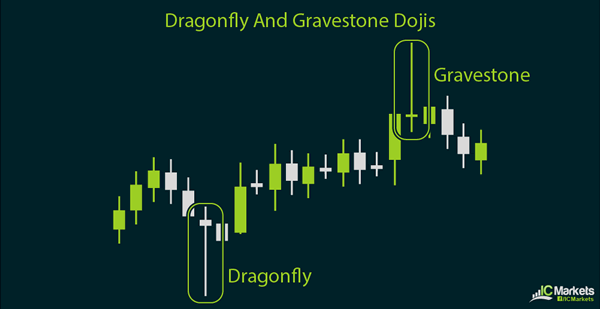
In addition to the dragonfly and gravestone dojis, the long-legged doji can also be used to signify potential market reversal. However, this usually requires confirmation from the next candlestick. Spinning tops are also treated as signals for price action reversal, although their reliability is said to be lower compared to that of doji candlesticks. Spinning tops have a small body with long wicks on both ends.
02 – Japanese Candlestick Basics
Candlestick charting originated around the 17th century among Japanese rice traders. Munehisa Homma developed this methodology to monitor daily changes in the prices of rice in order to help him make better decisions when it comes to buying or selling the commodity. These methods were eventually compiled and improved on by the more popularly known proponent of candlestick patterns, Steve Nison, who published his book entitled Japanese Candlestick Charting Techniques in the early 90s. As discussed in the previous section, one of the best features of using candlestick charts to watch forex price action is that it provides a snapshot of buying and selling pressure. A quick glance at a Japanese candlestick chart could easily show whether bulls or bears are in control, allowing one to determine whether a reversal or continuation of the trend is more likely to happen.
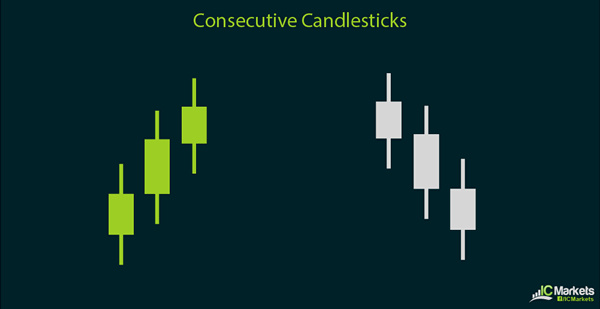
Aside from that, the open and close of price action for longer-term charts such as the daily and weekly time frames tend to act as support or resistance for intraday price action. These open and close levels are marked by Japanese candlestick patterns and the highs and lows could act as gauges for when breakouts are taking place. In addition, the length of the candlesticks is also indicative of market behavior. Long green candles mean that buyers are very aggressive in pushing the pair higher while long red candles suggest that sellers have found a catalyst to keep shorting the currency pair. Short candles reflect indecision or could be early signals for a market reversal.
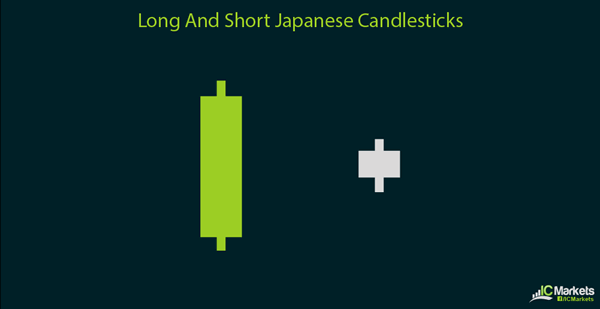
Shadows or candlestick wicks representing the highs and lows also provide helpful clues on future price behavior. A candlestick with a long upper wick and a short lower wick means that buyers bid prices higher but that sellers refused to back down. Conversely, a candlestick with a long lower wick and a short upper wick suggests that sellers tried to pile up their short positions but that buyers are similarly aggressive. Candlestick patterns come in various sizes and numbers. There are single candlestick patterns, useful in both long-term and intraday trading. A single candlestick pattern can be indicative of a continuation or a potential reversal, pending confirmation from the succeeding candlestick or from technical indicators. Double candlestick patterns are also classified as common signals of reversal or continuation, as the first candlestick is considered the signal bar while the second one is called the confirmation bar. Group candlestick patterns, which are typically comprised of three candlesticks, comprise more complex formations. This can be tedious to remember but are very helpful particularly for longer-term price movements. These are also more rare compared to their single counterparts but they are usually much more reliable signals. However, these can be frustrating to trade at times since patterns seem evident for the first two bars only to lack confirmation from the third or last candlestick. Of course trading based solely on candlestick patterns has its drawbacks, as this method mostly relies on technical signals and doesn't incorporate economic analysis. Despite that, knowing how to read candlesticks is a useful tool when it comes to understanding market behavior and improving profitability in trading.
01 – Types of Charts
One of the most basic foundations of technical analysis is watching price charts. There are three popular types of charts used by forex traders and these are line charts, bar or open-high-low-close charts, and candlestick charts.
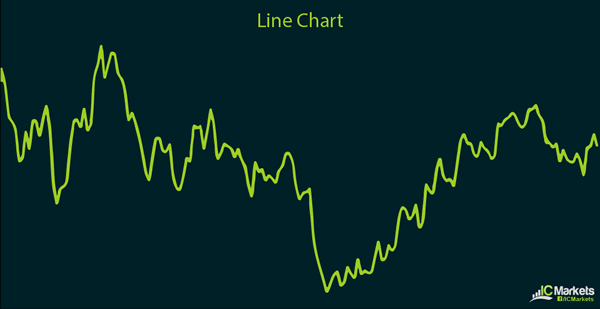
The line chart is the simplest among the three, with a price line connecting one closing price to the next. This allows the trader to gauge the general direction of price action, whether the exchange rate is trending higher or lower.
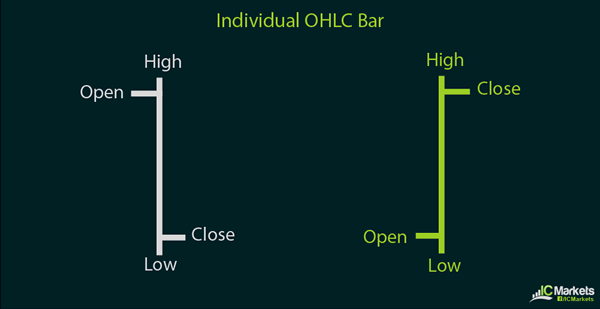
The bar chart, which is also called the OHLC (open, high, low, close) chart, is a little more complex. Each bar notates the open, high, low, and close of the price depending on the time frame used.
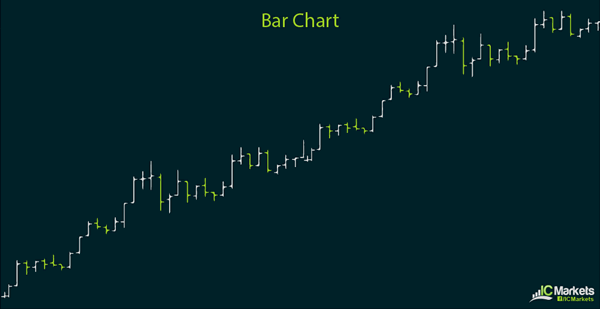
Zooming in to each bar, the horizontal line to the left marks the open price for the period while the horizontal line to the right marks the closing price. The highest point of each bar stands for the high for the period while the lowest point is for the low.
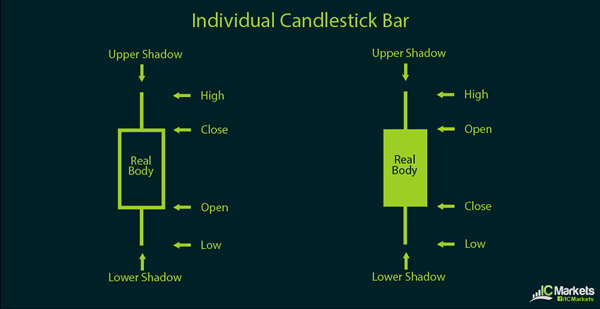
Lastly, the Candlestick chart is the most commonly used by forex traders. Similar to the OHLC chart, candlesticks also indicate the open, high, low, and close of price action during the period.
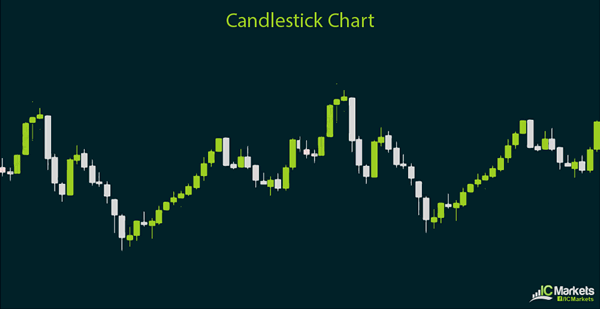
What sets candlestick charts apart is that the bars have a colored body, which makes it easier to visualize whether price went up or down during the period. When price closed higher than its open price for the period, the candlestick is colored white or green. When price closed lower than its open price for the period, the candlestick is colored black or red. This way, forex traders can get a clearer idea of whether buying or selling pressure is building up.
In addition to providing a quick snapshot of bullish or bearish momentum, Japanese candlesticks also have formations that act as reversal or continuation signals. These formations can come in individual candlestick patterns or in groups of two or three. Candlestick patterns, which are also a major component of modern technical analysis, are covered in the next section.
00 – A Beginner’s Guide to Technical Analysis
Technical analysis refers to the study of past price action as a guide in forecasting future price movements. This involves looking at candlestick formations, chart patterns, and indicators.
The Dow Theory, which is based on the collective writings of Charles Dow, is used as the framework for modern technical analysis. Other techniques, such as those introduced by Ralph Nelson Elliott and William Delbert Gann, also comprise the commonly-used techniques in technical analysis of financial markets.
The underlying concept behind these ideas is that all market information is reflected in the asset price and that history tends to repeat itself. In other words, forex market factors such as economic data and risk sentiment are already incorporated in the exchange rate and that historical price patterns have a high probability of occurring again and again.
07 – A Brief History of Forex
What follows is a brief rundown of some of the major historical developments that have led to the Forex market you are now preparing yourself to trade on.
Bretton Woods 1944. USD Becomes the World's Reserve Currency.
In July 1944, with the Second World War still raging in Europe and South East Asia, 730 representatives from the 44 Allied nations convened at the Mount Washington Hotel in Bretton, New Hampshire, USA, for the United Nations Monetary and Financial Conference. Bretton Woods was an attempt to reach a consensus on how to govern the international economy in the aftermath of the war, as well as to address the isolationist policies of economic discrimination and trade warfare, which many believed had contributed to both World Wars, as well as to the Great Depression. As such, eradicating what had come to be known as "beggar thy neighbour policies" (policies that alleviate a country's economic woes at the expense of other countries), and encouraging a freer flow of trade between nations, became a focal point for the conference. Essential to the agreement was an international system of payments to facilitate trade with safeguards in place to prevent large fluctuations in currency value or competitive devaluations. For all these reasons Bretton Woods was a major milestone in the development of the foreign exchange market, and indeed the global financial system we have today.
It was the first time a comprehensive monetary system had been negotiated between nation states, and even though most of the key points of the Bretton Woods system have since been abandoned, its legacy lives on in the institutions it gave rise to. The agreement that was reached at Bretton Woods on the 22nd of July 1944 led to the creation of the International Monetary Fund (IMF), the International Bank for Reconstruction and Development (now part of the World Bank) and the General Agreement on Tariffs and Trade (GATT).
Key to the Bretton Woods agreement was a system of fixed exchange rates between countries whose currency values were all pegged to the U.S dollar, and the US dollar's convertibility to gold at a fixed rate of $35 dollars per ounce. This effectively made the US dollar the world's reserve currency as it took on the role that gold had formerly played under the gold standard. In addition to becoming the world's currency, it's interchangeability with gold made it the currency with the highest purchasing power. Also, the way other currencies were pegged to it, each with its own fixed rate, meant that the majority of international transactions were denominated in US dollars. Taking into account that in the wake of WWII the European powers most affected by the conflict were also heavily in debt to the United States, the geopolitical and economic climate was absolutely ideal for the rise of the United States as the world's superpower. While Britain had been the dominant economic force in the 19th and early 20th century, with the sterling taking pride of place as the world's reserve currency during this period, the second half of the twentieth century would see dominance passing to the United States.
Post Bretton Woods. The Rise of Free Market Capitalism.
Bretton Woods would last until 1971, at which point it was superseded by the short-lived Smithsonian agreement brokered by US President Richard Nixon. However, the golden age of Bretton Woods only really lasted until 1968, up until this time there was a steady improvement in global production and trade, and from 1959 onwards all currencies that were part of the agreement enjoyed full convertibility. But it was the dollar's relationship to gold that would prove to be the real problem that would eventually unhinge the system, this and the fact that the United States was running a large balance of payments deficit to help fund European recovery and keep the financial system liquid. Economists foresaw this eventuality more than a decade in advance, and indeed the problem of keeping gold at $35 per ounce was a real issue as far back as the late 1950's.
The main problem with Bretton Woods was perhaps best stated in 1960 by Robert Triffin, an economist who wrote of what would later come to be known as Triffin's Dilemma. Simply put, Triffin's Dilemma stated that the US deficit was vital to economic growth and to the liquidity of the financial system, but that eventually the very deficit that was aiding Europe's post-war recovery was bound to undermine confidence in the US dollar as the World's reserve currency, and could eventually lead to widespread financial instability.
The US dollar was the only currency that enjoyed gold convertibility, and at the end of the Second World War the US held around 65% of the world's gold reserves. However, inflation had led to it not being economically viable to produce much more gold, and as more and more US dollars flooded into the global financial system, and US gold reserves hardly budged, dollar confidence started to wane as it became apparent that the US would be unable to meet its commitments should dollar holders desire to enforce dollar convertibility. Also, the fact that there was a free market on which gold was traded (separate from the transactions conducted by central banks under Bretton Woods rates), led to a situation where it was cheaper to buy gold at the Bretton Woods rate and then sell it on to the open market.
By 1971 the US only held enough gold to cover 22% of foreign US dollar reserves and was running a $56 billion reserve deficit. Add to this the country's growing public debt which was being used to fund the Great Society initiatives introduced by President Lyndon B. Johnson, as well as the on-going Vietnam War, and it became clear that the Bretton Woods system had become untenable. In November of 1967 the U.K devalued the sterling from $2.80 to $2.40. In November of 1968 an exchange crisis led to the close of the French, German and British markets. In August of 1968 the French franc was devalued from 0.18 grams of gold per franc to 0.16 grams. In October of the same year the German Deutsche mark was revalued from $0.25 to $0.273. Finally in May of 1971 the Deutsche mark and the Dutch guilder were floated. On August 15th 1971, US President Richard Nixon withdrew US dollar gold convertibility as well as imposing a 10% import duty and temporarily locking down wages and prices. This came to be known as the Nixon Shock and caused all major economic powers except France to float their currencies and begin intervening by buying up dollars.
In December of 1971 the Smithsonian Agreement was signed by the G-10 countries. It was an attempt to keep the Bretton Woods system alive by adjusting its fixed rates to more accurately reflect the market pressures of the early 1970s. The dollar was re-pegged to gold at the new price of $38 per ounce and was allowed to fluctuate within a range of 2.25%, rather than the 1% range permitted by Bretton Woods, with other nations agreeing to readjust their fixed rates to the newly devalued dollar accordingly. The biggest difference the Smithsonian Agreement had to Bretton Woods was that the US dollar was no-longer to be convertible to gold. While the Smithsonian agreement adjusted the relationships between the world's currencies, it did not address the fundamental imbalances that had led to the dollar's devaluation in the first place. The US continued to run a huge deficit, as well as increasing its money supply at an inflationary rate, this led to other central banks being forced to intervene in order to keep their own currencies from appreciating, pegged as they were to the dollar at a fixed rate. By 1972 the sterling was finally allowed to float against the dollar. A rise in the value of gold led to the dollar having to be revalued again in February of 1972 at $42.22 per ounce (causing all major currencies to also revalue against the dollar). By March of the same year, after huge interventions by European central banks costing around $3.5 billion, the fixed rate system collapsed entirely and the value of the US dollar was henceforth to be determined by free market economics.
OPEC and the Oil Crisis of '73.
Up until now we have overlooked a significant player in our story. If gold features heavily in the history of Forex, then oil, as vital to the wheels of industry as it is precious, certainly deserves a section of its own. To say that free market capitalism as we now know it would not have been possible were it not for oil is not to overstate the case. Gold may have enjoyed a period where it was the backbone of the international monetary system, but the growth of our global economy was literally and figuratively driven by oil.
America's late entry into the Second World War, its financial standing thereafter, and its status as reserve currency with the signing of Bretton Woods, are often cited as contributing factors for its rise to superpower status. But the United States didn't just emerge from WWII relatively unscathed, with much of Europe indebted to it, and its currency central to the global monetary system; the rise of the United States also coincided with the discovery of its own oil reserves, which quickly replaced coal as the country's primary source of energy. Just as the 19th century belonged to the British Empire; an empire, it should be noted, powered by coal. The 20th century would belong to the United States, and would be the century of oil.
As a backdrop to the events that we have already looked at, it's important to keep in mind that the post WWII years saw an ever-increasing demand for oil. Between the end of the Second World War and the demise of the Smithsonian Agreement the global consumption of oil tripled, and the demand for it increased more than fivefold. After WWII oil was rapidly replacing coal; it was abundant, cheap, easier to transport than coal, and also conferred a competitive advantage in terms of productivity to countries that opted to make the switch. Millions upon millions of barrels flowed out of the Middle East and Venezuela, fuelling post war reconstruction, economic recovery and global growth.
Oil's widespread uptake also had the effect of gradually shifting the balance of power, making many countries increasingly reliant on a constant affordable supply from oil-producing nations. The first time the members of the Organisation of Arab Petroleum Exporting Countries (OPEC) attempted to employ what came to be known as the "oil weapon" was early in June of 1967, a day after the start of the Six Day War. In response to an Israeli incursion into Egyptian, Jordanian and Syrian territories OPEC members issued an oil embargo against all countries deemed to be in support of Israel and within days the Arab oil supply had been reduced by around 60%. The situation threatened to worsen when civil war broke out in Nigeria the following month, removing a further 500,000 barrels of crude oil from the global supply chain each day. This first oil embargo would be short-lived and largely unsuccessful due to the existence of relatively healthy reserves, as well as the re-routing of supplies to areas most affected by the embargo. However, OPEC's second attempt at throwing its weight around would have a much more destabilising effect.
Between 1967 and 1973 the global economy's reliance on cheap oil had reduced surplus capacity to dangerously low levels. In 1970, there were around 3 million barrels of surplus capacity per day (excluding the U.S), by 1973 this had shrank to 500,000 barrels per day. So when OPEC wielded the "oil weapon" for the second time on October 17th 1973, the stakes would be significantly higher than they were in 1967.
A number of convergent factors contributed to the oil crisis of '73. Tense negotiations between OPEC and Western oil companies regarding pricing and production had been on-going for some time. Also, when in 1971 President Richard Nixon put an end to the Bretton Woods system by withdrawing the US dollar's convertibility to gold, the inevitable US dollar devaluation which ensued affected oil-producing countries because oil was (and still is) priced in US dollars. Add to this the fact that US oil production peaked at around 10 million barrels per day in 1970 (declining steadily thereafter), and that by 1973 the US was actually importing 6 million barrels per day, making it extremely vulnerable to disruptions in supply, and you have the ideal conditions for a perfect storm.
On the 6th of October 1973, during the Jewish holy day of Yom Kippur, Egypt and Syria invaded Israeli territories that had been seized by Israel during the Six Day War six years earlier. On October 17th, in response to US support of Israel during the conflict, OPEC raised the price of oil by 70%, as well as imposing an embargo against the United States and any other countries that had supported Israel during the conflict. The war would be over by the end of October, but OPEC refused to change its course. In November of the same year OPEC cut oil production by 25%, and threatened a further 5% cut. In December the price of oil was again doubled. By January, when Israel agreed to pull its troops back to the east side of the Suez Canal, the price of oil was four times higher than it had been before the crisis began.
The attitude of the oil-producers during this period can be summed up by a memorable quote from the Shah of Iran that was publicised by the New York Times in December of 1973:
"Of course [the price of oil] is going to rise… Certainly!... You [the West] increased the price of wheat you sell us by 300%, and the same for sugar and cement… You buy our crude oil and sell it back to us, refined as petrochemicals, at a hundred times the price you've paid to us… It's only fair that, from now on, you should pay more for oil. Let's say ten times more."
Iran had not participated in the embargo, continuing to ship oil to the West throughout the conflict, but it was clear that the age of cheap oil was over and everybody knew it.
The oil crisis changed the geopolitical landscape and the global economy in a number of key ways. The inflated prices at which OPEC nations were selling their oil after the embargo caused economic growth to slow in the West while also causing inflation, a situation that came to be known as "stagflation". Also, the quadrupling of the price of oil immediately led to a huge flow of capital from the West to the oil-exporting nations of the Middle-East, a great deal of which was spent on weapons and technology, further exacerbating tensions in the region and leading to an increased American military presence. The price of oil, as well as its consistent supply, began to figure heavily in the agendas of industrialised nations, such was the shock caused by the embargo. It may seem like the most obvious of dots to connect from our perspective, but even though there were glaring signs leading up to the crisis, oil price and supply was never the topic of concern before 1973 that it is today. Nowadays the balance of supply and demand is so delicate that it's important for you as a Forex trader to understand how currencies are correlated with oil prices (more on this later), as well as to keep abreast of any global events that could impact its supply. Finally, the oil crisis of 1973 also made energy conservation, a term largely absent from people's vocabularies at the time, a priority which has only grown more urgent as we move closer and closer to depleting our planet's fossil fuel reserves.
Cooperative Central Bank Intervention. The Plaza Accord of 1985.
You may have observed an interesting dynamic at work in the brief history of forex we have outlined so far; a certain pull and push between the need for overt regulation and control, versus a laissez-faire approach in which a free market is allowed to regulate itself. If you have identified this theme you are right to do so, the two opposing drives are always present, with proponents of the former most vocal in the wake of an economic crisis, and advocates for the latter seeming to have free rein when all is well in the global economy. The fears that led to Bretton Woods in the first place, and to Nixon wanting to keep exchange rates fixed in the Smithsonian Agreement, were precisely that if left to regulate itself competing devaluations between rival currencies and other antagonistic trade practices would lead to global instability. Conversely, the short-comings of both Bretton Woods and the Smithsonian Agreement were made glaringly obvious by a market unwilling, or unable, to be locked down to the very same fixed relationships that were imposed in order to regulate it. And again, the period between the free-floating of the world's major currencies and the Plaza Accord would give lie to the myth that simple supply and demand dynamics are all that are required to regulate an efficient market.
We have already looked at the first major crisis to affect the global economy after the abandonment of Bretton Woods in 1971. The fourfold increase in the price of oil after the crisis of 1973 resulted in increased import expenditures for industrialised nations, upsetting their balance of payments. Recall that oil is priced in dollars, so the recycling of US dollars held by OPEC nations (petrodollar recycling) inevitably led to a h2 US dollar even though the United States continued to run a substantial trade deficit.
In the late 1970's the US dollar would fall in value as this growing deficit eroded investor confidence. This would be exacerbated by the Iranian revolution and the second oil shock of 1979, when OPEC again hiked the price of oil. However, by the early 1980s a hawkish stance from Federal Reserve chairman Paul Volcker, combined with renewed interest in the dollar as a safe haven currency after the outbreak of the Iran-Iraq war, helped dollar strength to return. 1980 would also be a watershed moment for oil as increased output from the USSR, Venezuela, Mexico, Nigeria, as well as the entry of Alaskan and North Sea oil, precipitated the start of a 20-year decline in oil prices, and a loosening of OPEC's grip.
Volcker's mandate to halt stagflation by raising US interest rates was successful, although an undesired consequence of his policies was that the dollar became overvalued. This resulted in US exports being expensive and uncompetitive (especially American cars), while imports became cheap, which put further pressure on US trade balance. Between 1980 and 1985 the US dollar appreciated by around 50% against the yen, the Deutsche mark, the sterling and the French franc.
The Plaza Accord, so called because it was signed at the Plaza hotel in New York, was an attempt to bring the economies of the United States, Japan, West Germany, the United Kingdom and France back into sync by devaluing the US dollar. When the agreement was made the US current account deficit had reached around 3.5% of the nation's GDP while its economy was growing by around 3%. Europe on the other hand had a large trade surplus and was experiencing negative growth of around -0.7%. In order to redress the balance, the G-5 agreed to a mixture of tax and public spending cuts, private sector expansion and the opening up of markets.
Over the next couple of years the US dollar would depreciate by 50% against the rest of the G-5 nations. By 1987 the Japanese yen had gone from 242 per dollar to 150 per dollar. The US trade deficit with Europe had also been successfully reduced, though not with Japan.
The US dollar would continue to drop beyond the agreed targets, prompting the then G-6 to negotiate the Louvre Accord, which was an effort to halt the US dollar's decline. This would prove to be a much trickier proposition than the devaluation of the Plaza accord. This is due to the dollar having already been in the midst of a downtrend at the time when the Plaza Accord was signed. On the other hand the Louvre Accord would attempt to reverse an already well-established trend and do so through a sustained coordination of the economic policies of the 6 largest economies in the world. By 1988 the dollar was worth 121 yen and 1.57 Deutsche marks. A drastic increase in US interest rates was the only thing that would halt the downturn and strengthen the dollar.
The Plaza Accord was an important historical milestone in the development of the foreign exchange market. It was the first time that nations had agreed to actively intervene in a coordinated way so as to affect currency values, it was an example of how central bank interventions could be orchestrated across national borders in the interests of the global economy. It was also a moment in history when the broadest consequences of globalisation were there for all to see, and markets were shown to require an occasional guiding hand in order to be able to run smoothly and efficiently.
The Latin American Debt Crisis
In the 1980s much of Latin America was affected by a severe debt crisis which blighted the lives and stifled the opportunities of countless citizens, it would come to be known as La DécadaPerdida, or the lost decade.
So far we have been sketching an outline of the global economy, tracking the way it has developed from the "beggar thy neighbour" policies leading up to the Great Depression, to today's global reality where a single surprise can have knock-on effects that are felt around the planet. We have seen how a valuable commodity in the hands of a few can be wieldedlike a weapon over the rest of the world, we've looked at the pull and push dynamic between regulation and free markets, and have observed how central banks can coordinate between themselves in order to affect exchange rates. One of the things you will observeas you immerse yourselves in the markets is that both leaving them to their own devices and attempting to control them inevitably lead to undesired outcomes.
One of the consequences of the oil crisis of the 1970s came about as a result of petrodollar recycling. The fact that oil is priced in US dollars led to OPEC nations accumulating a great deal of wealthwhen the price of oil was drastically increased. OPEC'spetrodollarsinevitably found their way back into the banking system, partly due to many OPEC nations opting not to reinvest this capital into their own domestic infrastructures. The massive influx ofpetrodollar deposits significantly increased the lending capacity of the banks, and with the demand for loans among industrialised nations having fallen during the recession, a large amount of this money was loaned out to rapidly industrialising Latin American countries.
Latin America had been experiencing something of a boom in manufacturing from the 1930's onwards. Its newly industrialised economies had been focused on breaking their dependence on imported consumer goods from the developed world by buildingdomestic industries to feed this demand. This process of import substitution industrialisation (ISI) had brought rapid growth to countries such as Mexico, Brazil and Argentina, but was nearing a ceiling in terms of possiblefuture growth without renewed investment inthe manufacture of heavier consumer goods such as cars.
During the oil crisis of 1973 soaring oil prices and a reduction in global production led to South American oil producers picking up the slack left by OPEC nations and exporting a great deal of oil to the United States.This situation was doomed to be short-lived though, and as the inflated prices settled after the crisis and production was ramped up again in the Middle East, economies such as Mexico's became economically unstable. Other South American net importers of oil suffered from increasing fuel bills during the crisis and higher debt repayments after the crisis as their western creditors raised interest rates.
The choice to carry on pursuing import substitution industrialisation rather than transitioning to export driven economies, was perhaps partially decided by the global economic climate of the time. The severe recession which had hit developed countries in the wake of the oil-shock meant that demand for imports had fallen drastically, as had the demand forraw materials, which also hurt South America's export market.
With interest rates rising in the west, especially in the United States where hawkish policies had been introduced by Fed chairman Paul Volker to ease stagflation (most of the commercial banks that had lent money to South America were US and Japanese), the cost of servicing theseloans increased drastically. Rising interest rates had also helped restore confidence in the US dollar, which put pressure on Latin American exchange rates, further increasing both the value of their debts and the cost of their repayments. From 1975 to 1983 Latin America's debt had gone from $75 billion to $315 billion, the latter figure being around 50% of the region's GDP. The annual cost of servicing those loans had also risen from $12 billion in 1975 to $66 billion in 1982.
In August of 1982 it was announced by Mexico's Minister of finance, Jesus Silva-Herzog, that the country would not be able to continue servicing its existing loans. The loan market imploded overnight. Commercial banks stopped lending to the region and as most of the existing loans were short term in nature, the fact that banks were refusing to refinance them led to billions of dollars of debt being due all at once.
The resulting crisis would be the worst in the region'shistory. Unemployment shot up, incomes and spending power plummeted, growth ground to a halt and poverty increased as social programs were abandoned in favour of debt repayments. Between 1982 and 1985 Latin American economies contracted by around 9 percent. In order to refinance the existing loans countries were required to accept much stricter conditions as well as allowing the International Monetary Fund (IMF) to step in and introduce austerity measures and country-wide reforms, the most notable of which were the abandonment of import substitution industrialisation in favour of free market capitalism and the privatisation of industry.
The Asian Financial Crisis of 1997
The Asian financial crisis occurred in 1997-98 and revealed just how interconnected the global currency markets are. One of our on-going themes in this brief history of forex has been how central banks and governments have sought to intervene in the markets; the Asian crisis revealed once and for all how powerless these institutions can be when attempting to act against overwhelming market forces and unsustainable fundamentals.
Leading up to the crisis the economies of Southeast Asia had been particularly attractive for investors owing to their impressive growth rates. The four Asian Tigers (Hong Kong, Singapore, South Korea and Taiwan) had rapidly developed into formidable global economies specialising in finance and manufacturing, followed closely by what came to be known as the Tiger Cub economies of Malaysia, Indonesia, Thailand and Philippines. These economies in particular had been rapidly expanding and were attracting a great deal of speculative investment due to the high interest rates they maintained. Thailand was an economic miracle in its own right, experiencing growth of just below 10% per year for more than a decade preceding the crisis. It would also eventually prove to be the weak link that set the crash in motion.
The precise causes of the crisis are, of course, numerous and still provoke debate; however a combination of hot money fuelling unsustainable asset bubbles, poor lending practices leading to non-performing loans, ballooning current account deficits, the devaluation of the yen and renminbi, and the U.S recovering from recession are all cited as contributing factors.
A massive influx of foreign investment had led to there being a great deal of capital available for development loans, many of which ended up in the hands of individuals with nepotistic ties to government and banking officials, rather than those most eligible and best able to pay them back. Thailand, South Korea and Indonesia were running pretty hefty current account deficits, Thailand's in particular represented around 8% of the country's GDP and stood at just under $15 billion before the crash. In the wake of the Plaza Accord the devaluation of the yen and renminbi and the subsequent strengthening of the U.S dollar made Asian exports far less competitive. This further exacerbated current account deficits in the region. Factor in the Federal Reserve's interest rate hikes which led to capital flight back into the US economy, and you have a convergence of circumstances that led to a massive loss of confidence resulting in the speculative attacks of May 14 and 15 1997, which caused the eventual devaluation of the Thai baht.
A lack of foreign exchange reserves rendered the Thai government incapable of supporting the baht in the face of these attacks, the currency was eventually allowed to float on July 2, 1997, and swiftly lost more than half of its value while the Thai stock market dropped by 75%.
Within several months of the Thai crash the Indonesian rupiah and stock market reached record lows, causing the country's GDP to contract by around 13.5% that year.
The South Korean won also lost more than half of its value against the dollar, the country's credit rating was downgraded twice and its motor industry was kept alive by a series of mergers and acquisitions.
These three economies were the worst affected by the crisis, and were the beneficiaries of a $40 billion International Monetary Fund (IMF) initiative to restore economic balance to the region. However the knock-on effects of the crisis were far-reaching and led to a general economic slowdown that was felt across the globe. Investors had become increasingly risk averse when it came to developing markets. The ensuing economic slowdown also caused the price of oil to drop and was a contributing factor in the Russian financial crisis of 1998.
In the decade following the Asian crisis many countries in the region took steps to be much less reliant on hot money as an economic stimulant. They also started to run current account surpluses and built up their foreign exchange reserves so as to be able to support their respective currencies in the event of future speculative attacks. As a direct result of these measures Asia was far better able to weather the global financial crisis of 2008. The table below reveals the extent of China's growing foreign exchange reserves from 2004 up until the present day.
China FX Reserves as % World Total
| 2014-06-27 | 33.087 |
| 2013-12-31 | 31.739 |
| 2012-12-31 | 30.284 |
| 2011-12-30 | 31.315 |
| 2010-12-31 | 29.338 |
| 2009-12-31 | 29.806 |
| 2008-12-31 | 28.142 |
| 2007-12-31 | 23.507 |
| 2006-12-29 | 20.535 |
| 2005-12-30 | 19.005 |
| 2004-12-31 | 14.603 |
06 – Market Participants
The Forex Food-chain
Just as it can be easy to miss the deeper market trends when monitoring currency pairs at shorter time frames, it can also be easy to lose sight of the wider forex-trading ecosystem when you're overly concerned with the minor price fluctuations of your open positions.
The forex market is a world unto itself, with all manner of players, from individual traders like you, all the way up to the interbank network and central banks. As an individual retail trader you are the smallest fish, you have the ability to buy and sell the same currency pairs as other participants, but you are have to go through a longer transaction chain than others in order to get hold of liquidity, as such you don't receive the same prices as participants further up the hierarchy. You are also unable to affect the market with your trades because you are far too small to make any waves. Your role is to react to what is going on in the wider market and to position yourself accordingly. While this may seem like a disadvantage; it also comes with its advantages as we will see further on. Learning about all the entities that are large enough to move the waters, as well as knowing how and why they do, will be important to you as a trader. Understanding the wider structure of the market allows you to make educated choices and reduce the degree of randomness in your trading.
Governments /Central Banks.
Central banks such as The Bank of England, The Federal Reserve and the European Central Bank are responsible for managing money supply and interest rates, as well as supervising their respective commercial banking systems. They are the blue whales of the forex-market. As part of their remit to manage growth and currency stability, central banks exert a tremendous influence on the forex market.
As part of their open market operations (OMOs) central banks control the money supply and stabilise interest rates through repurchase agreements (repos) with commercial banks (primary dealers). Repurchase agreements effectively work to increase the money supply in an economy when central banks lend money out (by purchasing treasury bills from the banking sector), or in the case of reverse repos to take money out of circulation when borrowing money (by selling treasury bills to the banking sector).
When spending outpaces production (more demand than supply) prices rise, this is called inflation. When faced with inflation central banks also have the power to directly raise interest rates, this increases the price of credit, making the servicing of existing loans more costly and the prospect of borrowing less attractive.
When production outpaces spending (more supply than demand) prices fall, this is called deflation. When faced with deflation central banks can lower interest rates, reducing the price of credit, which makes it cheaper to service existing loans and more attractive to borrow money.
What we have come to understand as a free market actually refers to a very delicately managed ecosystem, which is kept in balance through periodic intervention by central banks. There are several reasons central banks are located at the top of the Forex food chain. They are the only entities in the financial system with the ability to bring money in and out of existence, they set interest rates, influence the market's expectations and normally hold very large currency reserves (the most popular by far being the US dollar and the euro). The influence that central banks can exert on the FX market when adjusting their own currency reserves can be substantial owing to the sheer volumes they are able to generate.
Institutional dealers
Comprised of banks and large financial institutions, institutional dealers provide liquidity to the FX market. Dealers trade with each other on the interbank market, an electronic communication network backed by lines of credit between participating institutions. Broadly speaking the interbank market is a network of institutional FX dealers that trade currencies between themselves in order to keep the banking system liquid. According to data compiled in 2013 by the Bank of International Settlements, the interbank network accounts for around 40% of the forex market's $5.3 trillion daily turnover.
Banks and large financial institutions trade with each other in order to ensure that they are liquid enough to satisfy the needs of their customers. Their customers range from other smaller banks without the credit relationships necessary to participate on the network, companies who require foreign exchange as part of their import and export cycle, forex brokers who act as intermediaries between the big banks and retail traders, and retail clients requiring access to cash and credit services. These institutions are able to borrow directly from central banks at wholesale prices, allowing them to access liquidity at better prices than all other market participants further down the chain. Their profits stem from the premiums they charge for the liquidity they provide to smaller institutions, companies, brokers and retail clients.
Primary dealers set the exchange rates on the currency pairs you trade. Forex being an entirely decentralised market there is no one price for any one currency pair, rather each institution will quote slightly differing prices depending on its own supply and demand dynamics. When we quote prices to our clients we aggregate the best bid and ask prices from our liquidity providers and execute your orders at the volume-weighted average price after charging either a commission (cTrader) or applying a small mark-up to the spread (MT4).
As part of their monetary policies, central banks set the rate at which commercial banks may borrow money (via repo we mentioned earlier) from the central bank. This lending rate will then dictate the rate at which banks lend between themselves. Owing to different supply and demand conditions the actual rate at which these transactions take place is constantly changing. These rates are known as libor rates. Libor rates are quoted from 1 week to 1 year. The longer the term, the less they are determined by the central bank rate. If I am a bank and want to lend you money for six months, the rate I charge is dependent on what I expect my funding costs to be over the coming 6 months. If I expect the central bank will lower its lending rate to me, then I will set the rate lower.
Multinational Companies
Twice removed from central bank liquidity we find the companies that also require access to the foreign exchange market. Businesses are among the largest clients of institutional dealers. This is because foreign exchange is essential to international commerce. Any international transaction involving selling products and services to clients or purchasing them from suppliers requires the buying and selling of foreign currencies. Globalisation has led to foreign exchange transactions being an indispensable part of the business cycle.
For example: An American consumer electronics giant orders components from Japan for its new line of products. It will have to settle the bill six months from the order date in Japanese yen. The company will have to purchase a large amount of yen with US dollars in order to do so. This can have a noticeable effect on the USD/JPY exchange rate when the transaction takes place. However the forex market being what it is, by the time the payment is due JPY may have risen against USD making the order more costly for the American company, thus throwing out its profit margin. The company may choose to exchange dollars for yen in advance in order to be certain of how much the transaction will cost, however this being a large order, it is unlikely that the company has sufficient cash reserves to purchase the required yen outright on the spot market and hold on to them until payment is due.
In order to hedge against the risk of an unfavourable exchange rate at a later date the firm may decide to enter into a forward or future contract with a willing party. This is done in order to hedge against market volatility and to guarantee that six months down the line the company will be able to purchase the required JPY to meet its obligations at the current price.
Another reason forex is so important to multinationals is that when conducting business in foreign markets they regularly have to repatriate funds. Depending on the size of the company this may be require extremely large foreign exchange transactions, which even when divided into separate orders will move the respective prices of the underlying currencies.
Traders
Traders are perhaps the most diverse group of market participants. Their influence depends on the capital they have at their disposal and how high up the hierarchy their liquidity is sourced from, meaning they can be located almost anywhere on the forex food chain. One thing, however, does unite all traders; the forex market is not something they use as a tool to help them conduct their everyday business, for them the FX market is their business. Traders are not interested in using the forex market to hedge against the risk of future purchases, or even to actually take possession of the currencies they trade. Traders are only concerned with profiting from price fluctuations, and what better market for them to trade on than the largest and most liquid in the world?
Hedge funds are one of the most impactful groups of currency speculators and can easily influence currency values due to the sheer size of the trades they regularly place. They are also among the most knowledgeable and experienced market participants. Hedge funds invest on behalf of individuals, pension funds, companies and even governments. They employ a number of different techniques including discretionary trading, algorithmic trading, a combination of both and fully automated high frequency trading. They also have very deep pockets and the power to make huge waves.
It may come as a surprise, then, that one of the most famous currency speculations of all time was made by an individual trader. In 1992 George Soros, an investor now known as "the man who broke the bank of England" used $1 billion (the entire value of his fund) with 1:10 leverage to short the pound sterling against the deutsche mark to the tune of $10 billion. The logic behind the trade being that sterling was overvalued due to the Bank of England refusing to devalue its currency after joining the Exchange Rate Mechanism (ERM) in 1990. Within 24 hours the sterling had dropped by around 5,000 pips. Soros liquidated his position a month later profiting from the now more valuable deutsche mark and walked away with $2 billion. Of course you as an individual retail trader are a far cry from the George Soroses of this world. Even at maximum leverage your positions are bound to be worth but a fraction of the trades that wealthy investors like Soros are able to command.
If you are dealing with a market maker then your buy orders are offset by the identical sell orders of other clients. By matching orders in this way brokers can keep them on their own order books and remain risk neutral. However, in practice a market maker's books rarely ever match up this neatly, making it necessary for them to hedge risk by taking their own counter-positions on the "real" market. This is where the conflict arises, by trading against you when your orders can't be reconciled with other orders on the book, your profit becomes your broker's loss and your loss becomes their profit.
Brokers like FxPro, who do not act as market makers and do not take on proprietary risk; forward client orders directly through to the dealing desks of the institutional dealers they source their liquidity from. When dealing with true brokers like us you receive the best respective bid and ask prices from a number of institutional liquidity providers and your orders are executed at the volume-weighted average price.
In the following section we will look a little closer at the retail forex market and at some of the advantages of being a small fish in a huge ocean.