

Sample Category Title
AUD/USD Weekly Outlook
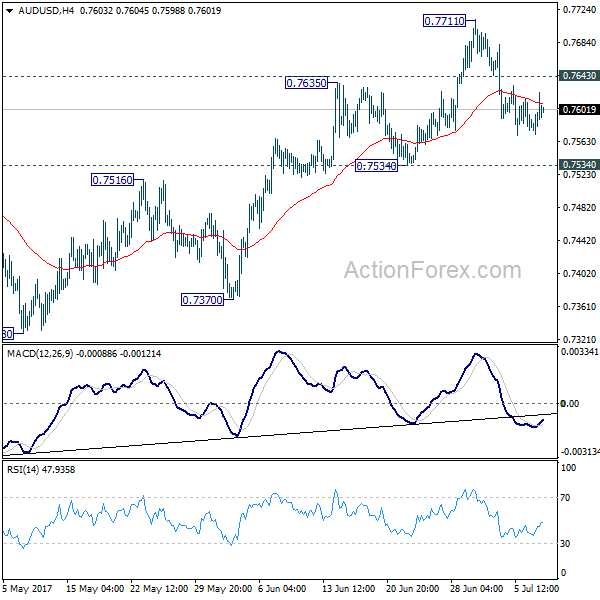
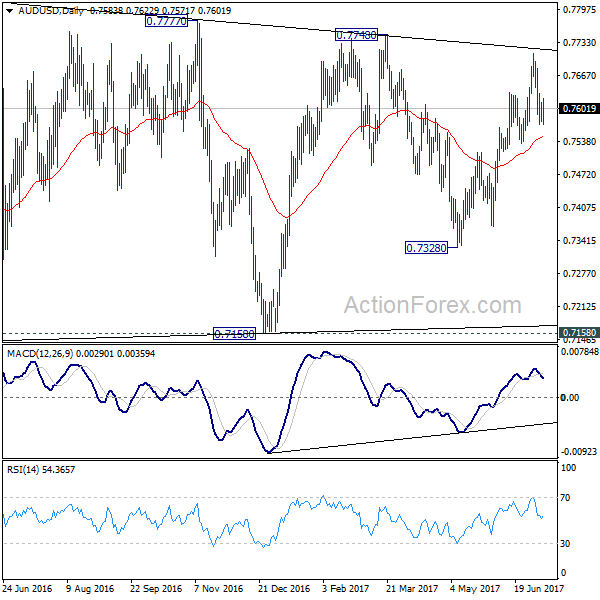
AUD/USD's corrective move from 0.7711 continued last week and outlook is unchanged. Initial bias remains neutral this week first. With 0.7534 support intact, another rise is in favor. Above 0.7643 minor resistance will bring retest of 0.7711. Break will extend the rally from 0.7328 to 0.7748 resistance and above. At this point, there is no clear sign of range breakout yet. Hence, we'd be cautious on topping again as it approaches medium term fibonacci level at 0.7849. On the downside, break of 0.7534 will indicate near term reversal and turn bias back to the downside for 0.7370 support.
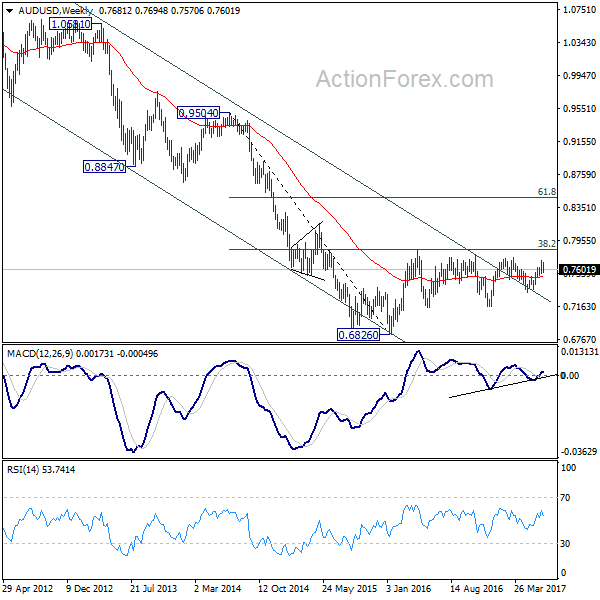
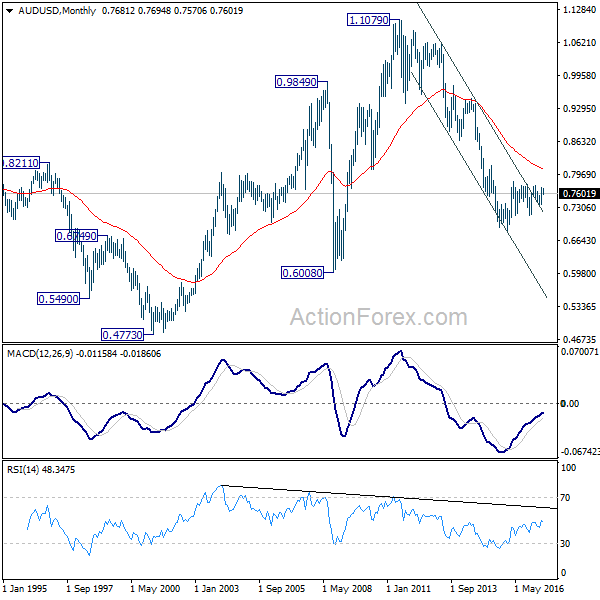
In the bigger picture, we're still treating price actions from 0.6826 low as a corrective pattern. And, as long as 38.2% retracement of 0.9504 to 0.6826 at 0.7849 holds, long term down trend from 1.1079 is expected to resume sooner or later. Break of 0.6826 low will target 0.6008 key support level. However, firm break of 0.7849 will indicate that rise from 0.6826 is developing into a medium term rebound, rather than a sideway pattern. In such case, stronger rise should be seen to 55 month EMA (now at 0.8082) and above.
In the longer term picture, while the down trend from 1.1079 might extend lower, we're not anticipating a break of 0.6008 (2008 low) yet. We'll look for bottoming above there to reverse the medium term trend.
USD/CAD Weekly Outlook
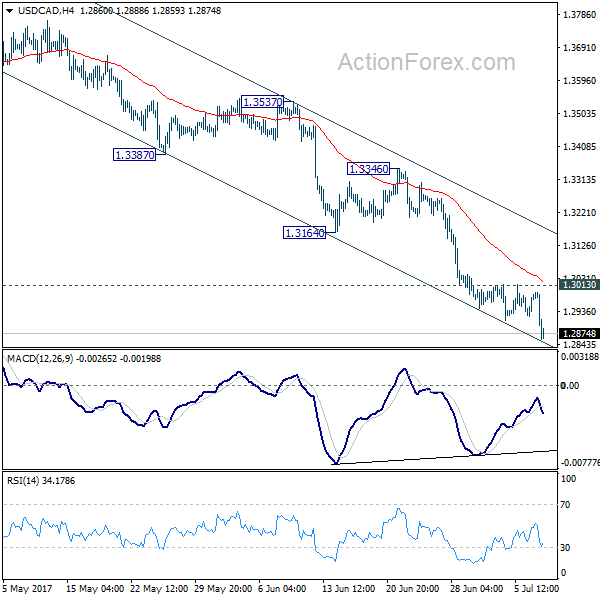
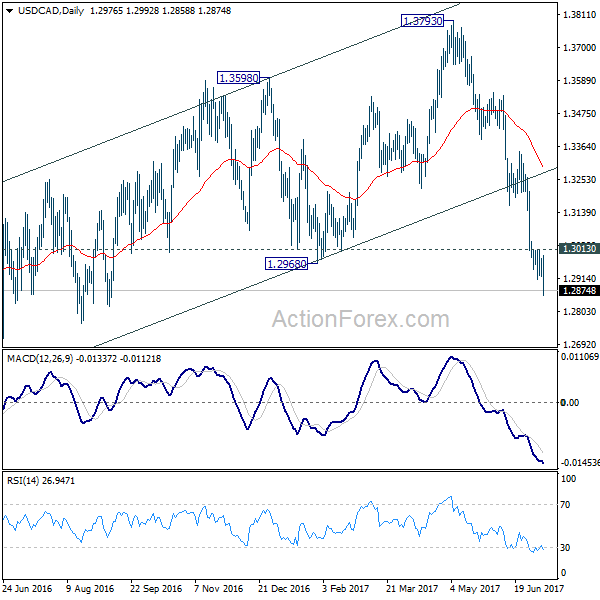
USD/CAD' fall continued last week and reached as low as 1.2858. Initial bias remains on the downside this week. Current decline from 1.3793 should target a test on 1.2460 low next. On the upside, break of 1.3013 resistance is needed to signal short term bottoming. Otherwise, outlook will remain bearish in case of recovery.
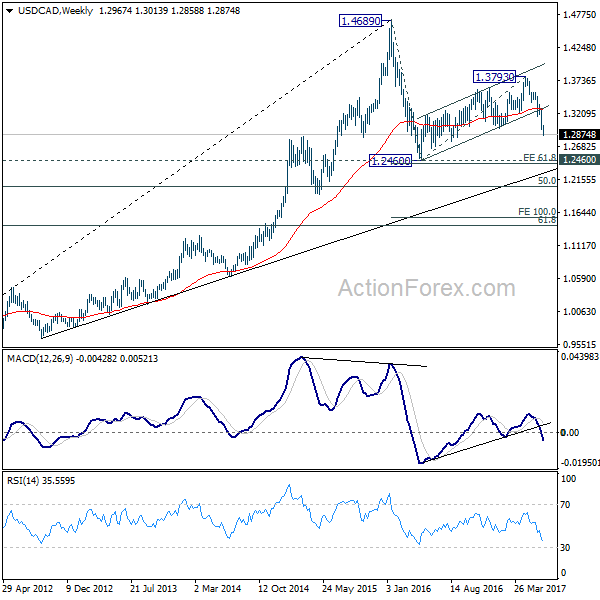
In the bigger picture, price actions from 1.4689 medium term top are seen as a correction pattern. The second leg should have finished at 1.3793. Break of 1.2460 will extend such correction to 50% retracement of 0.9406 to 1.4869 at 1.2048. At this point, we'd look for strong support from there to contain downside and bring rebound. However, firm break there will target 100% projection of 1.4689 to 1.2460 from 1.3793 at 1.1564.
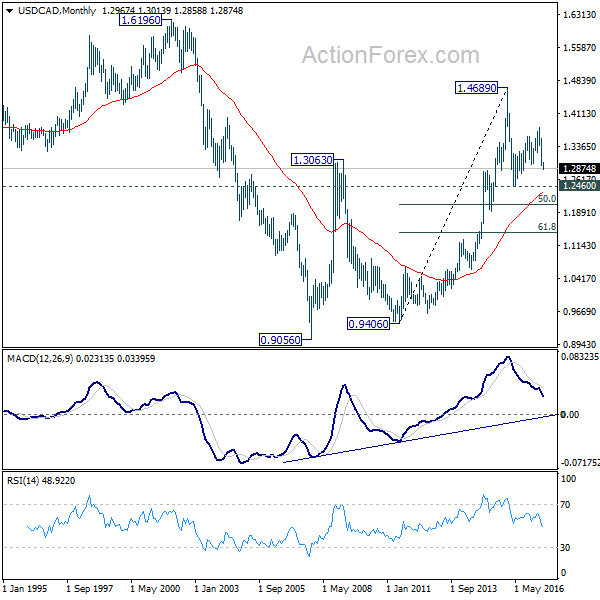
In the longer term picture, rise from 0.9056 (2007 low) is viewed as a long term up trend. It's taking a breath after hitting 1.4689. But such rise expected to resume later to test 1.6196 down the road. But firm break of 50% retracement of 0.9406 to 1.4869 at 1.2048 will raise doubt over this view.
EUR/GBP Weekly Outlook
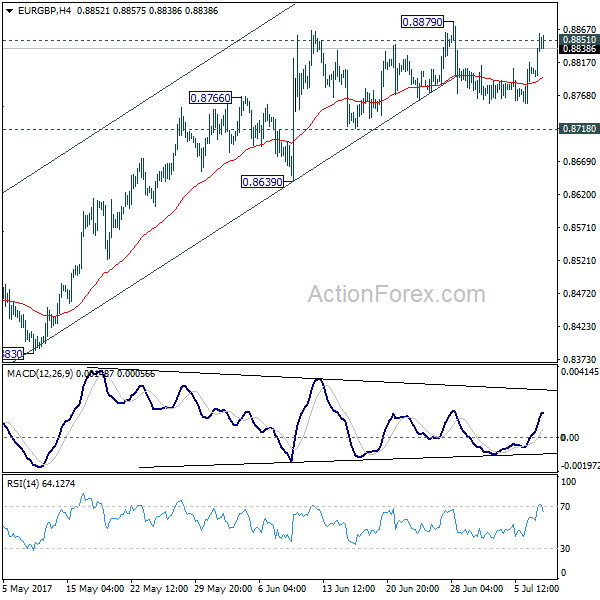
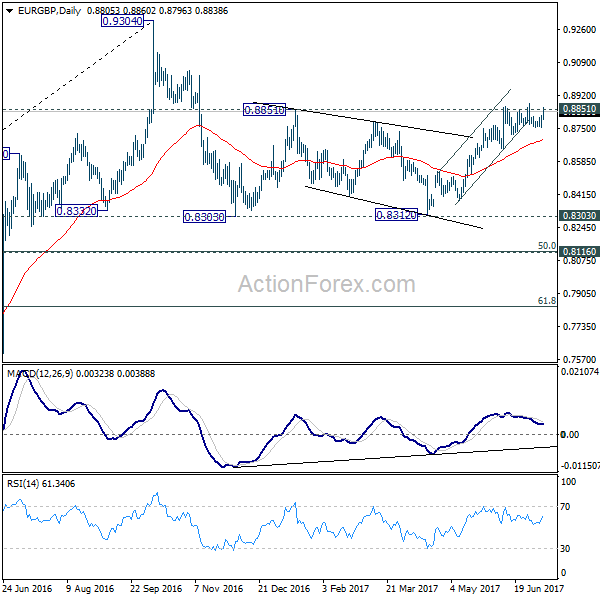
EUR/GBP rebounded towards the end of the week but stayed in range below 0.8879. Outlook is unchanged and initial bias remains neutral this week first. On the downside, break of 0.8718 support will argue that rise from 0.8312 has completed. In that case, intraday bias with be turned back to the downside for lower side of the range at 0.8312. Meanwhile, break of 0.8879 and sustained trading above 0.8851 will pave the way to retest 0.9304 high.
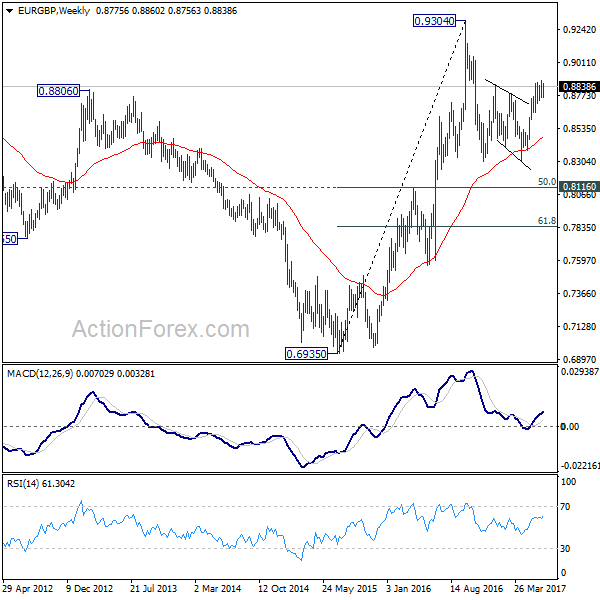
In the bigger picture, price actions from 0.9304 are viewed as a medium term corrective pattern. It's uncertain whether it is finished yet. But in case of another fall, we'd expect strong support from 0.8116 cluster support (50% retracement of 0.6935 to 0.9304 at 0.8120) to contain downside and bring rebound. Whole up trend from 0.6935 is expected to resume after consolidation from 0.9304 completes.
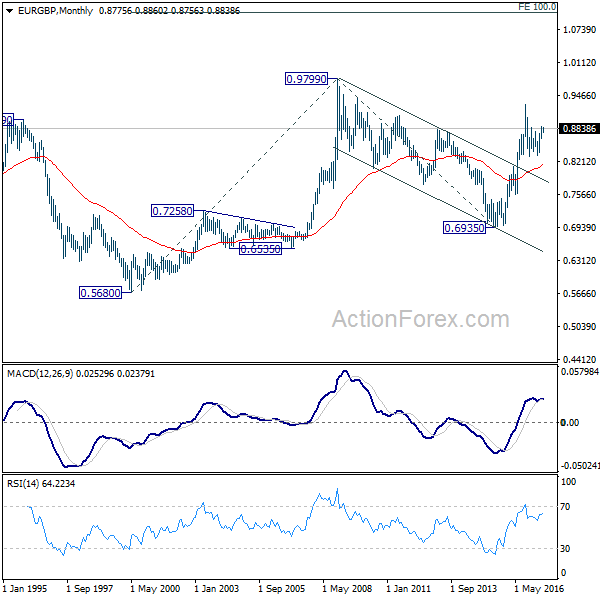
In the long term picture, firstly, price action from 0.9799 (2008 high) is seen as a long term corrective pattern and should have completed at 0.6935 (2015 low). Secondly, rise from 0.6935 is likely resuming up trend from 0.5680 (2000 low). Thirdly, this is supported by the impulsive structure of the rise from 0.6935 to 0.9304. Hence, after the correction from 0.9304 completes, we'd expect another medium term up trend to target 0.9799 high and above.
EUR/AUD Weekly Outlook
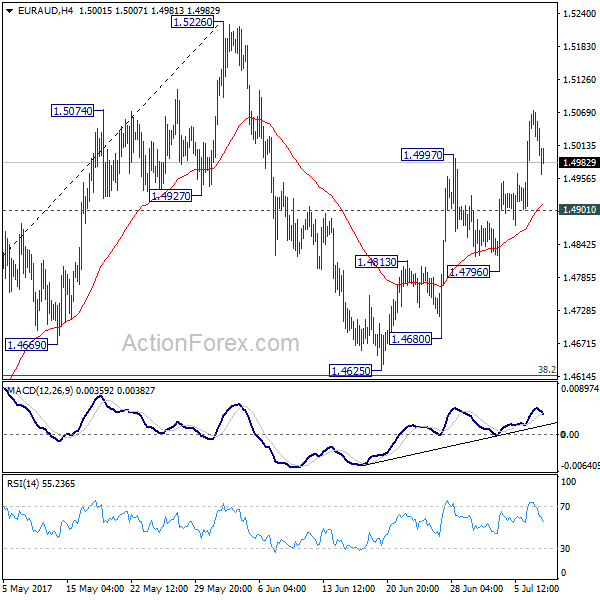
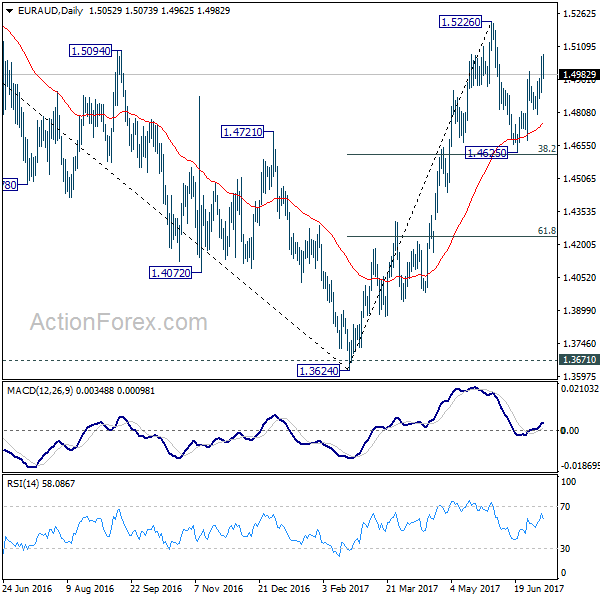
Despite brief pull back, EUR/AUD's rise from 1.4625 extended and hit as high as 1.5073. We're holding on to the view that pull back from 1.5226 has completed at 1.4625. Further rise is expected this week as long as 1.4901 support holds, for 1.5226. Rise from 1.3624 is possibly resuming. Break of 1.5226 will confirm and target 1.5455 fibonacci level next. On the downside, however, break of 1.4901 minor support will dampen this bullish view and turn bias back to the downside.
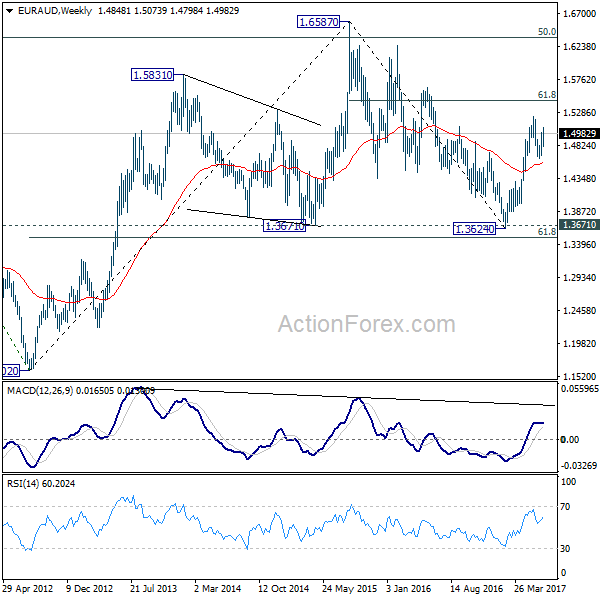
In the bigger picture, price actions from 1.6587 medium term top are viewed as a corrective pattern. Such correction should be completed at 1.3624 after defending 1.3671 key support. Rise from 1.3642 would extend to 61.8% retracement of 1.6587 to 1.3624 at 1.5455. Sustained break there will pave the way to retest 1.6587. However, sustained break of 1.4625 support will dampen this bullish view. In that case, we'll assess the outlook later after looking at the structure and depth of the pull back.
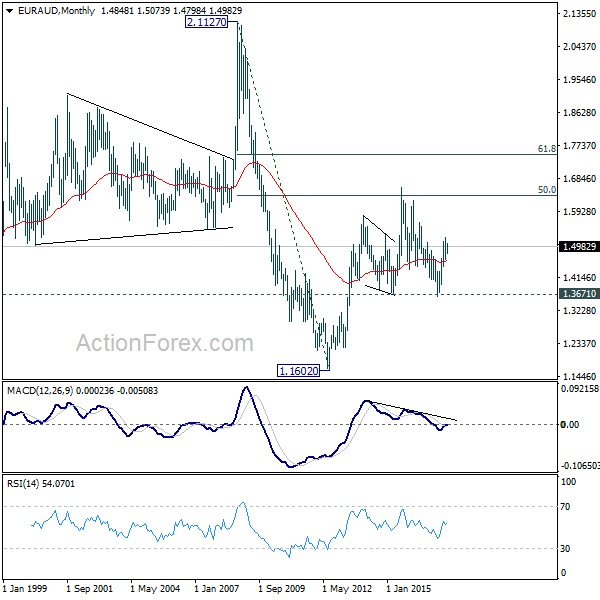
In the longer term picture, the rise from 1.1602 long term bottom isn't over yet. We'll keep monitoring the development but there is prospect of extending the rise to 61.8% retracement of 2.1127 to 1.1602 at 1.7488 and above. However, sustained trading below 1.3671 should confirm trend reversal and target 1.1602 long term bottom again.
EUR/CHF Weekly Outlook
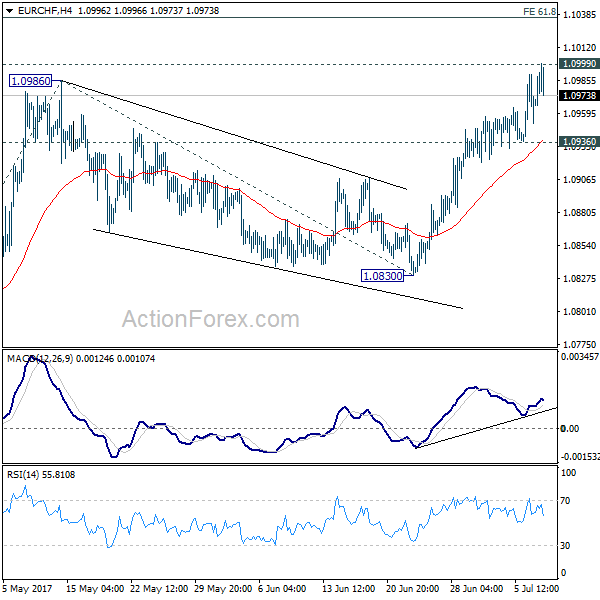
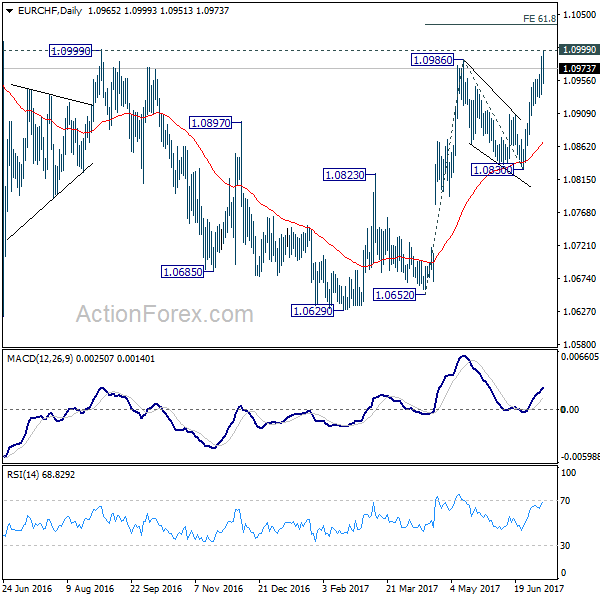
EUR/CHF's rally extended last week and reached as high as 1.0999, touching 1.0999 medium term resistance. Initial bias stays on the upside this week. Current rally would target 61.8% projection of 1.0652 to 1.0986 from 1.0830 at 1.1036 next. On the downside, break of 1.0936 support is needed to indicate short term topping. Otherwise, outlook will remain bullish in case of retreat.
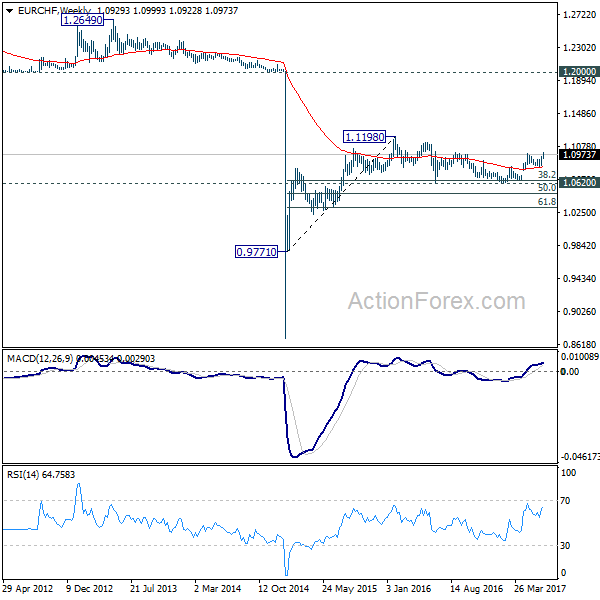
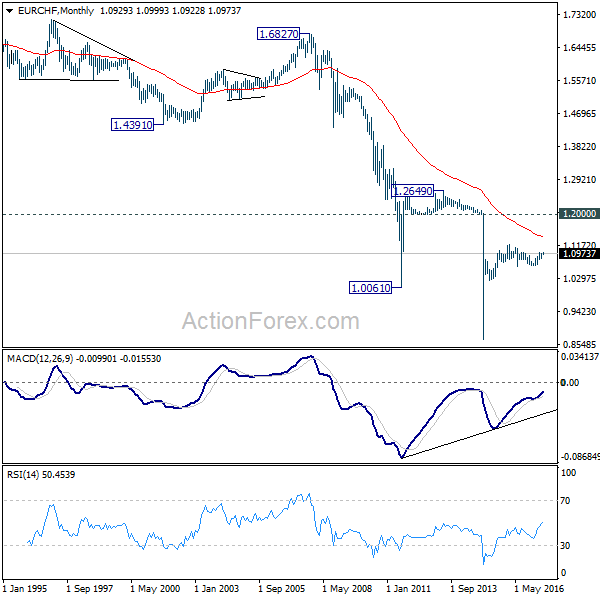
In the bigger picture, the price actions from 1.1198 are seen as a corrective move. Such correction could have completed after defending 38.2% retracement of 0.9771 to 1.1198 at 1.0653. Decisive break of 1.0999 resistance will target a test on 1.1198 high. For now, this will be the preferred case as long as 1.0830 support holds.
GBP/JPY Weekly Outlook
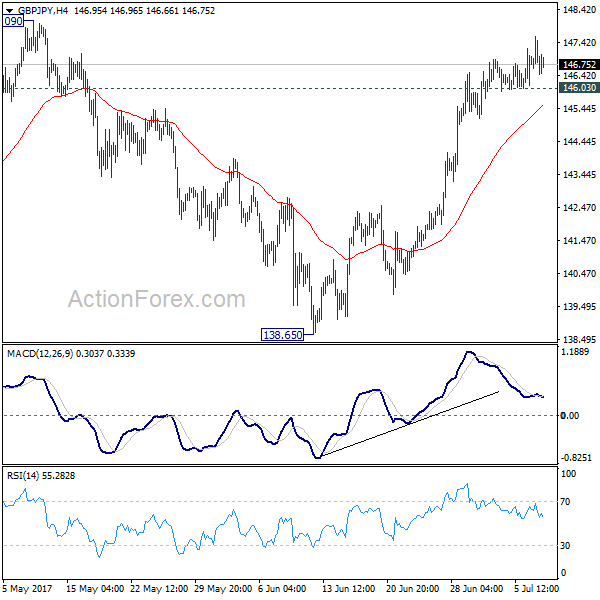
GBP/JPY edged higher to 147.06 last week as rise from 138.65 extended. But upside momentum has been rather unconvincing with 4 hour MACD staying below signal line. Further rise is mildly in favor this week for 148.09/42 resistance zone. Decisive break there will extend whole rally from 122.36 to long term fibonacci level at 150.43 next. Nonetheless, break of 146.03 minor support will indicate short term topping. In such case, bias will be turned back to the downside for pull back towards 55 day EMA (now at 143.02).
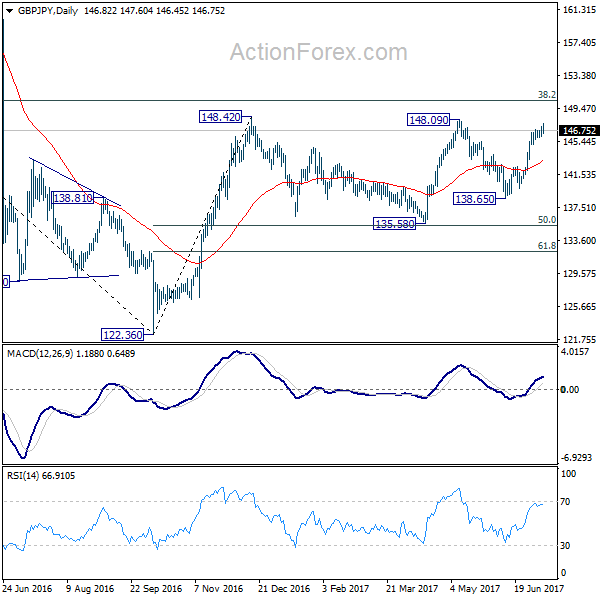
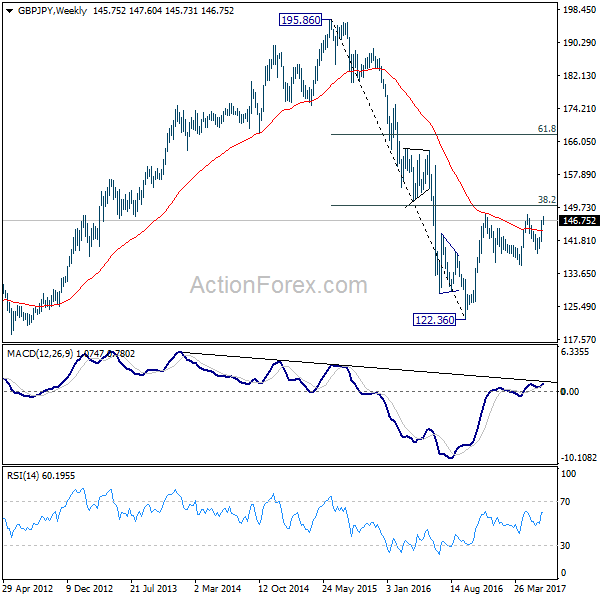
In the bigger picture, rise from medium term bottom at 122.36 is expected to continue to 38.2% retracement of 196.85 to 122.36 at 150.43. Decisive break there will carry long term bullish implications and pave the way to 61.8% retracement at 167.78. In case the sideway pattern from 148.42 extends, we'd be looking for strong support from 135.58 and 50% retracement of 122.36 to 148.42 at 135.39 to contain downside.
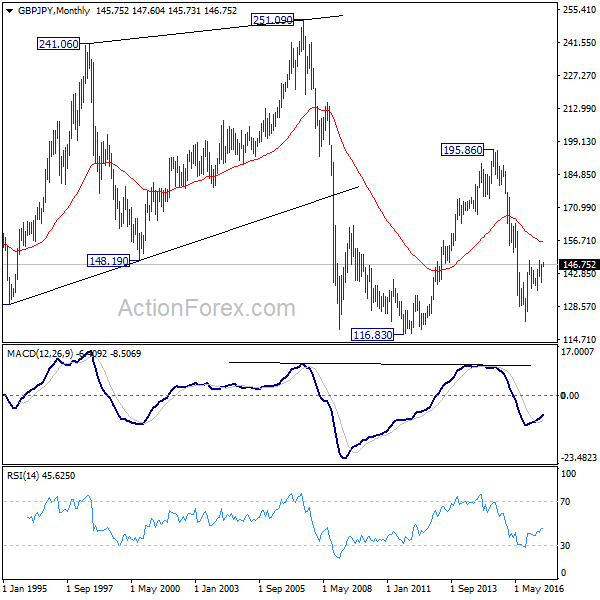
In the longer term picture, it remains to be confirmed is whole down trend from 195.86 has completed at 122.36 already and there is no confirmation yet. But in any case, firm break of 38.2% retracement of 196.85 to 122.36 at 150.43 would pave the way to 61.8% retracement at 167.78. And with that, the 55 month EMA will be firmly taken out which suggests that price actions from 116.83 is indeed a sideway pattern that could last more than a decade.
EUR/JPY Weekly Outlook
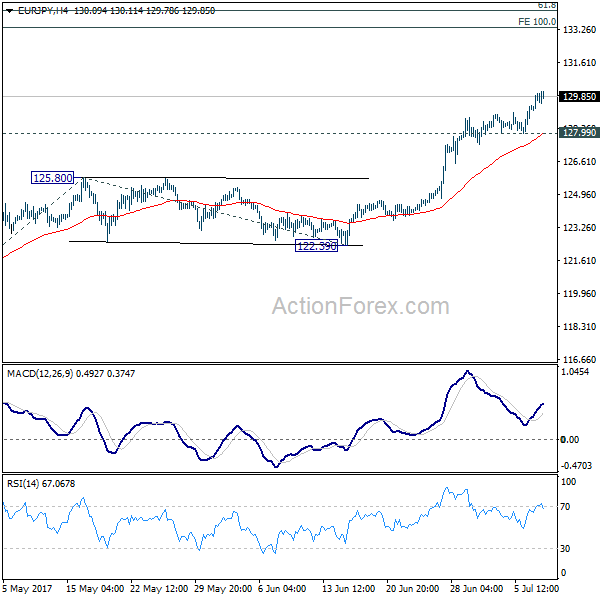
EUR/JPY rally accelerated to as high as 130.11 last week as and met medium term projection level at 129.89. Initial bias remains on the upside this week. Sustained trading above 129.89 will pave the way to next near term target at 100% projection of 114.84 to 125.80 from 122.39 at 133.35. On the downside, break of 127.99 support is needed to indicate short term topping. Otherwise, outlook will remain bullish in case of retreat.
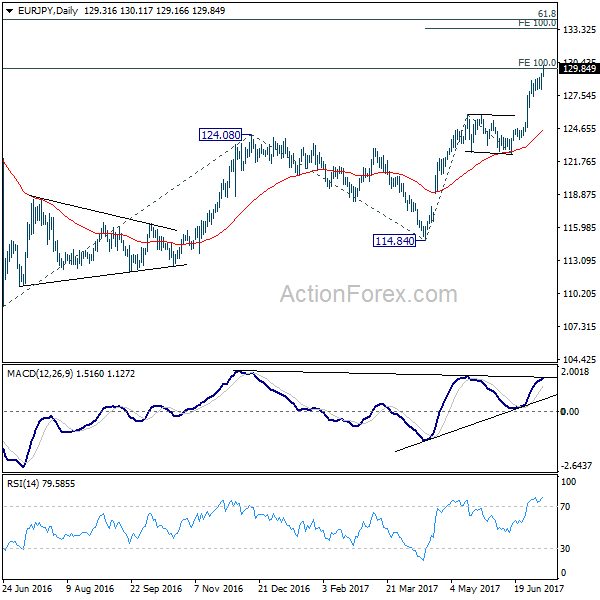
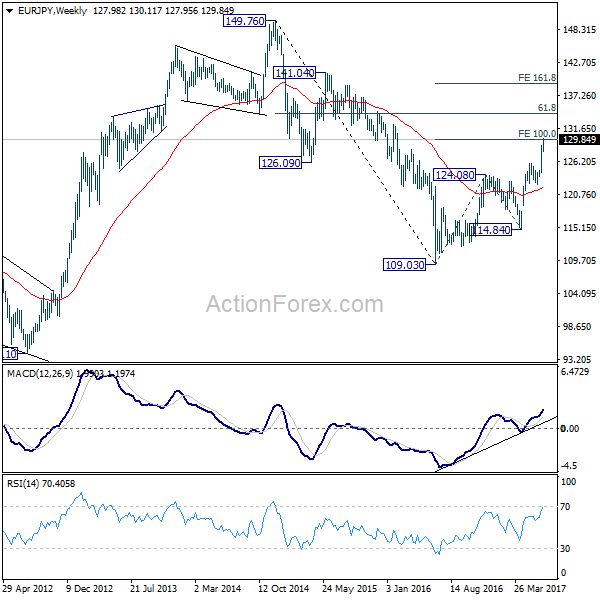
In the bigger picture, the down trend from 149.76 (2014 high) is completed at 109.03 (2016 low). Current rally from 109.03 should be at the same degree as the fall from 149.76 to 109.03. Further rise is expected now to 61.8% retracement of 149.76 to 109.03 at 134.20. Sustained break there will pave the way to key long term resistance zone at 141.04/149.76. Medium term outlook will remain bullish as long as 124.08 resistance turned support holds.
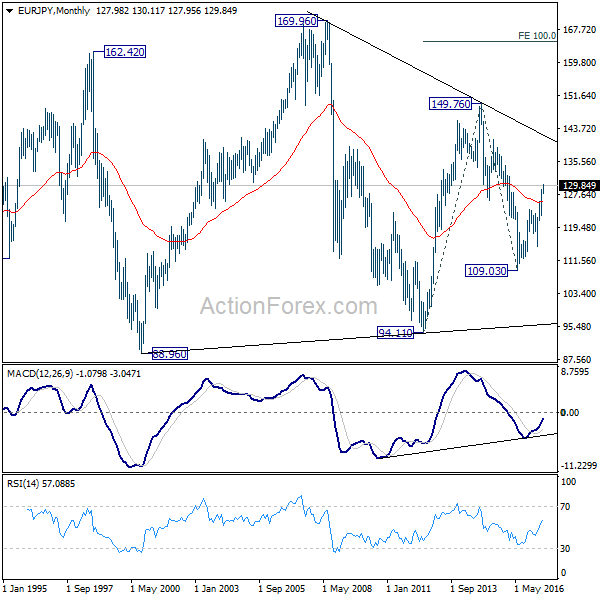
In the long term picture, at this point, there is no clear indication that rise from 109.03 is resuming that from 94.11. Hence, we'd be cautious on topping below 149.76 to extend range trading. Nonetheless, firm break of 149.76 will indicates strong underlying buying. In such case, EUR/JPY will target 100% projection of 94.11 to 149.76 from 109.03 at 164.68.
Canadian Dollar Shone as BoC Expected to Hike This Week, Dollar Recovered in Corrective Way
Central bank comments and rate expectations continued to be the main drivers in the global financial markets last week. However, the developments reminded us that no matter how hawkish central bankers sound, monetary policies have to be supported by data. Canadian Dollar being an example that BoC Governor Stephen Poloz's hawkish comments were supported by strong employment data. And the Loonie ended as the strongest major currency as markets are generally expecting a BoC rate hike on July 12 this week. Dollar ended as the second strongest one after solid ISM indices and non-farm payroll headline number even though markets are not convinced of a September Fed hike. Meanwhile, Euro was the third strongest as markets perceived the ECB monetary policy meeting accounts as a hawkish one.
On the other hand, Yen tumbled across the board as central bank expectations pushed global bond yields sharply higher. Sterling ended as the second weakest one after a string of weaker than expected economic data raised doubt on whether BoE is really ready for a rate hike. Australian Dollar ended as the third weakest as markets were disappointed that RBA didn't turn hawkish after keeping interest rates unchanged.
Global yields rallied on stimulus exit expectations, BoJ announced emergency bond operations
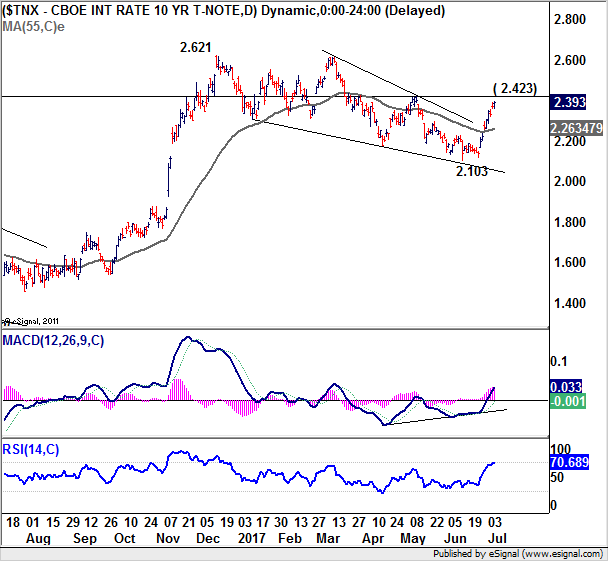
The entering into of an era of monetary stimulus exit remained the main theme in the markets. This was clearly reflected by surging global bond yields. In particular German 10 year bund yields surged on hawkish ECB accounts to close at 18 month high at 0.57%. (More on ECB in June's Minutes Revealed ECB Discussed over Removing Asset Purchases Guidance, Euro Soars) That took global yields generally high. The US 10 year yield extended recent rise from 2.130 to close at 2.393. The development further affirmed the case that consolidation pattern from 2.621 has completed at 2.103 already. 2.423 is now the key level to watch in July. Firm break there will likely send TNX through 2.621 high to resume the larger up trend.
Yen suffered most from there development and was sold off broadly. In response to the surge in global bond yields, BoJ announced to carry out an emergency fixed-rate bond buying operation to curb long term yields under the so called "Yield Curve Control" framework. The central bank said it will buy unlimited amount of JGB with maturities of 5 to 10 years. This is the third time BoJ carries out such operations since the announcement of YCC last year. The first offer in November drew no bids. Under the second operation in February, JPY 723.9b in bonds were purchased.
Markets unconvinced of September Fed hike, Dollar index in corrective recovery
Dollar responded positively to last week's economic data releases but buying was far from being decisive. ISM manufacturing index rose from 54.9 to 57.8 in June. ISM services rose from 56.9 to 57.4. NFP showed 222k growth in June versus expectation of 173k. Prior month's figure was also revised up from 138k to 152k. However, unemployment rate rose 0.1% to 4.4%. And more importantly, average hourly earnings rose 0.2% mom versus expectation of 0.3% mom. Prior months wage growth was also revised down from 0.2% mom to 0.1% mom.
The FOMC minutes for the June meeting unveiled that members were divided over the timing of balance sheet reduction while there was also discussion over the recent inflation weakness. While "several preferred to announce a start to the process within a couple of months", "some others emphasized that deferring the decision until later in the year would permit additional time to assess the outlook for economic activity and inflation". Regarding softer inflation reading, most members viewed the weakness as "largely reflecting idiosyncratic factors, including sharp declines in prices of wireless telephone services and prescription drugs. They expected these developments as transitory and having "little bearing on inflation over the medium run". More in FOMC Members Divided over Balance Sheet Reduction Schedule.
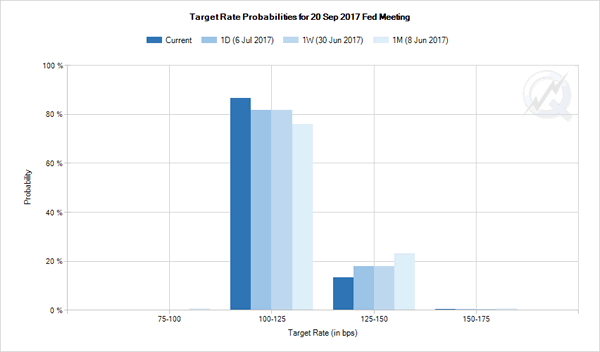
In spite of all the talks, markets are clearly unconvinced by the chance of another Fed hike in September. Fed fund futures are pricing in around 13.6% chance of that, down from 18.4% even after the solid economic data release. Markets will now look into Fed chair Janet Yellen's testimony this week for more guidance. It should be pointed out again that even if Fed is still on course for three hikes this year, the committee has an option to start shrinking the balance sheet in first in September and hike in December. Or of course FOMC has the option of doing just one of the two in the second half of the year.
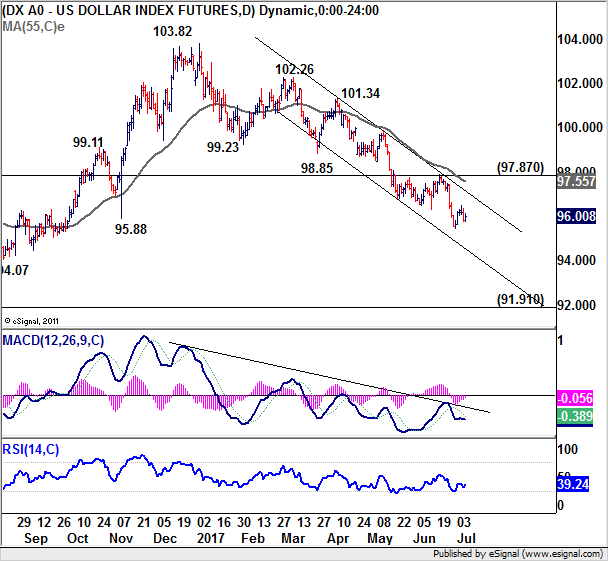
Also, while the dollar index recovered last week, the weak momentum and suggests that it's mainly a corrective move. The index is held well below 97.87 near term resistance, below the falling 55 day EMA, and bounded inside medium term falling channel. Whole fall from 103.82 is still on course, as a long term correction, to 91.91 key support level, before getting enough support for sustainable rebound.
Markets are mean if you don't turn hawkish
BoC Governor Stephen Poloz said in a newspaper interview that the central bank has to look through near term "fairly soft" inflation reading and anticipate the picture 18 to 24 months ahead. Otherwise, "we'd always be two years behind in the reaction." And, the rest of BoC's model suggested that output gap would close some time in first half of 2018 and inflation will then be well into an up trend. Thus, it's appropriate to start removing some of the monetary stimulus. Also, job data from Canada showed strong growth of 45.3k in June, while unemployment rate fell to 6.5%. Markets are now generally expecting a 25bps hike by BoC this week to 0.75%.
On the other hand, RBA left the cash rate unchanged at 1.5% in June. While the decision had been widely anticipated, Aussie slumped after the announcement as the central bank failed to deliver a more hawkish tone as some of the global counterparts did. Policymakers affirmed that Australian economy would continue to grow gradually. Yet, they pointed to the strength in Australian dollar and subdue inflation as key reasons for standing on the sideline. Meanwhile, RBA remained concerned over the overheating housing market. More in RBA Disappointed As It Failed To Hint Rate Hike.
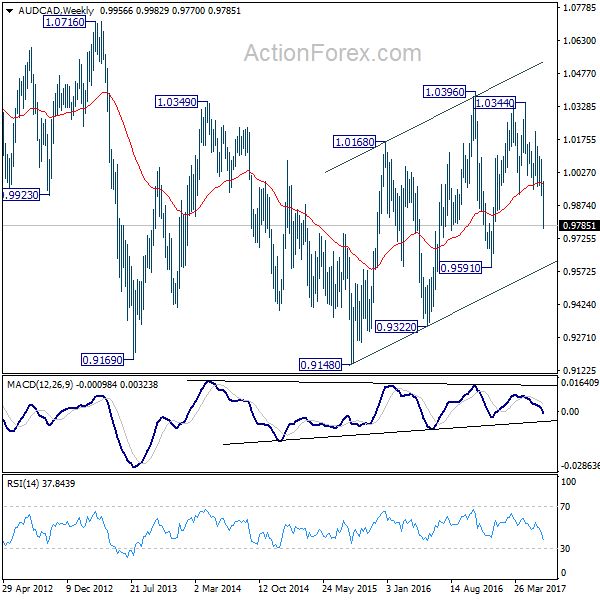
The contrast in market reactions is clearly seen in AUD/CAD, whose decline accelerated to as low as 0.9770 last week. The structure of price actions since 2011have been corrective. And, that from 2015 low at 0.9148 is also corrective. There is no clear sign of a medium term reversal yet, not is there indication of a long term term. But in any case, for now, AUD/CAD will likely extend the fall from 1.0344 to channel support (now at 0.9592), which is closed to 0.9591 support.
Trading strategy: All positions closed, wait and see first
Regarding trading strategy, firstly we closed our EUR/GBP (bought at 0.8740) at open at 0.8770 last week, wit 30 points profit. The buy GBP/JPY on dip to 144.00 was not filled as the weekly low was 145.73. We'll cancel this buy GBP/JPY order first as recent economic data are not supportive for a BoE hike yet. Also, while the overall sell Yen strategy was correct but we were not quite correct in anticipating strength in the pound.
Regarding the USD/CAD short (sold at 1.3510), we were not wrong in anticipating resilience in the Canadian Dollar. It was first supported by rebound in oil price. And just as oil reverses, there came hawkish BoC comments and then strong job data. However, our protective stop at 1.3010 was just too tight that it was hit when USD/CAD recovered to 1.3013. Hence, the position was exited with 500 pts profit.
Technically, we're still expecting more broad based strength in Canadian Dollar ahead. And, USD/CAD's decline from 1.3793 is expected to head for a test on 1.2460. But for the near term, there is risk of a sell-on-fact pull back as BoC delivers a rate hike this week. In particular, short covering in USD/CAD can be quite violent if BoC indicates that this hike is just a one-off. Hence, we'll hold our hands off on USD/CAD first.
Overall, we're still expecting more Yen weakness ahead but it's now deeply oversold. Dollar selling might come back after Fed Chair Yellen's testimony. Euro might start to regain strength again if June inflation reading is supportive to ECB tapering. But for the moment, we'll avoid opening positions first.
EUR/JPY Weekly Outlook
EUR/JPY rally accelerated to as high as 130.11 last week as and met medium term projection level at 129.89. Initial bias remains on the upside this week. Sustained trading above 129.89 will pave the way to next near term target at 100% projection of 114.84 to 125.80 from 122.39 at 133.35. On the downside, break of 127.99 support is needed to indicate short term topping. Otherwise, outlook will remain bullish in case of retreat.
In the bigger picture, the down trend from 149.76 (2014 high) is completed at 109.03 (2016 low). Current rally from 109.03 should be at the same degree as the fall from 149.76 to 109.03. Further rise is expected now to 61.8% retracement of 149.76 to 109.03 at 134.20. Sustained break there will pave the way to key long term resistance zone at 141.04/149.76. Medium term outlook will remain bullish as long as 124.08 resistance turned support holds.
In the long term picture, at this point, there is no clear indication that rise from 109.03 is resuming that from 94.11. Hence, we'd be cautious on topping below 149.76 to extend range trading. Nonetheless, firm break of 149.76 will indicates strong underlying buying. In such case, EUR/JPY will target 100% projection of 94.11 to 149.76 from 109.03 at 164.68.
Eco Data 7/14/17
[php_everywhere] [/php_everywhere]
Eco Data 7/13/17
[php_everywhere] [/php_everywhere]