Sample Category Title
06 – Technical Analysis
Technical analysis is a method of price forecasting that involves pattern recognition on a chart. Analysts employ various tools to identify levels of support and resistance, breakouts and breakdowns, trends and trading ranges. Knowing the strategies basics, one can likely find oneself able to implement some of the key elements into a self-designed strategy.
Charts
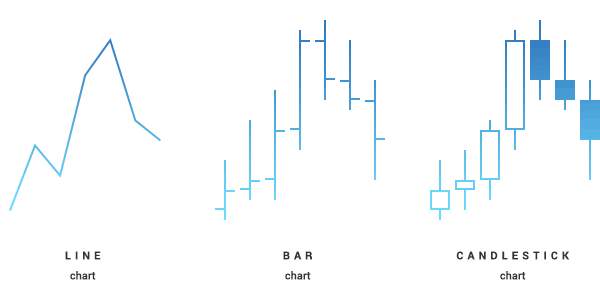
A chart is a graphic representation of how the price changes within the set period of time. In almost any trading platform you will find candlestick, bar and line chart types. All three are based on the same data but display them in different ways.
- Line chart is a simple and basic type that only shows closing prices.
- On the bar chart you can observe open, high, low and closing prices for each period of time. The vertical line is created by high and low prices, the dash on the left shows the open price and the dash on the right represents the close price.
- Perhaps the most popular type, candlestick chart shows open, high, low and closing prices during the set period of time as well. Each candlestick consists of the "body" created by open and closing prices and the "wicks" that show high and low prices for each period. This type of chart is usually displayed in two different colours - one represents bullish candlesticks while the other represents bearish. Bullish candlestick means that close price was higher than open price while bearish candlestick represents the opposite - close price was lower than open price.
Note, however, that all of the charts described above show bid price only and you should not rely on them to identify where the ask price was at any given time.
Timeframes
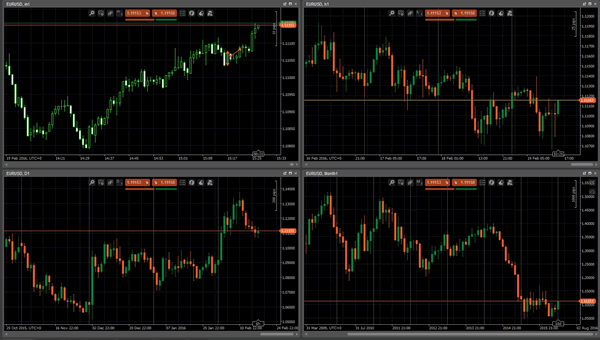
Time frame denotes the amount of time it takes to complete each candle or bar and how much data it includes. For example, time frame H1 shows how much the bid price fluctuated within an hour. You can customize time frame for each chart in your trading platform.
In general, shorter times frames are believed to produce more signals, however a significant part of them tends to be false. In contrast, longer time frames may provide relatively less signals but they will be stronger and more significant for a particular trend.
Here is how the same price data look when you change periodicity:
Trend
Identifying the trend or the direction the market moves towards is one of the basic techniques in the analysis. Occasionally it can be determined by simply looking at the chart. Other cases will require more profound analysis of the price data.
There are two major types of market trends:
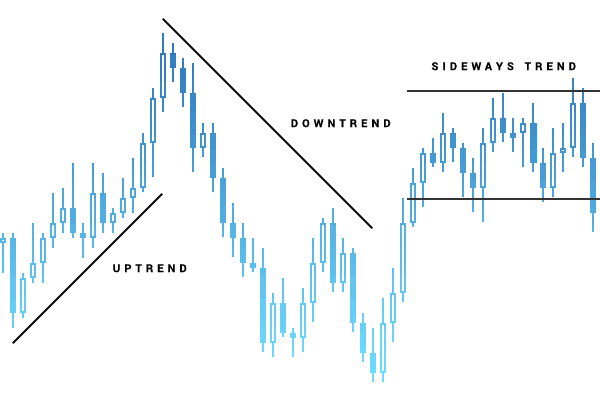
- Uptrend - a series of escalating highs and lows;
- Downtrend - a series of lower highs and lower lows on chart.
A lack of any particular direction is occasionally referred as to sideways or horizontal trend.
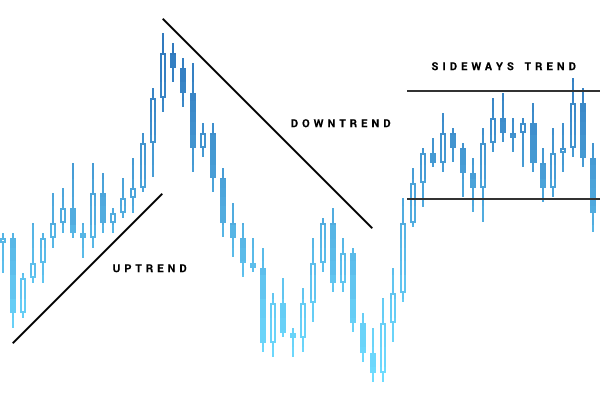
To identify a trend you can simply draw a straight line in the direction of the price moves on a chart. "Trend lines" are available in almost every trading platform and may be considered one of the beginner-friendly technical analysis tools. Another option is a technical indicator that can determine and display a trend when added to a chart.
Support and resistance
Finding support and resistance levels allows to determine when and in which direction should a position be opened and the potential profit or loss may be. Support is the price level which an asset has difficulty going below and resistance denotes the level which the pair has a difficulty rising above. These levels, however, do not always hold and a "breakout" or a "breakdown" occasionally occurs in one direction or another.
Support and resistance levels form a trading range - a horizontal corridor that contains price fluctuations during a period of time.
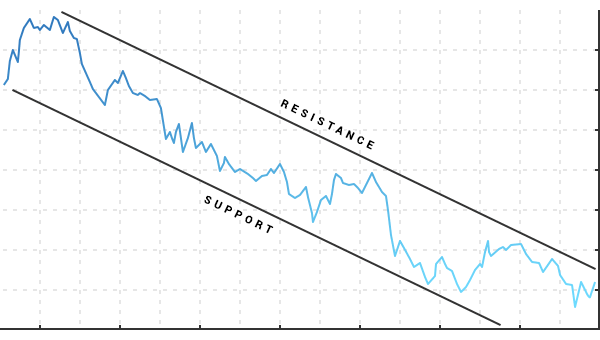
A price movement through the identified level of resistance is referred to as breakout. Its bearish counterpart is called breakdown - a price movement through the identified level of support. Both breakout and breakdown are usually followed by increase in volatility.
To identify support and resistance you can simply mark the levels where the price had difficulty rising above and falling below in the past. Various technical indicators (i.e. Fibonacci or Pivot Points) can determine and draw the levels on the chart automatically.
Chart patterns
Chart pattern is a distinct formation that predicts future price movement or creates a buy or sell signal. The theory behind it is basedon the assumption that certain patterns observed previously indicate where the price is currently headed.
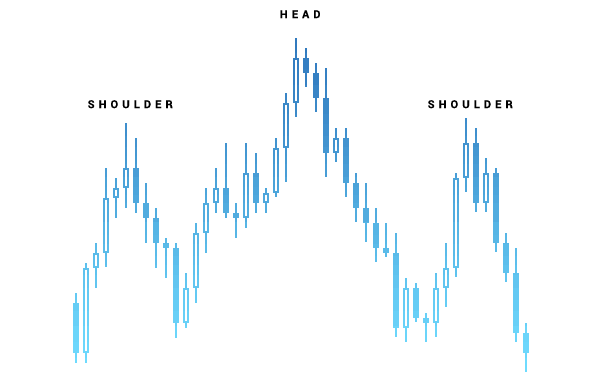
- Head and Shoulders is considered to be one of the most reliable chart patterns which signifies that the trend is about to change. There are two types of this pattern - head and shoulders top that shows that upward movement may soon end and head and shoulders bottom, which means that downtrend is about to reverse.
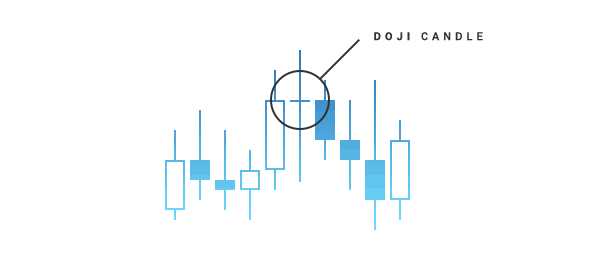
- Doji - is a candle with a short body (which means that the candle opened and closed at almost the same price) and relatively long wicks on each side that show market volatility during a period of time. Doji usually signifies market indecision since neither bullish nor bearish trend prevails.
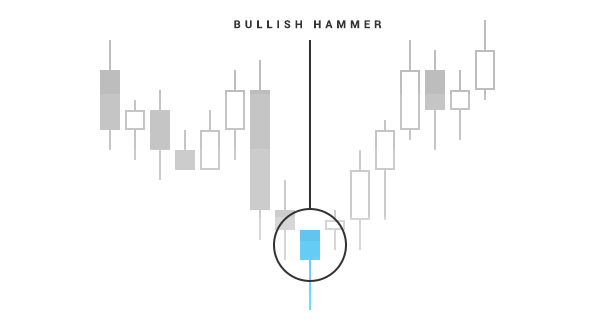
- Bullish hammer - a candle that usually occurs at a turn of the downtrend. This candle must have wicks twice as long as the body.
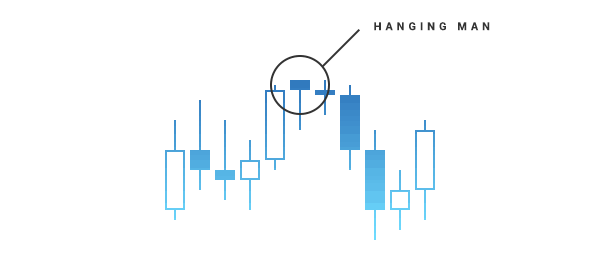
- Hanging man - bearish counterpart of bullish hammer that has a shorter body and long wicks and is usually found at the before the reversal of the uptrend.
- Another popular chart pattern is the triangle. There are three types of triangles: symmetrical, ascending and descending. The symmetrical triangle is a pattern where two trend lines that meet at one point and neither of them is flat. This pattern usually confirms the direction of the current trend. In an ascending triangle, the upper trendline is flat and the lower one is headed upwards. This pattern is considered to be bullish and may predict a breakout. Descending triangle has a flat lower line and the upper trendline is descending. Descending triangle is a bearish pattern signifying an upcoming breakdown.
Indicators
One of the tools that allows to predict or confirm trends, patterns, support and resistance levels or buy and sell signals is a technical indicator. It is a software developed specifically for your trading platform that makes calculations based on price movements and volatility. Both cTrader and MT4 have a wide range of readily available indicators, however you can always download a custom one or even create it yourself.
Simply adding an indicator to a price chart may greatly extend your understanding of the current market situation and help to decide in which direction you should be trading. For instance, to identify support and resistance levels, such indicators as Fibonacci or Pivot Points may come in handy. Momentum indicator will help you to measure the rate of price change and Zig Zag can be used to predict when the trend will be more likely to reverse.
05 – Trading Strategies
Forex trading strategies vary in time and effort required, analysis and tools they are based on and, most importantly, market situation they suit. Getting familiar with several strategies may prove beneficial for your trading.
Below you will find a brief description of several commonly used trading strategies. Note, however, that you do not have to follow them to the letter. Whichever strategy you choose, feel free to modify it whenever market situation dictates. Before applying a strategy to your real trading, you can test it risk free on a demo account.
Position trading
Position trading is a polar opposite of scalping: it is a long term strategy where trades can be open for days, weeks or even months. The main objective is to gain substantial profit by participating in a major trend. It requires a proper understanding of fundamentals and a deposit sufficient to sustain minor adverse price fluctuations.
When applying this strategy keep in mind thatpositions held for more than one day are subject to swaps or rollover fees. In MT4, swap is applied to all orders opened from 23.59 to 00.01 (server time). Forex calculator available on our website provides swap charges for both long and short positions.
In cTrader, however, fee is applied when you keep an order open from Friday to Monday.
Hedging
Hedging is a strategy that is often employed to reduce the risk exposure in case of adverse price fluctuations. A hedge trade is opened in opposite direction to a primary position; required margin in this case is divided among the two orders.
However, even when the trades are hedged you still may be at a risk of suffering significant losses. Since buy orders are closed at bid price and sell orders are closed at ask price, spreads widening can increase the loss for both long and short position.
News Trading
Hundreds of economic news are released around the world every day. While some of these news events have little to no impact on the market, others are followed by sharp moves and increased volatility. News traders seek to predict how the market is going to react to a particular event.
Economic calendar is the major tool a news trader employs to track the upcoming releases and predict how can they affect the market. All events scheduled for the current or the following week can be filtered by impact, country, category and time. Since currencies are always traded in pairs, news from both countries involved should be taken into consideration.
In the Economic Calendar you will also find a forecast provided by a financial news agency that conducted a survey among a number of economists regarding their opinion on a particular event. The more actual release data differ from the forecast, the sharper move you can expect.
Scalping
Scalping is a trading strategy that allows you to benefit from minor price fluctuations that occur throughout trading day. Scalpers aim to gain several pips per each trade rather than receive large profit on one position.
Scalping is often considered one of the most profitable strategies since smaller market moves are usually easier to obtain and are more frequent than larger ones. Moreover, it can lessen the risk exposure as the trades are relatively short term. However, it is still recommended to combine it with various risk management techniques and factor in the volatility increase that may occur during major news releases.
Scalpers frequently implement basic technical analysis into their strategy to identify short term market trends. For example, a trader can open a position with 2 pip stop loss and close it once it has gained 3 to 5 pips in profit if the price is approaching support or resistance level, a pivot point or Fibonacci level.
Another key aspect to consider before applying this strategy is the choice of the broker. A number of companies simply prohibit scalping or restrict minimal order length. Tight spreads and low latency in execution are more preferable for those who choose this strategy. OctaFX competitive spreads along with no trading commission and market execution under 0.1 second provide a suitable environment for scalpers.
GRID TRADING
Grid trading strategy involves placing pending orders at regular intervals above and below a predefined price level. It does not require definitive forecasting of market direction and can be easily implemented when there is no clear trend.
| Level | Order | Open price | Level | Order | Open price | Hedge |
|---|---|---|---|---|---|---|
| 1 | Buy Stop | 1.35150 | -4 | Sell Stop | 1.34400 | -75 |
| 2 | Buy Stop | 1.35300 | -3 | Sell Stop | 1.34550 | -75 |
| 3 | Buy Stop | 1.35450 | -2 | Sell Stop | 1.34700 | -75 |
| 4 | Buy Stop | 1.35600 | -1 | Sell Stop | 1.34850 | -75 |
| Maximum grid loss (pips) | -300 |
Martingale
Originally introduced in the 18th century, martingale was a betting strategy based on probability theory. The underlying principle it is to double the bet anytime you lose; eventually one winning bet will cover all previous losses. It follows the same principle when applied to forex trading: the volume is doubled whenever the trader using this strategy fails to gain profit. In case the market trend is against the trader, he or she increases the volume twofold in anticipation of a breakout or reversal.
Let say EURUSD is currently at 1.09450:
| Order | Open Price | Current price | Profit/Loss |
|---|---|---|---|
| 1 lot Buy | 1.09450 | 1.09400 | -50 USD |
| 2 lots Buy | 1.09400 | 1.09350 | -100 USD |
| 4 lots Buy | 1.09350 | 1.09400 | +200 USD |
Martingale requires a relatively large deposit that can sustain the potential losses. Moreover, this strategy might involve substantial risk and you may experience a stop out before recovering your losses or turning them into profit.
We would like you to be aware that even when applying the most profound and complex system you may encounter situations where it fails to predict the direction of the market and thus provides false trading signals. Always spend enough time developing your trading strategy before applying it to real trading.
04 – How to Trade Forex
Currency pairs and rates
All currencies in forex trading are quoted in pairs, one against another. Their names are given as a three letter abbreviation known as ISO code, where the first two letters represent the country and the third one is the name of the currency.
Depending on how commonly they are traded, currencies can be divided into three categories:
- The most traded ones are usually referred as to majors and include the US dollar, the euro, the Great Britain pound, the Japanese yen, the Canadian dollar, the Swiss franc, the Australian dollar and the New Zealand dollar. Major pairs involve the US dollar and another currency from the list above, for example, EURUSD, USDJPY, USDCHF
- Cross pairs comprise of two major currencies neither of which is the USD dollar, for example EURGBP, EURCHF, EURJPY, GBPCAD, GBPAUD and CHFJPY.
- Exotic pairs consist of a major currency and another less traded one, for instance EURTRY, USDSEK, USDDKK, USDHDK, USDSDG. Exotics tend to be less liquid and to have less tight spreads.
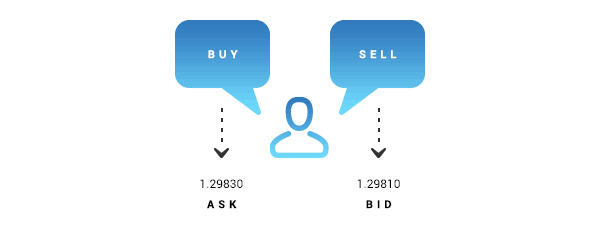
Currency rate always represents the value of the base (first) currency expressed in the quote (second) currency. In Forex there are two prices given - Bid and Ask- the former shows how much of the quote currency is required to sell 1 unit of the base currency and the later represents how much will be required to buy it. Ask price is higher than bid. The difference between two prices is referred as to spread, which is usually measured in pips or points.
Previously, when only 4 digit precision was available, pip, or percentage in point, was the smallest unit to measure price fluctuations. With the introduction of more accurate 5 digit precision pricing the smallest unit of price change is called point, however 1 pip is still calculated by 4th digit.
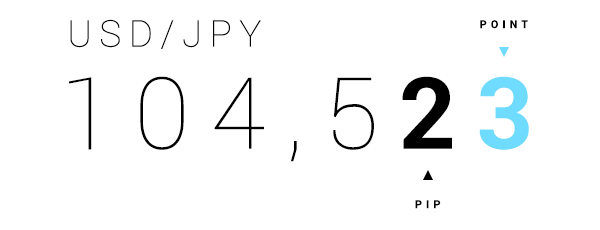
For example, if Bid price is 1.11443 and Ask price equals 1.11449, spread is 0.6 pips or 6 points.
Orders
Direction wise, there are two types of trades:
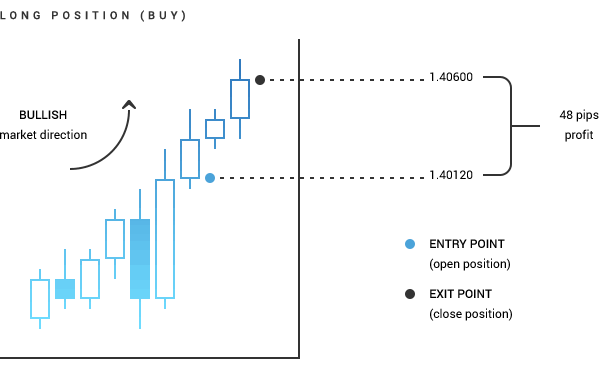
- Buy or long positions are opened at ask price and closed at bid price;
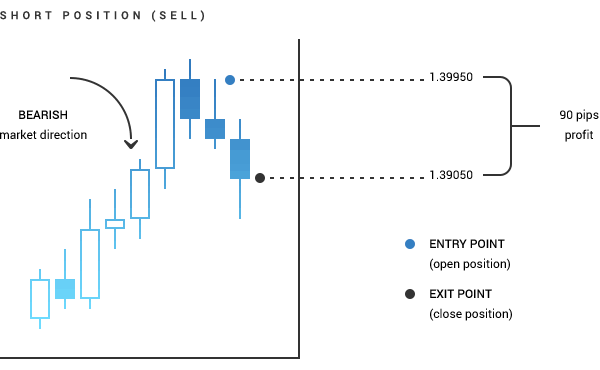
- Sell or short positions are opened at bid and closed at ask.
Each of those can be opened either as a market or as a pending order:
| Direction | Market | Pending | |
|---|---|---|---|
| Stop | Limit | ||
| Long (buy) | Opened at current Ask price | Opened at a predefined Ask price, which is above the current one | Opened when the Ask price reaches the order level; the current ask is below this price |
| Short (sell) | Closed at current bid price | Opened at a predefined bid price, which is higher than the current one. | Opened at a predefined Bid price, which is below the current one |
Closing order is always opposite to the opening one, that is, by closing a long (buy) position you sell the amount back and vise versa - when you close a short (sell) position, you buy the amount you previously sold.
A position can either be closed manually at the current market rate or when a certain price level is reached, through Stop Loss and Take Profit orders.
- Stop loss is intended to limit the losses and is set above the open price for short positions and below the open price for long positions.
- Take profit allows you to close a position when a certain profit is gained. Take profit level is below current Ask price for a short position and above current Bid price for a long position.
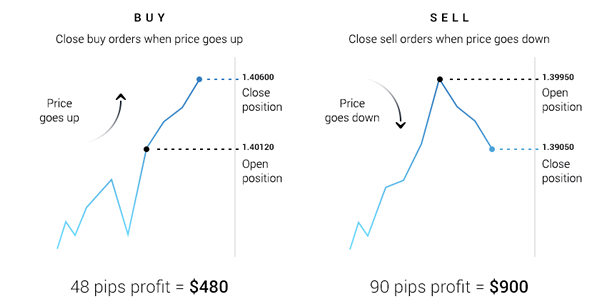
In order to gain profit you need to close long positions when the price goes up and close short position when the price goes down.
Leverage, volume, required margin
To open a position you need to have a certain amount in your balance, which is commonly referred as to required margin or just margin. The amount depends on the trading tool, volume and leverage.
- Trading tool is basically anything you can trade with, including currency pairs, spot metals, oil or indices.
- Volume is the amount you buy or sell measured in lots. 1 standard lot equals 100 000 units of the base currency. Depending on your balance and account type you can also trade mini lots (0.1) and micro lots (0.01). Volume defines the pip price, that is, the higher your volume is, the more significant each price movement will be. For example, pip price for EURUSD 1 lot is 10 USD, for EURUSD 0.5 lot is 5 USD. You can use this tool to calculate pip price for any position.
- Leverage is a virtual credit provided by the company. The higher your leverage is, the lower marginal requirements will be. For example, when you use no leverage (ratio 1:1), you will need 100 000 EUR to open 1 lot of EURUSD; if your account leverage is 1:200, only 500 EUR will be required. The maximum leverage OctaFX offers is 1:500, that is, you will need only 200 EUR to open 1 lot.
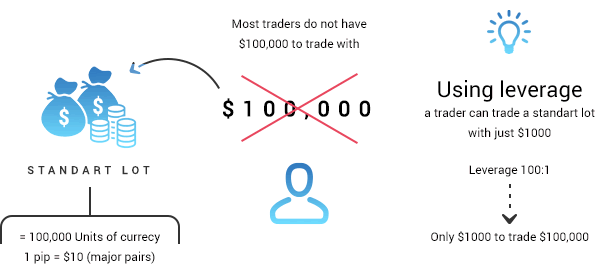
Note that if you have a USD account, the required margin will be calculated as follows:
(Current price × Volume in lots × 100 000 units) / leverage
For example, if your leverage is 1:200 and you open 0.5 lot EURUSD order at 1.12931, required margin is
(1.12931 × 0.5 lots × 100 000 units) / 200 = 282.33 USD
Required margin is always calculated automatically by the platform. To check how much approximately will be required to open a certain position, you can use our Forex Calculator.
Balance, equity, free margin, margin level
When you open a position, note that your balance remains intact. In fact, it only includes deposits, withdrawals and closed trades.
The amount of required margin will be deducted from "Free margin" field, which also comprises of your floating profit or loss and deposit bonus if you claimed one. Free margin is the funds you can open positions with. Note that when you open a hedge order with the same volume, no margin will be required; however, if your free margin is negative, you will not be able to open an opposite position.
Free margin = balance - required margin + floating profit / loss (+bonus)
Another value affected by your profit or loss is equity, which is calculated is follows:
Equity = Balance + floating profit / loss (+bonus)
Equity is important because it, along with the required margin, determines your margin level:
Margin level = Equity / required margin × 100%
If you margin level falls under 15%, your open positions will be mandatory closed starting with the trade that has the highest floating loss.
Balance, equity, free margin and margin level are calculated automatically by the platform and available anytime in the "Trade tab".

How to start trading
Basically, all you need to do to start trading forex is to open an account and download and install trading platform or sign in to the MT4 or cTrader web based terminal.
Demo account allows you to practice risk free, while with a real account you will be able to experience real market with minimum deposit as low as 5 USD.
If you are not familiar with the trading platform, make sure to check our Manuals section for detailed instructions.
More information on how the forex market works, what tools and techniques you can employ to predict the direction of the prices or strategies you can apply is available in the Forex Basics section.
If you have any questions regarding the market, OctaFX website or trading conditions you can check our elaborate and comprehensive FAQ.
Whenever you encounter an unfamiliar term, word or market phenomena, you can check its definition and description in the Forex Glossary.
Our award winning Customer Service is always glad to answer any questions you have and is available 24/5.
03 – Forex Trading Sessions
Currencies are traded 24 hours a day 5 days a week around the world. Trading Market opens Monday morning in Wellington, New Zealand and stay open till the Friday night in New York, USA. Knowing which trading session is active now can help with choosing a pair to trade and which economic events to review before trading.
Each trading day can be divided into three trading sessions, depending on the financial center active during a specific period of time. The time each session opens and closes at is based on the local business hours:
| Session | City | Open (EET*) | Close (EET*) |
|---|---|---|---|
| Asian | Tokyo | 2:00 - 3:00 | 11:00 - 12:00 |
| European | London | 10:00 | 19:00 |
| American | New York | 15:00 - 16:00 | 0:00 - 1:00 |
* Eastern European time: GMT+2 winter; GMT+3 summer
Asian (Tokyo) session
With major trading center in Tokyo, Asian session also includes China, Australia, New Zealand and Russia. The first financial center to open after the weekend is actually Wellington, New Zealand, while Tokyo capital markets itself only opens at 2 AM EET (3 AM EEST). Closing hours overlap with the beginning of the European session.
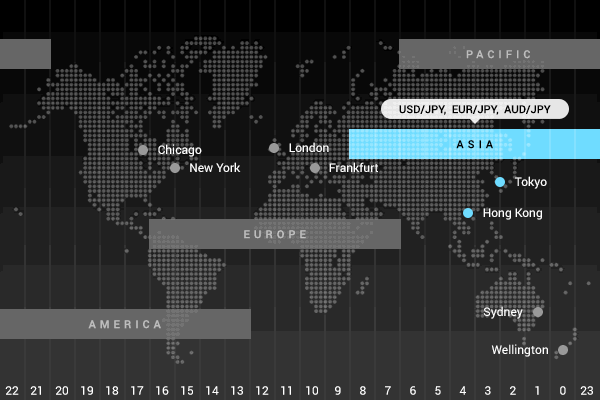
Important economic data from the region that may affect European and American session are released during that time. You can expect significant price movements on USDJPY, EURJPY and AUDJPY.
European (London) session
When financial centers through Asia are about to close, European markets start their day. Since European session coincides with both Asian and American ones, there is normally an increase in volatility and market liquidity, however, spreads tend to be more tight during the London session.
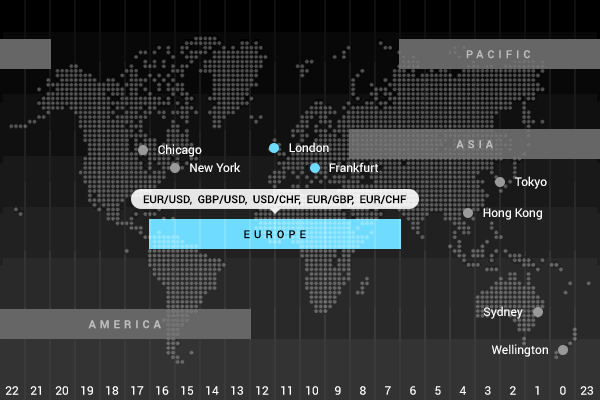
The most significant economic news are released from the Eurozone, the United Kingdom and Switzerland. It is not uncommon for a trend started during the European session to continue until the beginning of New York session. The most liquid pairs are EURUSD, GBPUSD, USDCHF, EURGBP and EURCHF.
American (New York) session
Dominated by the US with the major financial center in New York, American session also includes Canada and South American countries. Naturally, there is high liquidity in the first half of the session, while the european markets are still open.
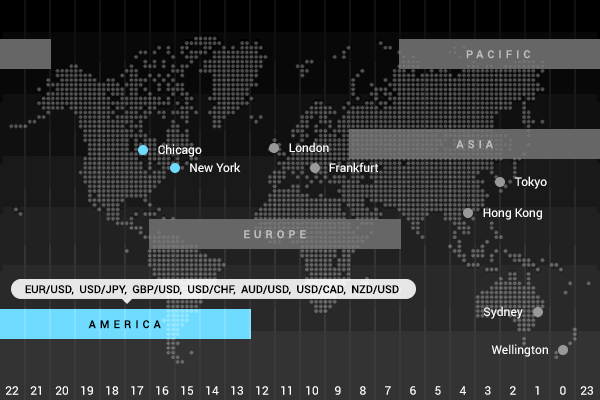
A number of economic indicators that have a profound impact on the market are released by the US and Canada, so make sure to check economic calendar in advance to keep track of the upcoming news. Since the most of Forex transactions involve USD, you can expect all majors and crosses to be volatile, however high liquidity available during this session, allows to trade practically any pair.
02 – An Introduction to Forex Market
Foreign Exchange market, commonly referred to as Forex or simply FX, is the largest financial market where currencies are bought, sold and exchanged one for another. Unlike, for example, stocks market, it has no centralized exchange and transactions are performed over-the-counter, that is, participants trade with one another through a worldwide network of banks, brokers and other financial institutions.
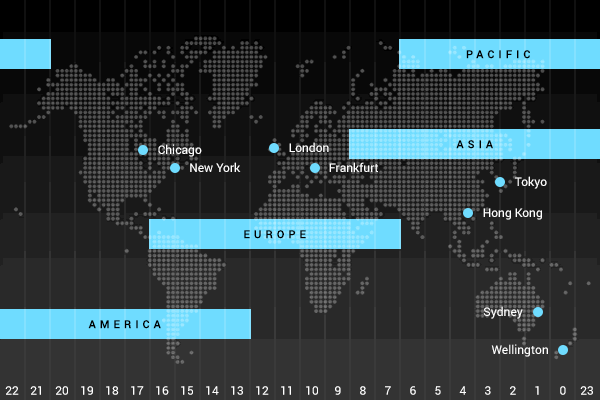
As a global market Forex is open 24 hours a day, 5 days a week. The major financial centers are based across almost every time zone – in London, New York, Tokyo, Zurich, Frankfurt, Hong Kong, Singapore, Paris and Sydney. Depending on the exchange active during a specific time, one can distinguish between three trading sessions: Asian, European and American. To learn more about trading sessions please follow the link.
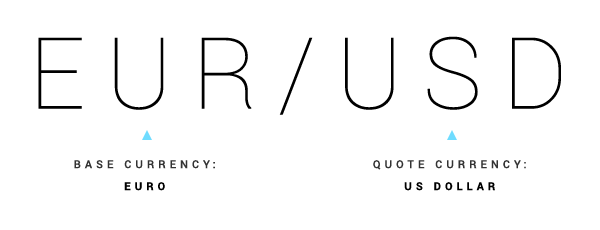
In foreign exchange currencies are quoted against one another in pairs and the price indicates how much of quote (second) currency is required to buy or sell one unit of base (first) currency.
Exchange rates are driven by forces of supply and demand: currency value usually increases whenever demand for it is greater than supply and decreases if demand is less than supply. Moreover, prices fluctuate in response to economic, social and political events that occur throughout 24-hour trading day.
Political situation and economic performance of the countries involved have a profound effect on the currency prices as well. For instance, a country with lower inflation rate will typically see increase of its currency value in relation to the currencies of its trading partners. Inflation is also highly correlated with central bank's interest rate: lower interest rate can depreciate exchange rate and vise versa.
Another detrimental factor in price setting is orders from Forex market participants, that are quite diverse in volume they generate and influence they have.
Governments and central banks such as the European Central Bank, the Bank of England, and the Federal Reserve of the US operate with the largest volumes and have the most influence on exchange rates. Central banks try to control inflation, money supply, interest rates and are in charge of supervising commercial banking systems. They can use foreign exchange reserves to intervene in the market to stabilize currency rates or achieve a specific economic goal.
The second largest group comprises major banks and bank associations that form so called interbank market, through which they transact with each other and determine the currency price individual traders observe in the trading platform. Since forex is a decentralized market, you can often see that different banks offer slightly different exchange rates for the same currency. OctaFX clients receive the best bid/ask prices quoted from our vast liquidity pool.
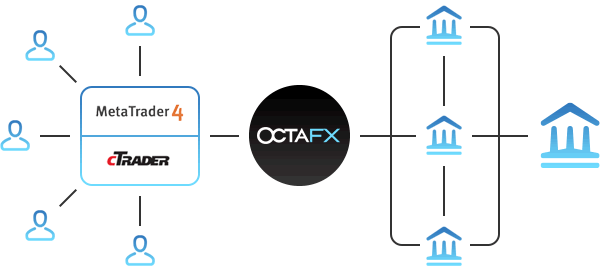
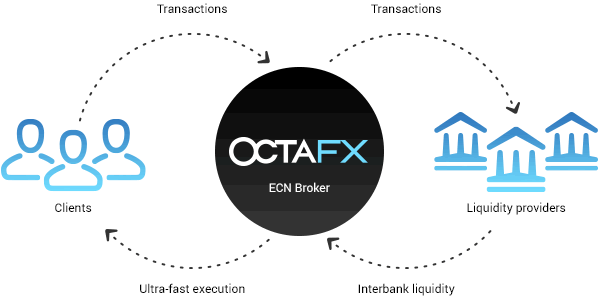
Another group of forex participants is brokerage firms that act as intermediaries between individual traders and the market. They use electronic communication networks (ECNs) to offset clients' orders with itsliquidity providers, which may comprise of various financial institutions. This execution model eliminates a conflict of interests between the brokerage and its client when an order is executed. An ECN brokerage, unlike a market maker, is compensated through commission that can either be charged per each order or included in the spread as a mark up. You can learn more about ECN execution here.
An ECN brokerage allows individual traders to access the forex market, which initially was the domain of large financial institutions only, and gain profit from price fluctuations. Even though daily price fluctuations are seemingly small, often less than 1%, use of leverage can increase the value of these movements.
Traders interact with a broker through a trading platform - a piece of software that allows to buy and sell currencies. It can be installed on your desktop computer, mobile device or even accessed via web browser.
When choosing a forex broker, it is important to take into account various factors, including:
Reliability
It's highly important to consult various ratings and review before investing. OctaFX acts in accordance with major international laws and regulations to provide most secure and reliable service to our clients.
Execution
OctaFX execution model eliminates any conflict of interest between the client and the broker: we act as an intermediary between you and the real market by offsetting orders one by one with competing prices from our vast liquidity pool. You can be sure our execution speed is under 0.1 second and OctaFX clients do not experience any re-quotes.
Spreads
In general, spread can either be fixed or floating: the former remains the same even though the price is changing, while the latter varies depending on the market situation and is normally more tight than the fixed one. Spread should be taken into account as the lower it is, the less you pay for each trade. Our tight floating spread, along with no trading commission, ensures low cost of trading and accurately reflects what is available in the market.
Trading tools
Every trader looks for versatility: wider range of trading tools allows to select pair you are comfortable trading, leaving a space for experimental trading as well. With our great selection of trading tools you can trade the market you are interested in.
Minimum deposit
More important for newbie traders, accessibility of trading is also determined by the amount of minimum deposit. At OctaFX you can start with as much as $5/€5 as your initial investment. It will help you try various techniques and applying different trading strategies and will help you to be prepared for serious trading. Good news is that maximum deposit is unlimited!
Funds security
Making sure your funds are safe is of primary importance while making investments. OctaFX uses 3d secure technology for Visa/Mastercard deposits, and SSL encryption to protect client's Personal Area. All measures taken make financial information secure and inaccessible to any third parties.
Negative balance protection
Negative balance protection feature protects traders from unexpected market circumstances: if the trader's balance becomes negative, OctaFX compensates it back to zero. Thus, your losses cannot exceed your deposits. Negative balance protection feature comes handy in a constantly changing economic environment: OctaFX reversed our clients' negative trading balances back to zero after Swiss franc event in 2015, while some of the brokers went bust.
Account types
Choosing an account type suitable for your level of trading experience is vital to ensure you are using your trading potential right. Our range of trading accounts allows traders with different experience and needs to operate their funds accordingly: micro accounts allow new traders to practice with minimum deposit of $5, while live ECN account offers a wider range of trading tools for more experienced traders.
Leverage
As daily price fluctuations are seemingly small (often less than 1% of a cent), it is important to choose a broker which offers a substantial leverage. The higher your ratio is, the less funds you will need to hold a position. OctaFX offers flexible leverage system with the highest leverage ratio of 1:500.
Platforms
Selecting a trading environment you need to consider general platform's usability, compatibility with your device and the amount of trading instruments available for technical analysis. OctaFX provides you with Metatrader 4 and cTrader platforms, both available in desktop, mobile and web-platform versions.
Customer Service
If any questions regarding trading occur, Customer Support will provide a trader with relevant information on how to solve any problem he may have. Our award-winning Customer Support is available 24/5 and it takes around 5 minutes on average to untangle even the most complicated issue a client may have.
Thanks to large daily trading volume, deep liquidity, availability 24/5 and low costs, Forex definitely stands out when compared to other markets. It allows a trader more flexibility when choosing how and what to trade, along with considerable leverage, tight spreads and small investment. You can learn more about Forex market advantages here.
01 – How to Start Trading in 4 Easy Steps
1. Register with OctaFX by opening an account
Having an account allows you to access your personal area on our website and to trade with OctaFX. Once registered, please check your email to find out your personal area login details and trading account credentials.
Personal area login details will allow you to manage your funds, get bonuses and take part in our promotions, while trading account credentials are used to access trading platform.
2. Make a deposit
Login to your Personal area to make a deposit. At OctaFX you can start trading with a minimum of $5 although the initial deposit can be higher. According to Risk Management strategy, the more funds you have, the less risks you are exposing yourself to on a particular trade.
We don't charge any commissions on your deposit and our withdrawal systems work efficiently to help you withdraw your profits.
3. Sign in to the web based platform
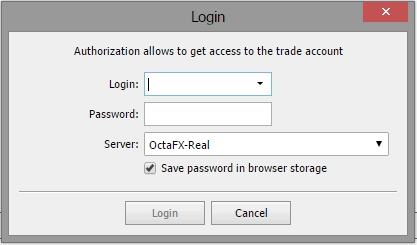
The web based platform requires no installation and allows you trade from any device anytime. To sign in, click File->Login, enter your account number into "Login" box, along with your trader password that was sent to your email address into the "Password" box and select OctaFX-Real, if you sign in with a real account. Alternatively, you can trade from your desktop, iOS or Android device. You can compare platforms here.
4. Click "Buy" or "Sell"
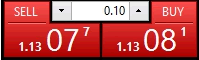
One click trading To open an order, you can simply select the volume of your position and click the Buy or Sell button. There are many other ways to open a trade as described here.
How do I trade?
Basically, you open a buy order if you expect the price to go up and open a sell order when you expect the price to go down.That means that you buy a certain amount at a lower price now, in order to sell it back at a higher price later and gain profit from the price difference and vice versa.
Understanding leverage
Leverage reduces marginal requirements (that is, the amount necessary to maintain a certain position) and helps you to open orders with larger volume than you balance would allow otherwise. However, it is important to note that it works both ways: the higher the volume of your order is, the more you gain or lose for each pip the price goes up or down. Please consider the example below:
If you have a trading account with $500 and 1:500 leverage, your open position for 1 lot (100,000) on EUR/USD, when the value is 1.13415. The required margin for this position is $226.83, almost half of your account value. Each pip movement is worth $10 to your trade account. Therefore, the value only needs to fall to 1.13145 for you to lose nearly all of the money in your trade account. With volume of 0.5 lots, however, each pip costs you $5 only, which means that in case the price falls to 1.13145 your loss would be $135.
This should be taken into account when making a trading decision and evaluating the potential risk of an adverse price fluctuation.
How do I predict whether the price is going to rise or fall?
As a beginner you can simply track the general direction of the price on the chart and open buy orders when it goes up and sell orders when it goes down. This may not guarantee you profit in all cases, however it is a good start for developing your strategy.Predicting trends - Uptrend - Downtrend - Sidetrend
If you have little to no experience yet, it would be advisable to avoid trading during major news releases since the market tends to be highly volatile. Two more advanced methods of price prediction are technical analysis and fundamental analysis. Basic risk management techniques may also prove beneficial in reducing losses.
How do I make a profit?
There are many strategies that allow you to profit from currency price fluctuations, for example scalping, martingale, hedging, news trading and many others. You can find a detailed description of most common strategies here.
Alternatively, you can use automated trading software that can help you in making trading decisions or even open and close positions for you.
How do I close an order?
Your order profits fluctuate depending on the current market price until you close it. If you feel like you've gained substantial profit, open "Trade" tab in your MT4, find the open position, right click it and select "Close order" from the context menu.
What should I know before I start?
There are certain concepts and terms that are essential to get familiar with. We've covered them in the "How to trade Forex" article. Please also feel free to explore our Education section, in order to expand your knowledge about the market in general and OctaFX services in particular. If you would like to practice risk free, you can open a demo account, which has virtual funds only.
EUR/USD Weekly Outlook
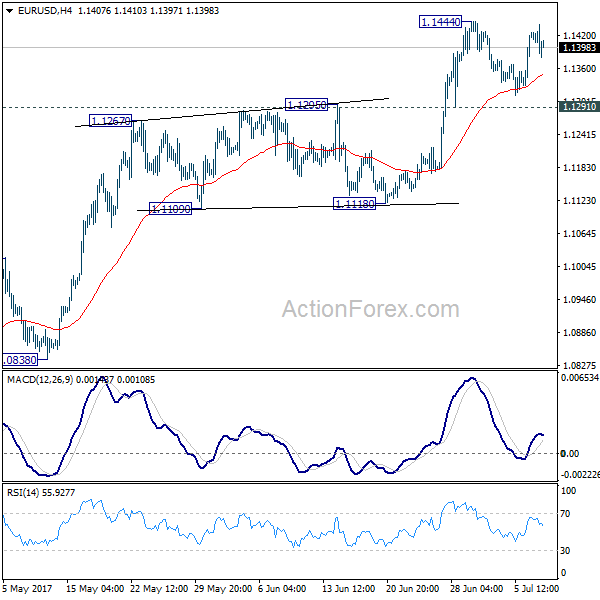
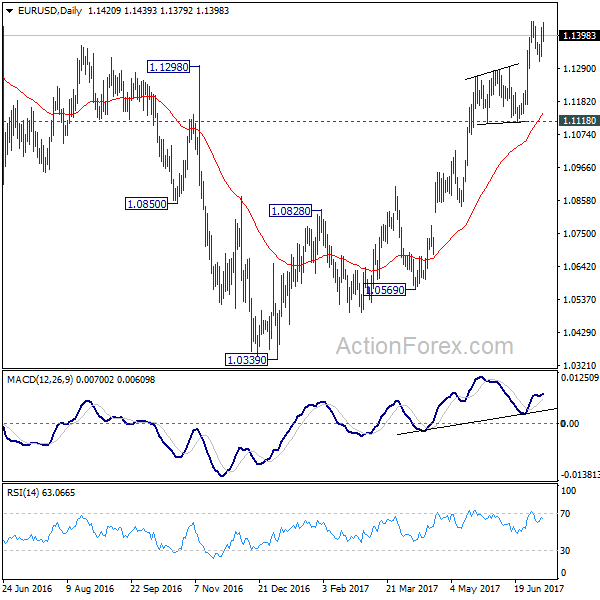
EUR/USD stayed in consolation below 1.1444 last week and outlook is unchanged. Initial bias remains neutral this week first. In case of another fall, downside should be contained by 1.1291 resistance turned support to bring rise resumption. Break of 1.1444 will extend the rally from 1.0339 low to 1.1615 resistance next. Meanwhile, break of 1.1291 will turn focus back to 1.1118 support instead.
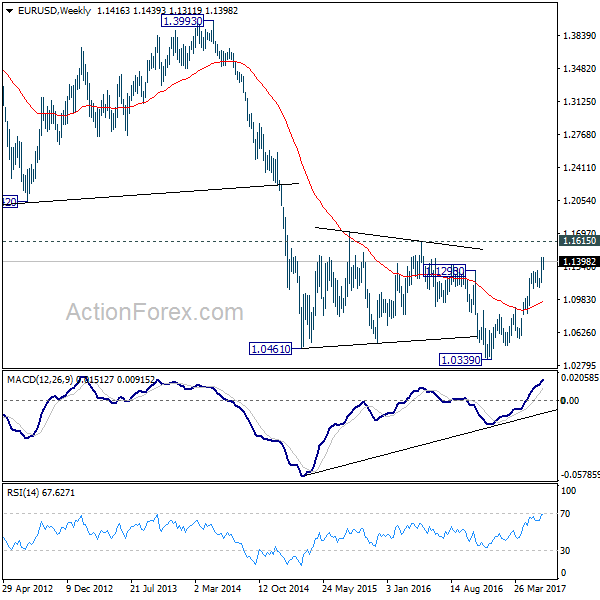
In the bigger picture, the firm break of 1.1298 resistance further affirm medium term reversal. That is an important bottom was formed at 1.0339 on bullish convergence condition in weekly MACD. Further rise would be seen to 55 month EMA (now at 1.1763). Sustained break there will pave the way to 38.2% retracement of 1.6039 (2008 high) to 1.0339 (2017 low) at 1.2516 next. This will now remain the favored case as long as 1.1118 support holds.
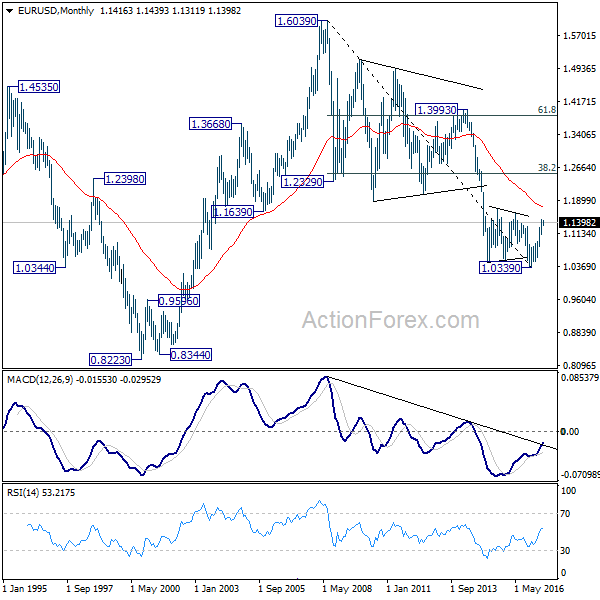
In the long term picture, 1.0339 is now seen as an important bottom as the down trend from 1.6039 (2008 high) could have completed. It's still early to decide whether price action form 1.0339 is developing into a corrective or impulsive move. But in either case, further rally would be seen to 38.2% retracement of 1.6039 to 1.0339 at 1.2516
USD/JPY Weekly Outlook
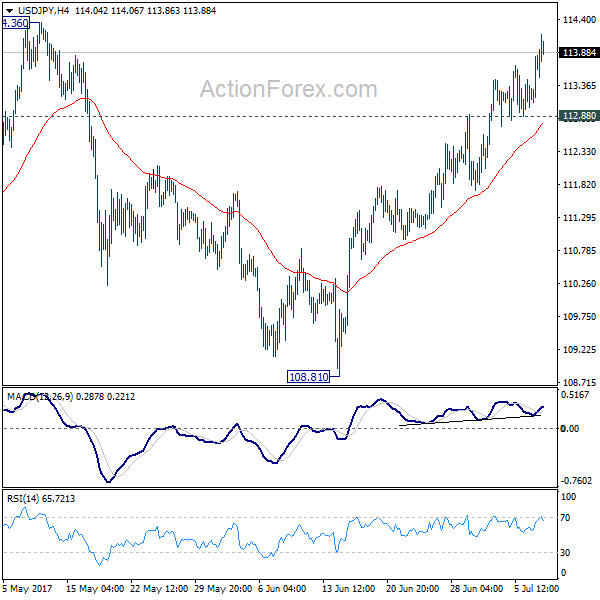
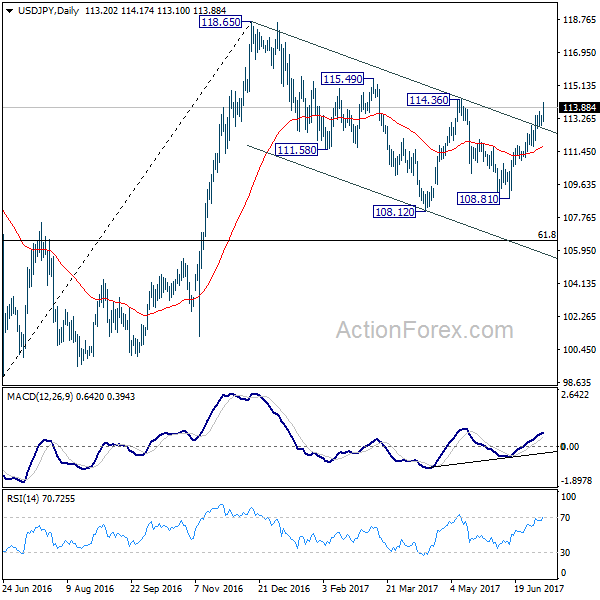
USD/JPY's rally continued last week and there is no sign of topping yet. Initial bias stays on the upside for 114.36 resistance. Decisive break there will confirm our bullish view that corrective pull back from 118.65 has completed at 108.12. In that case, further rally would be seen to retest 118.65. On the downside, break of 112.88 support is needed to indicate short term topping. Otherwise, outlook will remain bullish in case of retreat.
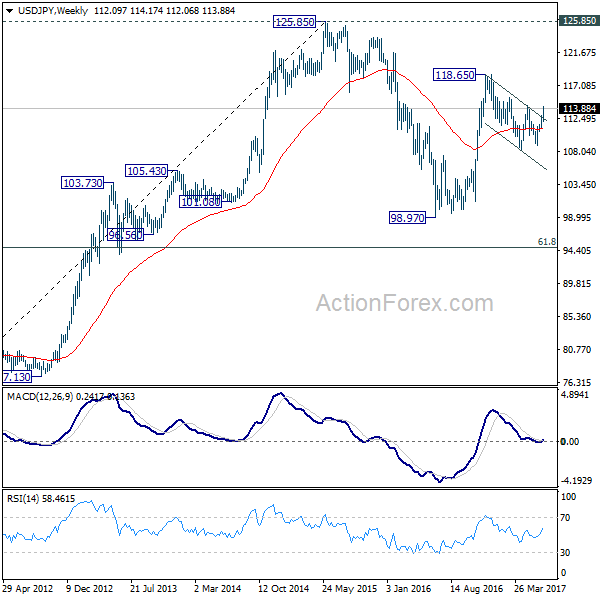
In the bigger picture, the corrective structure of the fall from 118.65 suggests that rise from 98.97 is not completed yet. Break of 118.65 will target a test on 125.85 high. At this point, it's uncertain whether rise from 98.97 is resuming the long term up trend from 75.56, or it's a leg in the consolidation from 125.85. Hence, we'll be cautious on topping as it approaches 125.85.
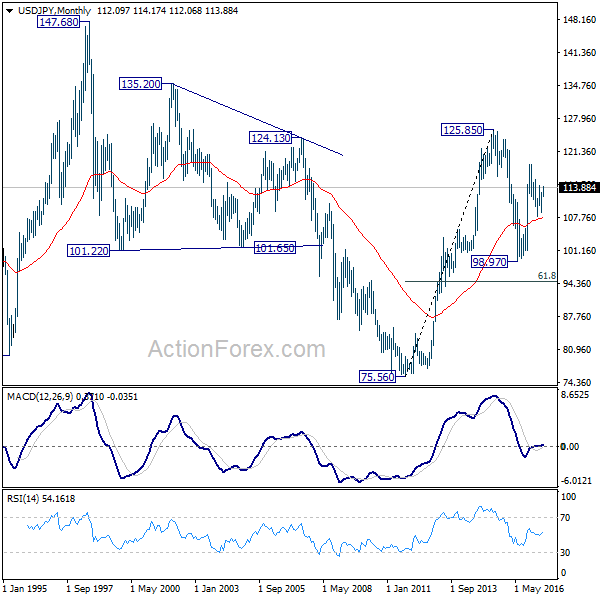
In the long term picture, the rise from 75.56 long term bottom to 125.85 top is viewed as an impulsive move. Price actions from 125.85 are seen as a corrective move which could still extend. But, up trend from 75.56 is expected to resume at a later stage for above 135.20/147.68 resistance zone.
GBP/USD Weekly Outlook
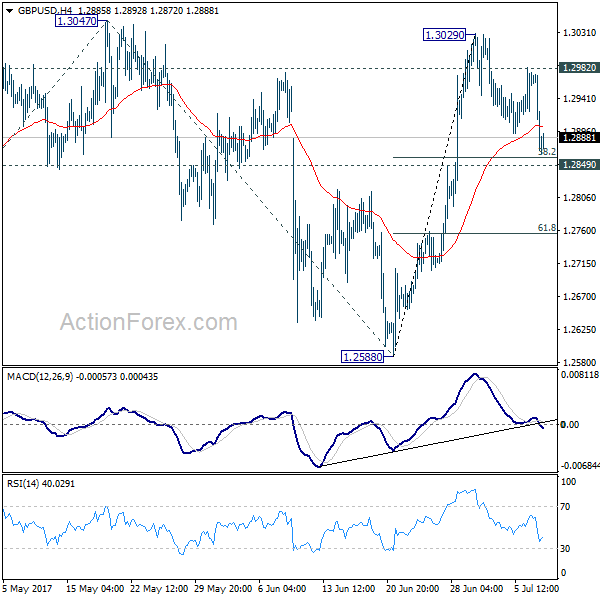
GBP/USD's stayed in consolidation below 1.3029 last week and outlook is unchanged. Initial bias remains neutral this week first. We'd continue to expect strong support from 1.2849 to contain downside and bring rise resumption. Above 1.2982 minor resistance should turn bias back to the upside for 1.3047 resistance. Break will target 61.8% projection of 1.2108 to 1.3047 from 1.2588 at 1.3168 next. However, sustained break of 1.2849 will dampen our near term bullish view and turn focus back to 1.2588 support.
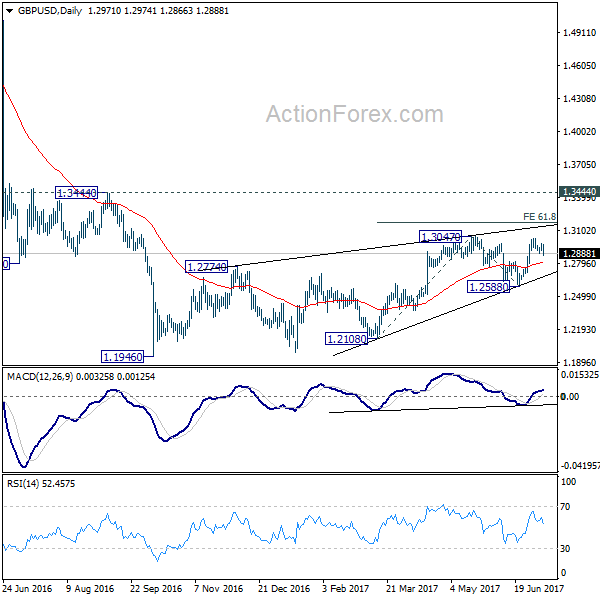
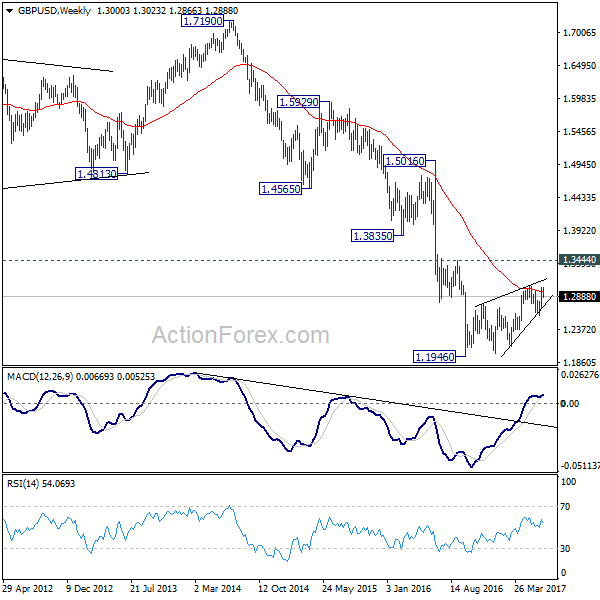
In the bigger picture, overall, price actions from 1.1946 medium term low are seen as a corrective pattern that is still in progress. While further upside is now in favor, overall outlook remains bearish as long as 1.3444 key resistance holds. Larger down trend from 1.7190 is expected to resume later after the correction completes. And break of 1.2588 will indicate that such down trend is resuming.
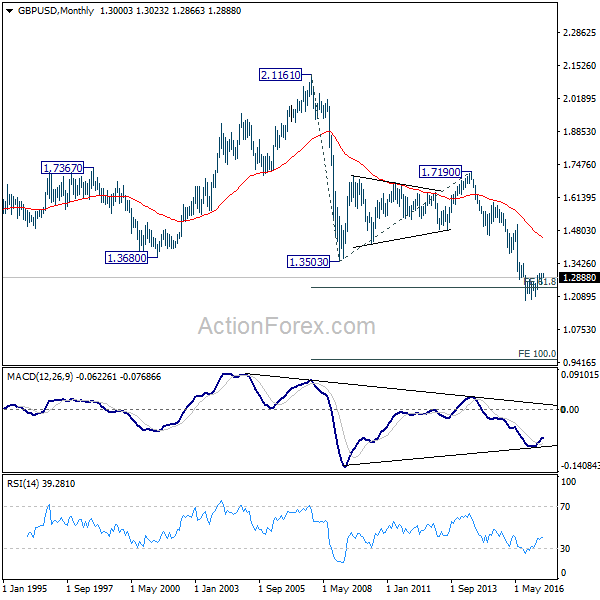
In the longer term picture, no change in the view that down trend from 2.1161 is still in progress. On resumption, such decline would extend deeper to 100% projection of 2.1161 to 1.3503 from 1.7190 at 0.9532. However, firm break of 1.3444 should confirm reversal and turn outlook bullish.
USD/CHF Weekly Outlook
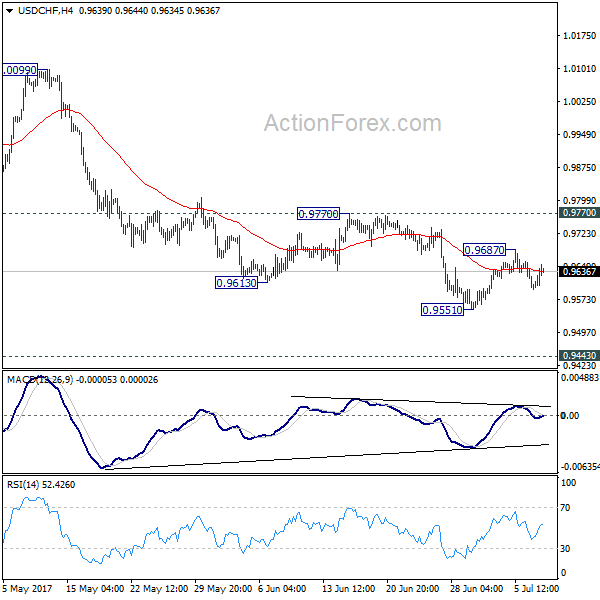
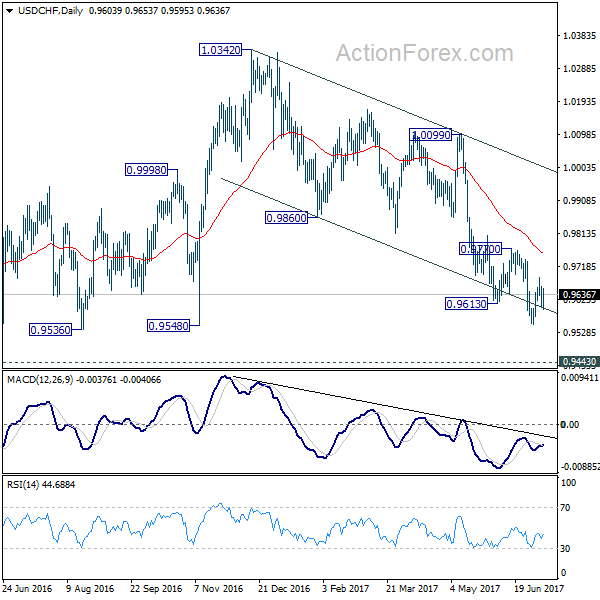
USD/CHF stayed in consolidation above 0.9551 last week and outlook is unchanged. Initial bias stays neutral this week first. In case of another rise, upside should be limited by 0.9770 resistance and bring fall resumption. Break of 0.9551 will extend the whole fall from 1.0342 and target 0.9443 key support level next. At this point, we'd expect strong support from there to bring rebound. Meanwhile, firm break of 0.9770 will indicate near term reversal, on bullish convergence condition in 4 hour MACD.
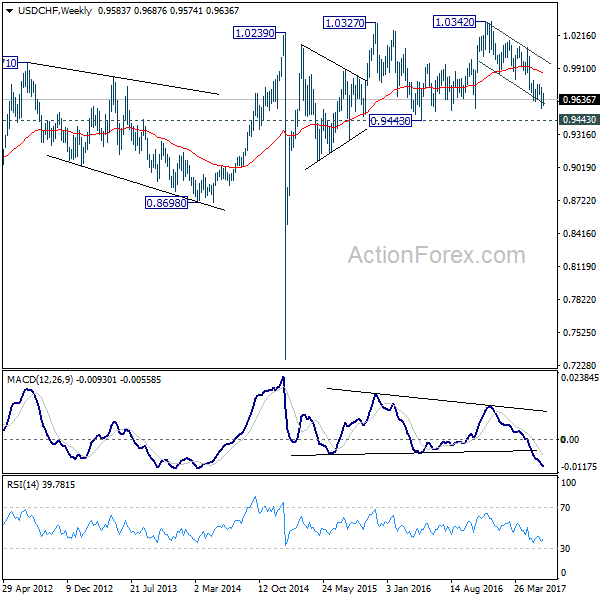
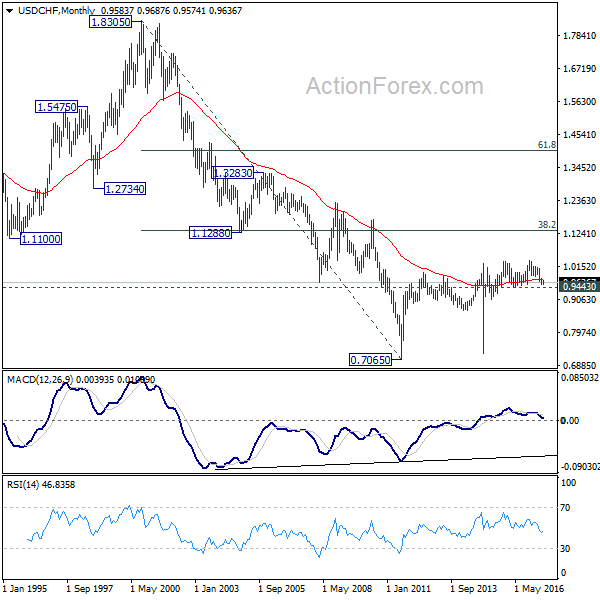
In the bigger picture, USD/CHF is still bounded in medium term range of 0.9443/1.0342 for the moment. Consolidative trading would likely continue and medium term outlook remains neutral. Break of 1.0342 key resistance is needed to confirm underlying bullish momentum in the pair. Meanwhile, downside attempts should be contained by 0.9443 key support level. However, sustained break of 0.9443 will carry larger bearish implication and target 0.9 handle.