

Sample Category Title
05 – The Sun Never Sets on Forex Traders
Monday Morning
A typical week in the currency markets kicks off on Monday morning in Wellington, New Zealand. This is the first financial centre in the world to see the dawn of a new trading day. When Wellington opens for business it is very early Monday morning in Asia, while still being Sunday evening in Europe, and Sunday afternoon in North America. The exact opening times of each market will vary depending on whether your country observes daylight savings or not. Wellington is where the currency markets resume trading after the North American close on Friday evening. Unlike other markets they will remain open for business all the way through to 5 p.m. Eastern time on the following Friday.
Open your trading platform; choose a currency pair and using either a bar or candlestick chart try to find the most recent Monday opening with a distinct break in price action. If you have trouble finding one try viewing the data at a shorter duration. In many cases you will see a gap in the chart between where the market closed on Friday evening in New York and where it opened in Wellington on Monday morning. You will be able to find a particularly pronounced break on all USD pairs between the 13th and 15th of September 2013. Over this weekend Larry Summers withdrew from running as the next chairman of the Federal Reserve. This news caused the dollar to trade much lower when the markets re-opened on Monday.
The Wellington opening is important because it is the first point in the week where the market has an opportunity to digest the events that took place over the weekend. As a result, it's not uncommon to see a gap up or down between the close of the North American session on Friday evening and the New Zealand opening on Monday morning. This is something to keep in mind when you are holding positions over the weekend. Even though trading ceases on Friday currency traders don't take days off, so always stay abreast of the news that may affect the currencies you are trading because you could be in for a shock come Monday morning.
Three Trading Sessions
Forex trading is divided into three main sessions that overlap throughout the day as different markets open and close. These sessions are the Asian/Tokyo session, the European/London session, and finally the North American/New York session. Even though Tokyo, London and New York are the big three financial players, there are many other countries contributing, both in terms of liquidity and also by extending opening hours beyond those of the cities which have become synonymous with each session. For instance, as already mentioned New-Zealand is open hours before Tokyo gears up for trading, but the Asian session also includes other important global players such as Australia, Singapore and China.
Asia
During the Asian session important economic data from the region is released, so traders are watching closely for developments that will have knock-on effects on the European and North American regions throughout the rest of the trading day. As the third most traded currency in the world the yen is by far the biggest player during the Asian session. According to the preliminary findings of the BIS Triennial Central Bank Survey, the yen accounted for around 23% of daily turnover in April of 2013. During this session you can expect a great deal of activity on USD/JPY, EUR/JPY and AUD/JPY.
Europe
At the end of the Asian trading day European markets start coming online. The European session is important to traders because it coincides with the close of the Asian trading day and the first half of the North American trading day. Positioned as it is between these two other major financial centres, and with the euro being the second most traded currency globally (33.4% of daily turnover by the last BIS count), the European session benefits from being in the very thick of it as far as trading activity is concerned. Liquidity and market activity are at their highest during the European session and even though London is the biggest player here, other large European financial centres, such as Germany and France, are also very important and begin trading in advance of London's opening. Economic data from the Eurozone, as well as from the United Kingdom and Switzerland cause the biggest movements in price action to come from EUR/USD, GBP/USD and USD/CHF, as well from the EUR/GBP and EUR/CHF cross pairs.
North America
The North American session coincides with afternoon in the European session. The fact that the markets using the first and second most traded currencies are live at the same time (USD was on one side of 87% of all trades in April of 2013) and that most key economic indicators from the United States are released in the morning, causes this period to be by far the most active in terms of trade volumes and price movements. At midday the European markets start winding down; this can result in some final flurries of activity which have been known cause surprises. In the afternoon trading activity can be a little subdued as the American continent finds itself trading on its own, however volatility can be generated by several economic indicators that are routinely released in the afternoon as well as public addresses by FOMC members. Obviously New York is the main player here but activity from the Canadian and South American market shouldn't be overlooked. In fact the Mexican Peso was one of 2013's big surprises in the triennial BIS survey. It saw a large increase in market share compared to the other emerging market currencies to become one of the top ten most actively traded currencies, with a global market share of 2.5%.
Trading wraps up at 5 p.m. Eastern time in New York and the markets will remain dormant until Wellington re-opens for business bright and early on Monday morning.
04 – The Art of the Chart
Learning how to use price charts is an indispensable part of Forex trading. There are a few wizened old Forex masters out there who claim not to use charts at all when taking positions, their trading activities are so deeply entrenched in the fundamental trends that charting plays little or no role for them. However, for most Forex traders the use of charts is essential, so it's of the utmost importance that you get to grips with how they work and how to use them early on.
Price charts are graphs that track the changing values of assets in real time. You will ordinarily find a list of the available assets on the left, and a chart of the one you are currently viewing centre screen. FxPro offers trading facilities on two main platforms; MT4 and cTrader. Both have very similar charting functions and indeed most platforms will offer you the same set of basic options. Charting is an huge subject in its own right, but for now you will be introduced to a few basic concepts that will give you an understanding of why charts are important and how they work. We will delve into the subject in more detail when we look at technical analysis later on in the course.
Chart Durations
When monitoring an asset's price you can specify the duration at which changes in price are being registered on the chart. These durations can be anywhere between a single minute all the way up to a month. So if, for instance, you are charting at the monthly duration, every change in the chart will represent a month's worth of data. This will naturally obscure all of the price moves which occur within the month. Similarly, charting at the hourly duration won't provide you with any of the changes in price that take place at any period of time shorter than one hour. This is why the shape of the chart changes so radically at different time frames; you are effectively viewing the same data at different resolutions. Regardless of the time frame you select, all of the trading data is being recorded down to the minute, so you can go back at any point and see exactly what took place at the shorter durations.
Open your trading platform and chart a currency pair at the monthly duration. Change this to weekly, then daily, and gradually move all the way down to the 1 minute duration. Notice how much the shape changes? This is what happens when you narrow in to reveal more and more information about what is happening at the shorter time frames.
The time frame you choose will be largely dependent on your trading style. If you are opening and closing multiple positions within a single day then obviously a daily chart will not provide you with sufficient data to make educated choices. Similarly if you are taking long term positions which you intend hold for weeks, charting at the one minute time frame won't provide you with any useful information regarding the deeper trends that are at work. Picking a suitable time frame, and indeed learning to switch between them to gain a wider, or more localised perspective, will become more important as you begin to develop your own trading system.
Chart Types
There are three main chart types that you can choose between when monitoring the price action of an asset. These are: line charts, bar charts and candlestick charts. Generally there are up to four key pieces of information provided by a price chart.
- The opening price of the asset.
- The closing price of the asset.
- The highest price registered in each period.
- The lowest price registered in each period.
Let's discuss and compare the information that the three chart types listed above are able to provide at a glance.
Line charts: Line charts use a simple line to represent the upward and downward movement of an asset's price. Line charts are the simplest of the three to understand, but are only equipped to provide you with an asset's closing price. Their jagged lines are created by plotting a single point at the closing price of each period, and then drawing a line between it and the next period's closing price. You will see the end of this line waver as the price changes, only to be plotted as a fixed point when the period has closed. When this happens the line is extended from the last fixed point and will begin to fluctuate until the next close.
Bar charts: The bar charts used on most charting platforms are also known as Western line charts or OLHC charts (short for Open, Low, High, Close). These charts are basically a Western re-working of the Japanese candlestick charts, which we will look at next. Just like candlestick charts they provide you with all four pieces of data listed above. Bar charts are composed of a vertical line and two smaller horizontal lines, one connecting to the vertical line from the left and one from the right side. Each vertical line provides you with the price range the asset moved through in the period of time you are charting at. The bottom of the line represents the lowest point that the price fell to, and the top of the line represents the highest point the price reached. Also, the horizontal line on the left informs you of the asset's opening price for that period and the horizontal line on the right informs you of the asset's closing price for the period.
Candlestick charts: Candlestick charts originated in 17th century Japan where they were employed by traders to track changing rice prices. Candlestick charts are the most popular chart type among traders for the simple reason that they are very information dense, efficiently providing you with a great deal of information in a very intuitive and eye-catching way. Each candlestick represents a unit of time at the period being charted. They are composed of a main part, called the 'real body', as well as upper and lower 'shadows', also known as 'wicks'. Each candlestick represents the price action that took place within one unit of time frame you are charting at. So at the minute duration each candlestick represents a minute of trading activity, at the monthly duration each candlestick represents a month of trading activity, and so on. Unlike the other chart types we have looked at candlesticks are coloured differently depending on whether they represent a rising or a falling price. If the opening price is higher than the closing price then the body of the candlestick is filled in, in this way traders can easily discern trends as they emerge. The shadows, or wicks, are lines that extend upwards and downwards from the top and bottom of the real body, these represent the highest and lowest prices that were reached within the given time frame.
03 – Forex Basics
Easy to grasp, difficult to master.
Forex and FX are interchangeable abbreviations for Foreign Exchange, which is a term used to refer to the global currency markets. As complex as these markets are, currencies are probably the easiest of all the asset classes for beginners to get to grips with. Even people who have never traded before will have a basic understanding of what currency trading involves. After all, everyone is familiar with using their national currency, and many have had the experience of converting this currency into another one of a different value when travelling. This, in a nutshell, is what currency trading is all about. Currencies differ in value and these differences are constantly changing; buying an undervalued currency as it begins to rise yields profits, selling an over-valued currency as it begins to fall also yields profits. Conversely, selling in the former example and buying in the latter will cause you to incur losses. Simple enough, right? Yes, but learning to discern the influences that cause these fluctuations, and being able to act upon them in a timely and consistently profitable way, that's the real challenge of trading Forex.
Exchange rates explained
Exchange rates are the relative values between currencies that belong to different countries or economic regions. When you are presented with an exchange rate, say for EUR/USD, you are being quoted the value of one currency in relation to the other (in this case the euro against the US dollar). This is why you see two currencies in an exchange rate quote but only one figure; the value of one is determined by how much of it you can buy with the other. It makes no sense to think in terms of absolute values when it comes to currencies as their values are interdependent. This is one of the main differences between trading Forex and trading equities or commodities.
The first currency in every pair is called the base currency, this is the one that you are being given the value of. It is also the one on which you are performing the action of either buying or selling when trading Forex. The second currency in the pair is the quote or counter currency, the figure quoted in an exchange rate is denominated in this currency. Essentially when you see an exchange rate you are being informed what the base currency is worth in terms of the quote currency. So when looking at an exchange rate for EUR/USD you are being quoted what the euro is worth in US dollars, or more accurately how many US dollars are required to purchase 1 euro.
So a EUR/USD exchange rate of 1.33 means that 1 euro is worth 1 dollar and 33 cents, or that $1.33 is required to purchase 1 euro. Currencies are always quoted in this way, were it not for this convention 1 euro would just be worth 1 euro, and that would tell us nothing about anything.
When EUR/USD rises, this means that the euro is growing higher and/or the dollar is getting weaker. As a Forex trader you can position yourself in different ways, taking advantage of any eventuality. You can buy, or go long on EUR/USD when you think the euro is likely to rise, or when the US dollar is likely to fall. You can also sell, or short EUR/USD when you foresee that the euro is due to drop in value, or when you think the US dollar is about to rise.
A closer look at currency pairs
All currencies are given a three letter abbreviation known as that currency's ISO code, in most cases the first two letters refer to the country, and the third letter refers to the name of the currency in question.
The most commonly traded currencies are known as the majors. These are: The US dollar (USD), the euro (EUR), the Japanese yen (JPY), the Great British pound (GBP), the Swiss franc (CHF), the Canadian dollar (CAD), the Australian dollar (AUD) and the New Zealand dollar (NZD).
The major pairs all involve USD being paired with each of the other major currencies listed above.
| Major Currency Pairs |
|---|
| EUR/USD (Euro-zone/ United States) |
| USD/JPY (United States/ Japan) |
| GBP/USD (United Kingdom/ United States) |
| USD/CHF (United States/ Switzerland) |
| USD/CAD (United States/ Canada) |
| AUD/USD (Australia/ United States) |
| NZD/USD: (New Zealand/ United States) |
Pairs that do not feature the US dollar as either base or quote are known as the cross pairs, or crosses. The main crosses consist of any of the major currencies listed above (except, of course, USD) crossed with each other (the most common cross pairs are those which feature the euro, pound sterling, or yen).
One thing to keep in mind is that the euro is always the base currency in any pair. It's easy enough to reverse an exchange rate though, if you need to. So, for instance, if you want to find out the value of USD/EUR (how many euros it takes to purchase one US dollar) all you have to do is divide 1 by the EUR/USD exchange rate (1/1.33 = 0.75). In this example one US dollar can be purchased with 75 euro cents.
In addition to the majors and the crosses there are also the exotic pairs. Exotics consist of a major crossed with a lesser traded currency such as one belonging to an emerging market. Exotic pairs are less liquid and can cost more to trade due to them having wider spreads.
Buying and selling
Most beginners will quickly gain an understanding of how exchange rates work, but then they log into their broker's trading platform for the first time and are greeted by two prices, as well as the option to buy or sell, and their heads start to spin. It may be a little confusing at first but it's really not as complicated as it seems.
In Forex trading you have the option to buy or sell the base currency in the pair. How exactly do you sell something that you don't actually own in the first place? Well you borrow it from your broker. So if you want to sell, or short, 1 lot (or 100,000) of EUR/USD, then you essentially have to borrow it from your broker before being able to sell it (it's not quite a loan but we'll look at this 'borrowing' in further detail when we focus on how CFDs work). Doing this means that you are expecting EUR/USD to drop in value so that you can then buy it back cheaper at a later time, returning those 100,000 units to your broker, and keeping the profit you made for yourself.
As confusing as this may initially sound, don't be daunted by the option to sell and the two different prices you are quoted. All currency trades involve both buying and selling; closing a position you have opened requires you to perform the exact opposite action you took when you opened the trade. So if you clicked 'Buy' and bought 1 lot of a currency, then later you when click 'Close Order' you are effectively selling back those 100,000 euros you bought at the new price, keeping the profit or taking the hit depending on what the pair is valued at when you sell. Naturally, it follows that closing a short position, as we saw in the example of selling EUR/USD above, involves buying back the same amount of the currency that you initially sold to open the position. When this balance is restored and you no-longer have any open positions you are said to be square, or flat. If you went long, then squaring-up requires you to sell the same amount of the currency you initially bought. If you shorted, then squaring-up involves you buying back the same amount of the currency you initially sold.
Also keep in mind that since every currency you buy is a pair of currencies, every position you take involves buying one and selling the other. This is not something you have to think about when you decide to click Buy or Sell, but to go long on a pair involves simultaneously buying the base and selling quote, conversely shorting involves selling the base and buying the quote (more on this later in the course).
Bid and Ask
The two different prices that you see quoted on your trading platform for each currency pair are the respective Bid and Ask (or Sell and Buy) prices available for that pair, the difference between these two prices is known as the spread. The Bid is the price on the left, this is the price at which you can sell a given currency pair and is the lower of the two prices listed. The Ask is the price on the right, it's the price at which you can buy a given currency pair and is the higher of the two prices listed.
Essentially the Bid price tells you the most that buyers are prepared to pay for a currency, and the Ask price tells you the least that sellers are prepared to accept to sell a currency. All currency transactions involve a Bid/Ask spread. FxPro receives Bid and Ask quotes from our own liquidity providers, and by making different banks compete for your trades we select the most competitive Bid and Ask prices available to us and forward them to you. We make our commissions either by slightly marking up the spread if you trade on our MT4 platform, or by charging a set commission for opening and closing positions if you trade on our cTrader platform. A transparent broker's revenue should only come from these sources.
Pips and Ticks
When viewing currency prices on your trading platform you'll notice that they are displayed to more decimal places than you may be used to. Most of us are accustomed to calculating our country's currency to two decimal places. This is because as mediums of everyday exchange most currencies have 100 fractional units. There are one hundred pennies to the pound, one hundred cents to the dollar etc.
On the Forex markets changing currency values are calculated by smaller increments. A pip is the name of the smallest increment that currency values can fluctuate by. For most currencies the pip is the fourth decimal place, in the case of the Japanese yen it is the second decimal place. FxPro calculates currencies to five decimal places on most pairs and to three decimal places on the Japanese yen. The ability to price pairs to an extra tenth of a pip allows us to more accurately reflect market conditions, which means that you get a narrower spread than when prices are just rounded up or down to four (or indeed two) decimal places. There is no convention for the naming of this fifth decimal place, some call it a fractional pip, some refer to it as pip decimal precision, and others have affectionately called it a pipette.
Pips should not be confused with ticks. While a pip is the smallest increment by which a currency can change in value, a tick is the increment by which it actually does change in value. So say a currency pair's value changes 3 times between 13:01 and 13:02, these fluctuations can be as small as a single pip but they can also be larger. It could, for instance, jump 3 pips in value from 1.33912 to 1.33942, then drop by a single pip to 1.33932, and then jump by another four pips to 1.33972. The actual moves it makes, irrespective of the number of pips that each move is worth, are called ticks.
Even though ticks are what you will observe as you monitor a live chart of a currency, pips are what will make the difference to your trading account balance. This is why it is so important that you understand them. Pips are important for a couple of reasons. Broker spreads are quoted in pips, so a 1.2 pip spread means that there is a difference of 1.2 pips between the Bid and Ask prices on a given currency pair. Also, as a trader, your profits and losses are governed by how many pips the pair you have invested in rises or falls before you Buy or Sell. Once you have opened a position each pip up or down will be worth a certain amount of money to you, depending, of course, on the volume of your position and how much leverage you are using.
Successful currency trading can be boiled down to a very simple formula. Make pips; keep pips; repeat. As you will find out when you begin practicing with your demo account this formula is much easier expressed than it is realised.
Volume, leverage and margin
Trade volumes, leverage and margin are also common points of confusion for many beginners. Let's begin with volume.
Volume: refers to the actual size of a trade and is ordinarily calculated in lots. In Forex a lot represents 100,000 units of a currency, in other words one lot of EUR/USD is a position worth 100,000 euros. Over the past few years mini and micro lots have also been made available to traders; a mini-lot is worth 10,000 units and a micro-lot is worth 1000 units of the currency being bought or sold.
Depending on the platform you are using this can be represented differently. On the MT4 platform your trade execution window has a section labelled 'Volume', from here you can select the size of the position you are to open. 1.0 is one lot, 0.1 is a one mini-lot and 0.01 is one micro-lot. So, for example, a trade volume of 0.4 on EUR/USD is a position worth 40,000, euros. On the cTrader platform volumes are labelled in a more familiar way, with options to enter trades anywhere from 10k (thousand) to 100m (million) being available as long as you have adequate margin in your account.
Let's move on to leverage.
Leverage: enables you to command positions that exceed the value of your initial investment. Any time you borrow money or use a financial instrument such as a CFD to make an investment that exceeds the value of your capital, you are using leverage. In trading leverage is expressed as a ratio. FxPro offers its clients leverage from 1:1 (no leverage) to 500:1 (500 times the amount invested). So, say you want to buy 100,000 euros (1 lot) and have your account leveraged 100:1, then you will only need to have 1000 euros (or the equivalent depending on the currency your account is denominated in) as margin to guarantee the position.
Now on to margin.
Margin: can be thought of as a deposit that is required when using leverage. Each time you open a leveraged position a certain amount of your account balance is secured as margin. The exact amount is dependent on the size of the position and the leverage which is being used. Margin is there to guarantee the position you have opened in case it goes against you. Just as each pip up or down in an open trade will be reflected in your account balance, it can also eat into your margin should it turn against you.
Your free margin is the amount you have in your trading account which is not currently being used to guarantee any positions; this amount can be used to guarantee the opening of further trades.
Your equity is your trading account balance plus or minus the profits or losses from any open positions you have.
Your margin level is calculated as a percentage and is the ratio of your equity to used margin. When this figure drops to 100% it means that all of your trading account balance is being employed as margin and no further positions may be opened. Keeping your margin level as high above 100% as possible is important, especially for traders who invest on longer time frames. A high margin level allows you to stay in a trade for longer should it move in the opposite direction, so if you are convinced of the underlying trend you can wait for it to re-establish itself without risking a margin call. If you are confident in the position you have taken and regard the market's move against it as temporary, you can afford to ride it out and wait for the trend you have invested in to reassert itself.
As mentioned earlier, the reasons that Forex trading used to be much less accessible to individual investors are related to volumes and leverage. Before mini- and micro-lots the minimum trade volume was 1 lot, factor in that leverage also used to be very limited, and it becomes apparent that opening the smallest possible Forex position only a decade ago required a substantial amount of capital. This is not the case today. Today an educated trader with a solid grasp of risk management can trade on the world's currency markets, and be successful, with a relatively small initial investment.
02 – Why Trade Forex?
High liquidity and price stability
Forex is hands down the largest market in the world. The preliminary report from the Bank of International Settlements (BIS) for April of 2013 has foreign exchange turnover at a record-breaking 5.4 trillion US dollars per day. This figure dwarfs the daily turnover of all the world's equity markets combined.
What this means for you as a prospective trader is that Forex most markets are highly liquid; currencies can easily be bought and sold in large quantities without prices being substantially affected. This in-turn means increased price stability. Also, the fact that currencies are traded in pairs, their value being determined by one currency's value in relation to another's, means that the value of currency pairs tend to stay within a certain established trading range most of the time. This is unlike stock markets which have been known to be vulnerable to all-out crashes in certain conditions.
24/5 trading
Unlike stocks, bonds and options, Forex markets are open around the clock between Monday and Friday. Each trading day is actually comprised of three trading days rolled into one because the Asian, European, and American markets overlap as they open and close throughout the day. As a result you do not have to wait for markets to open, they are always open, leaving you free to trade whenever you like.
Profit in both upward and downward trending markets.
Forex traders buy, or go long, when they expect a currency pair to rise in value, and sell, or go short, when they expect a currency pair to drop in value. However, since currencies are always quoted in pairs, every position you take involves being long on one currency and short on the other. So when buying EUR/USD, for example, you are long on the first currency in the pair and short on the second. This means that as a Forex trader you are easily able to position yourself in a way that allows you to profit, regardless of the state of the underlying market. This is not the case for all investment vehicles. Stocks are a perfect case in point because even though the facility does exist for investors to short stocks, shorting a stock is more complicated, involves taking on more risk, and in some cases additional fees, than when buying or going long.
Low entry and transaction costs
The sheer number of market participants and stiff competition between brokers has led to low entry and transaction costs compared to other financial instruments. This is a relatively recent phenomenon; traditionally Forex markets were only open to institutional investors and very wealthy individuals. This was because the minimum lot sizes and margin requirements from the banks were high. As the retail sector has grown, brokers who aggregate the positions of smaller investors and forward them to the markets have come onto the scene. Lot sizes and margin requirements have shrunk so much over the past decade or so that you can now open a Forex account and start trading with as little as $500 US dollars*. Also, with more and more retail brokers competing for your trades, spreads have narrowed and commissions have dropped drastically over the past few years. This has led to online Forex being one of the most cost-effective trading vehicles available to retail traders.
*recommended minimum amount for MT4 with FxPro
High leverage
Leverage is, of course, a double-edged sword, and we will get into this in further detail later on in the course. Nevertheless the current state of play reflects what traders have been demanding of their brokers, and one of these demands has been for ever-increasing leverage ratios. Compared to other instruments where leverage is limited, Forex boasts the highest leverage in retail trading. It is now commonplace for traders with modest trading account balances to leverage their capital up to 500:1 and command far larger positions than they ever would have been able to in the past. Also, it should be noted that interest is not charged on leverage in Forex. This is because, in essence, you are not buying or selling, but rather agreeing to do so at a future date. This means that in Forex leverage is not borrowed capital as it is in stock trading, which does involve paying interest on the capital used to leverage your positions (more on this later).
Negative balance protection
One of the criticisms levelled at Forex brokers, is that by offering highly leveraged trading accounts they expose their clients to the risk of losing more than they invested in the first place. This is not so. While using leverage carries with it the risk of exacerbating losses in the same way as it provides the potential of amplifying returns, it is now standard practice for all reputable brokers to offer their clients negative balance protection. What this means is your trading account will never fall below zero. You will receive margin calls if your margin level drops below a certain percentage of your equity, depending on the platform you are trading on. Should it continue to drop your broker will begin automatically closing any open positions you have so as to protect you from incurring losses beyond the capital you have in your account.
No suspensions or de-listings
Unlike stocks the foreign exchange markets are live 24/5, irrespective of the underlying market conditions. This means that no-matter what is happening you as a trader can take the appropriate position and potentially profit. Stock trading can be suspended during times of high market volatility in order to curb dramatic changes in price, only to reopen with a gap between closing and opening prices. Also if a company fails to meet an exchange's regulations and financial criteria it can be delisted entirely from the exchange it is traded on, which can be catastrophic for an investor holding shares in it. In contrast the foreign exchange markets suffer from no such issues; currencies are always available for trading, 24 hours a day, 5 days a week.
Instant execution
The online Forex industry has had to be very technically resourceful in order to address the fact that Forex is an entirely decentralised market, meaning that trades are not made over an exchange. The way traders, brokers and the interbank network are dispersed across the globe has required the development of advanced trading platforms that can provide traders with up to the second price quotes in a constantly changing environment, and to facilitate transactions between parties that can be separated by entire continents. These technological advances have led to Forex traders enjoying better trade execution speeds than almost any other form of online trading. The trading process is as easy as you entering a trade and FxPro's liquidity providers filling the order, no-matter where you are in the world.
Forex as an asset class
Historically currencies were not regarded as an asset class, but rather as a medium of exchange facilitating the trade of other assets. Now with a daily turnover of $5.4 trillion, of which Spot transactions account for more than $2 trillion, it's fair to say that a great deal of Forex's daily turnover is speculative in nature, meaning that today an increasing percentage of traders and investors treat foreign exchange as an asset class in its own right.
Increasingly level playing field
This applies to all trading instruments, but especially to online Forex. The same technologies that have made online Forex trading possible have also made information freely available. Nowadays resources that were once only available to large financial institutions are open to everyone. In addition to this, the speed at which information travels across the globe has meant that a trader monitoring their open positions from home can react just as swiftly as a professional trading from the very thick of it in London, New York, or Tokyo. Knowledge is indeed power, and today's information technology provides it in abundance. Especially considering how incredibly complex the Forex markets are, and the myriad of influences which they are subject to, both macro and micro-economic, online traders are now better positioned than they have ever been in the past to take advantage of information and use it to manage their capital intelligently.
01 – Welcome
Welcome to FxPro Trading Academy. If you're reading this you have decided to join one of the world's fastest growing online communities. Since the Internet revolution made it possible to trade currencies online a little over a decade ago, more and more people have turned to Forex, either as a way to supplement their existing incomes, or as a way to completely escape the workaday world and earn money on their own terms. Most seasoned Forex traders will tell you that those who end up profiting, in the long run, are in the minority. But despite this the number of people turning to online Forex continues to grow. Trading Forex is indeed risky, and we're not here to obscure these risks, or to give you a false sense of your own abilities. We're in the business of helping to create educated traders; this is what FxPro Trading Academy is all about.
One thing that not many people in the industry discuss very often is that the churn rate in online Forex is incredibly high. One of the more sobering statistics is that most beginners tend to wipe out their trading account balances within their first few months of trading. Brokers draw novices in, convince them that currency trading is as simple as applying a few technical indicators or clicking 'Buy' when an economic report comes in better than expected, then they watch them lose it all, safe in the knowledge that more beginners are flocking to their websites all the time. Our business model is different. We want our traders to have long and profitable trading careers. And while we may not be able to guarantee your success, we do our best to ensure that you go in with your eyes open and take your best self to the markets every time you trade.
A few things about this course.
FxPro Trading Academy has been designed to prepare a complete beginner for the challenges of trading on the world's currency markets. By the end of this course you should know how Forex works, where you stand in the currency trading food chain, and what steps you can take to increase your edge. Don't feel that you have to go through the material linearly. If there is a specific subject that intrigues you please feel free to tackle it first, and then move on to other sections depending on the questions that arise as you move through the material.
Many people pick things up quicker when they direct their own learning, and our Trading Academy has been created to allow for this. If you are new to Forex it's advisable that you eventually cover all of the material, but the order in which you choose to do so is entirely up to you. If you have some knowledge of trading there are sections that you will no-doubt want to skip, feel free to pick and choose what's useful to you. If you fancy yourself as some kind of Forex-trading mastermind then you're in the wrong place, surely.
Recent developments in neuroscience are starting to throw older, more established methods of learning into question. What is being demonstrated over and over again is that experiencing the difference between what you have attempted to do and the actual result, then correcting your behaviour accordingly and trying again, is a much more efficient way to acquire new skills than plain old textbook learning or attending lectures. The most important part of this trading academy, by far, will be the demo account that you will use to practice trading with as you progress through the material. We regard it as essential to your growth as a trader; this is why FxPro offers unlimited demo accounts for both of its main platforms. Should you lose the demo balance you started with you can always re-deposit more funds from FxPro Direct entirely free of charge. An unlimited demo account wasn't always as easy to come by in online Forex, so take advantage of it. The more practice you put in on your demo account, the more proficient you will be when you finally start trading with your own money. Make sure you sign up for one before proceeding any further.
Register for a demo account here
Finally, we recommend that you take advantage of the trader's glossary and FAQ sections of our help centre. As you work through the trading academy you will come across unknown words and concepts. Rather than stopping to explain a new term each and every time it arises, we have decided to gradually immerse you in this language until you become proficient in it yourself. Hovering your cursor over certain words will bring up further information from our trader's glossary. Beyond this we encourage you to be active while working through the trading academy, the help centre should be regarded as supplementary to this course so make sure you refer to it often.
Right, let's get started!
11 – How to Use Autochartist Metatrader Plugin
Technical analysis, while proven to be one of the most reliable ways to make informed trading decisions, can be time consuming and often requires multiple indicators and other tools. In order to simplify chart analysis and ensure a higher percentage of profitable trades among our clients, OctaFX has partnered with Autochartist, one of the leading providers of chart pattern recognition tools.
The Autochartist Metatrader plugin delivers real-time trading opportunities straight to your terminal. See chart patterns and trends in just one click. You'll also receive daily Market Reports on each session direct to your inbox.
Get the Autochartist Metatrader plugin
- Your total combined accounts balance must be 500 USD or more.
- Download the plugin.
- Drag and drop the plugin Expert Advisor onto one of your charts.
How do I open a trade with the Autochartist plugin?
The Expert Advisor plugin does not open any trades, it only shows the patterns identified by Autochartist.
1. Find the currency or the opportunity that you're interested in. You can do this in a number of ways.
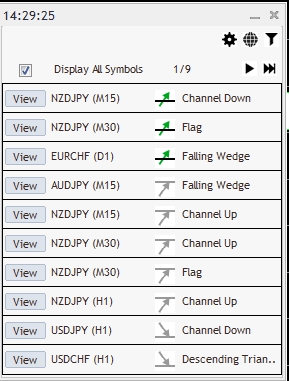
Click the left and right arrow buttons to browse all opportunities present in the market at that moment.
If you're interested in particular timeframe or pattern types, use the Filters option to filter market activity.
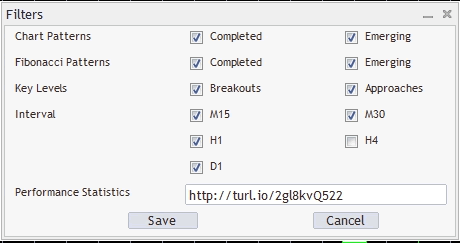
Here's a short explanation of each filter:
- Completed chart pattern - the pattern has been identified and the price has reached the target level
- Emerging chart pattern - the pattern has been identified but the price has not reached the target level yet
- Completed Fibonacci Pattern - patterns that form when the price graph moves up and down in a particular price ratios
- Emerging Fibonacci Pattern - if the price reaches and turns around at the price level of the pink dot, the pattern would be complete and the expected levels of support or resistance would apply
- Key levels: Breakouts - trading opportunities where the price has broken through the support level
- Key levels: Approaches - trading opportunities where the price has broken through the resistance level
Uncheck 'Display all symbols' to only see the patterns identified on the instrument you've opened the chart for.
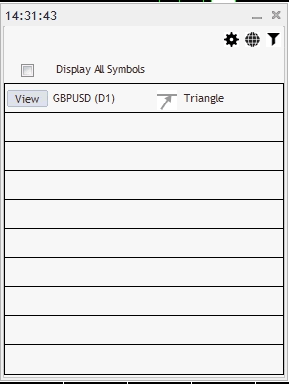
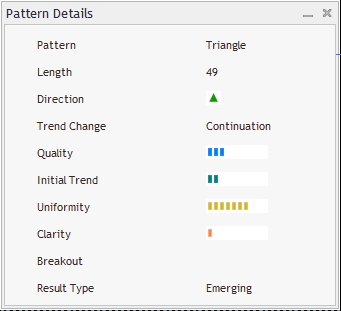
Click 'View' to see each opportunity identified on the chart. Get more details using the 'Pattern details' window.
2. Use the predictions to help you decide which direction to trade in. The general rule of thumb is to go long (open a buy order) when the price is expected go up and to go short when the price is expected to go down.
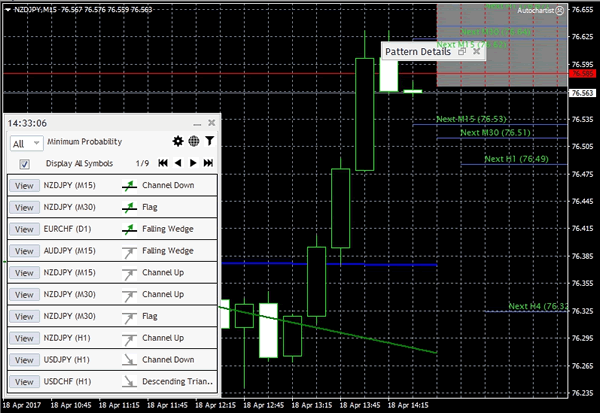
CHFJPY is expected to appreciate based on triangle pattern.
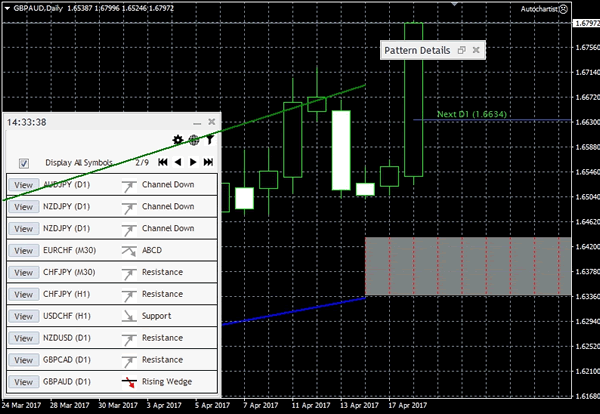
EURCAD is expected to depreciate based on triangle pattern.
3. Press F9 to open a new order window or click 'New Order'.
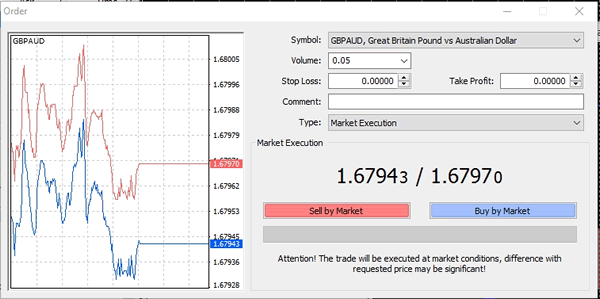
4. Make sure the instrument selected is the one you want to trade, and specify the volume of your position in lots. Volume depends on the size of your fund, your leverage and which risk to reward ratio you are aiming for.
5. Click Buy or Sell depending on the price direction.
6. Setting a stop loss and take profit based on volatility levels is recommended, however this step is optional.
Click 'View' in the Autochartist plugin to open the pattern you're going to trade. Enable 'Shift end of the chart from right border' at the toolbar.

'Volatility levels' are displayed on the right hand side of the chart. This is an approximation of how much the price is expected to fluctuate.
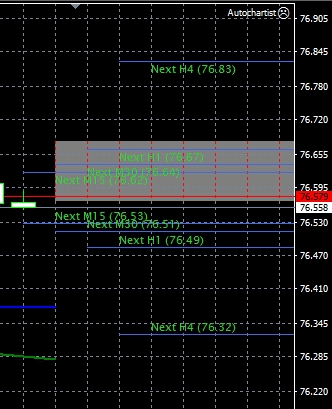
If you're going long (opening a buy order), you should set your Stop Loss at the price which is below the order open price and Take Profit at the price which is above the open price. For a short (sell) position, set the stop loss at a higher price and take profit at a lower one.
When choosing SL and TP levels, give special consideration to the minimum stop level, which you can check by right clicking the instrument in 'Market Watch' and selecting 'Specification'. It is recommended from a risk management perspective to keep a risk:reward ratio of at least 1:2.
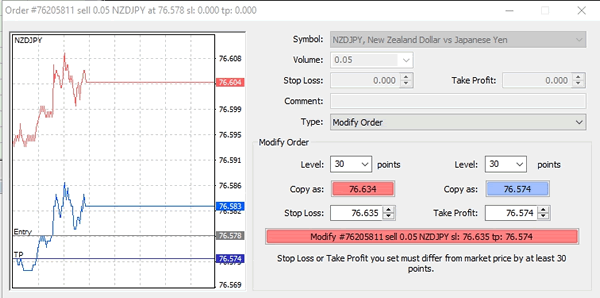
Having identified the appropriate levels, find your position in the 'Trade' tab. Right click and select 'Modify or delete order'.
Set Stop Loss and Take Profit and click 'Modify' to save your changes.
The Autochartist plugin provides a unique insight into the market situation and saves you a significant amount of time. If you'd like to know more about Autochartist, get in touch with our Customer Support team.
10 – How to Use Autochartist Market Reports
Autochartist Market Reports provide a clear overview of the current trends across most popular trading instruments. Delivered to your inbox at the beginning of each trading session, the reports can suggest which trade you should enter next or whether your current strategy needs an adjustment. Moreover, it provides significant time saving benefits in analysing the charts.
Each Market Report consists of three main sections:
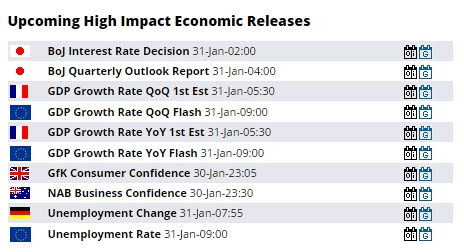
1. Upcoming High Impact Economic Releases
At the top left corner you will find a list of all releases scheduled for the day. These reports are important as it is not uncommon for the market volatility to increase during the major news, therefore risk management techniques may be required in order to lessen risk exposure.
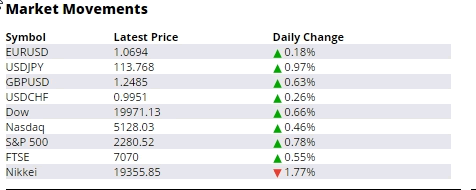
2. Market Movements.
"Market Movements" section provides an overview of recent price activity for a number of instruments: it shows the direction and the percentage of the price change during the last 24 hours.
Daily change percentage is highly correlated with the news and reports - the price may appreciate, depreciate or change its direction completely after an important release.
3. Trading opportunities.
The actual price predictions are right below the "Market Movements" section. Each of them contains information about the expected price, the time during which the price will be reached, a short breakdown of the underlying indicators and the name of the pattern.
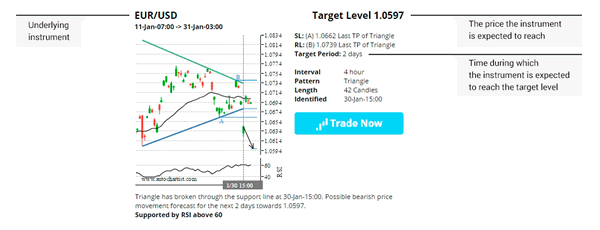
- SL - Support level
- RL - Resistance level
- Interval - chart periodicity interval the pattern emerged from
- Pattern - the name of the pattern the underlying trading opportunity is based on
- Length - the number of candles the opportunity is based on
- Identified - date and time when the pattern emerged.
In this case the current EURUSD price is 1.07240. Within two days its price is expected to reach 1.05970.
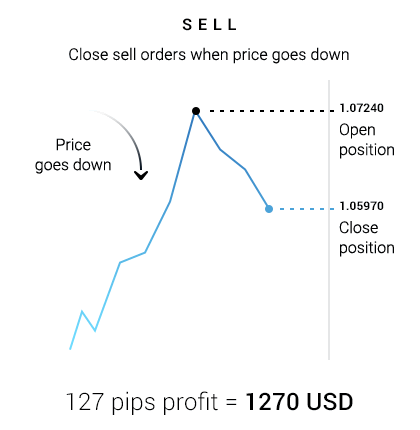
By pursuing this trading opportunity and opening a 1 lot EURUSD short (sell) position, you can potentially gain about 127 pips or 1270 USD of profit.
Currently estimated to be up to 80% correct, Autochartist Market Reports is a simple beginner-friendly tool that allows you to apply technical analysis to your trading with no effort or time required.
09 – Fundamental Analysis and Economic Indicators
Fundamental analysis is the study of how economy of the country affects its currency rate, which mainly involves interpretation of statistical reports and economic indicators. Hundreds of economic news and reports released daily allow, to some extent, to predict whether the currency value will appreciate or depreciate in future and when reversal of the current trend may be expected.
Date and time when a particular report or indicator due to be released is scheduled in advance and can be found in the Economic Calendar. It is the main tool analysts use to determine the impact news may have. It also shows experts forecasts of the data to be announced.
Central Bank and Interest Rates
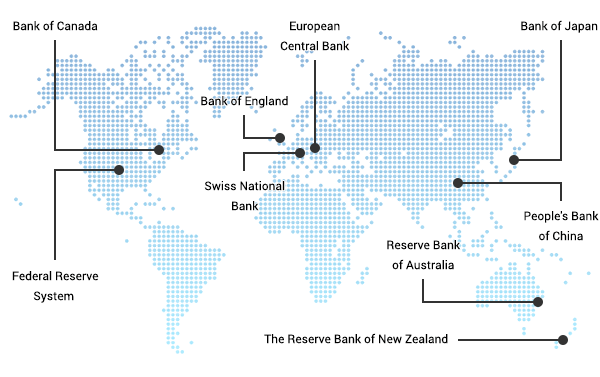
Since a central bank is often responsible for handling country's financial matters, the policy it is pursuing has a profound impact on the currency rates. For instance, to increase the value it can buy the currency and hold it in its reserves. In order to decrease the rate, the reserves are sold back to the market.
When an increase in consumer spending is required, the Central bank may lower interest rate on the loans it provides to commercial banks. If it aims to slow inflation, the interest rates are increased in order to reduce spending.
Depending on whether is it more concerned on inflation or growth, central bank's policy can be referred as to "hawkish" or "dovish". The former usually leads to higher interest rates, while the latter commonly signifies that the interest rate are about to be decreased.
Inflation
Inflation evaluates how fast the price of goods and services is rising and has a direct impact on the supply and demand for currency and thus affects its rate. The major inflation indicators are:
- Gross Domestic Product (GDP)
GDP evaluates all goods and services produced during the reporting period. An increase in GDP signifies economy growth and therefore it is used to measure inflation.
Released: advance - four weeks after quarter ends; final - three months after quarter ends; time: 15.30 EET (14.30 EEST). - Consumer Price Index (CPI)
CPI measures the value of defined basket of goods and services expressed as an index. When compared to the previous results, CPI shows how consumer buying power has changed and how it was affected by inflation.
Released: Monthly, approximately mid-month; time: 15.30 EET (14.30 EEST). - Producers price index (PPI)
This indicator shows the changes in the prices that producers received and allows to evaluate how the consumer level price could be affected.
Released: second or third week of the month; time: 15.30 EET (14.30 EEST).
Employment
Employment level directly affects currency rate for it impacts future and current spending. An increase in unemployment is believed to signify that the economy is growing weaker, thus the demand for its currency is falling. On the contrary, strong employment numbers are a sign of growing economy that usually means that the demand for currency will continue to increase.
Below you will find the most important employment reports from different countries:
- US Non-Farm payroll - an assessment of employment trends with the exception of government, non-profit organisations and farm workers.
- US Unemployment Insurance Initial Claim - the number of new unemployment benefits claims that measured the number of newly unemployed.
- Labor Force Survey - measures the changes of current employment rates in Canada.
- Wage Price Index - indicates changes in wages in Australia.
- Claimant Count Change - measures Unemployment Insurance claims changes from one reporting period to another in the UK.
Retail Sales
This indicator is important since consumer spending accounts for a substantial part of the economy. It measures the total amount spent on various groups of goods and services during a certain period of time. Retails sales growth shows that the consumers have extra income to spend and are confident in the country's economy.
Released: Monthly, approximately mid-month; time: 15.30 EET (14.30 EEST).
Home Sales
Growing housing market is one of the major indicators of a strong economy. Mainly based on the consumer confidence and mortgage rates, home sales reports show the aggregate demand among consumers for housing.
Released: Fourth week of the month; time: 15.30 EET (14.30 EEST).
Wholesale Trade Report
Wholesale Trade Report is based on the survey of 4500 wholesale merchants conducted on a monthly basis that includes statistics on monthly sales, inventories and inventory to sales ratio. It indicates imbalances in supply and demand and may help to predict quarterly GDP report, however, does not strongly impact the market.
Released: On or around the 9th of the month; time: 17.00 EET (16.00 EEST)
Balance of Payments (BOP)
Balance of payments summarizes all transactions for a certain period of time between country's residents and non-resident. All transactions are subdivided into current account that includes goods, services and income, and capital account comprising of transactions in financial instruments. These data are crucial in formulating national and international economic policy.
Released: around 19th of the month; time: 15.30 EET (14.30 EEST)
Trade Balance
The report shows the difference between a country's imports and exports and is a significant part of balance of payments. Trade deficit means that the country imports more than it exports, while trade surplus indicates the opposite. Surplus or declining deficit often signifies increased demand for the currency.
Released: around 19th of the month; time: 15.30 EET (14.30 EEST).
08 – Risk Management
Risk management, also known as money management, refers to a number of trading techniques employed to lessen risk exposure. Being affected by various factors, currency rates may be quite volatile at times, thus protecting your account against adverse price fluctuations is an essential part of a trading strategy.
The core concept of money management is to avoid risking more than 1-2% of personal funds on any single trade. This principle may greatly reduce risk exposure: provided that only 1% of initial deposit is at risk, even after several losing trades you are likely to retain the majority of account balance.
Risk to reward ratio denotes the potential profit in comparison to the amount you may lose for any given trade. For example, when you risk 100 USD on position to potentially gain 300 USD, the risk to reward ratio is 1:3.
Ratio of 1:2 is considered the minimum one should aim for as only a third of positions would need to be profitable to remain break even.
Potential profit and loss can be defined through Stop Loss and Take Profit levels.
Stop Loss and Take Profit are orders to close the position when price reaches a certain predefined level. Stop loss or Take Profit level can be identified with various technical analysis tools:
- Support and resistance: for a short position stop loss is usually placed just above resistance level, while a long position often has stop loss set a little below support level.
- Trend lines and channels: stop loss price is commonly placed outside the channel, above or below the trend line.
Let's say you open 1 lot EURUSD Buy order at 1.12097. To achieve risk to reward ratio of 1:2, you can set stop loss level at 1.12077 (2 pips) and take profit level at 1.12137 (4 pips). Thus, you will only be risking 20 USD to gain 40 USD. Depending on your initial deposit, you can set SL/TP levels even further, as long as your risk is below 1-2% of the personal funds.
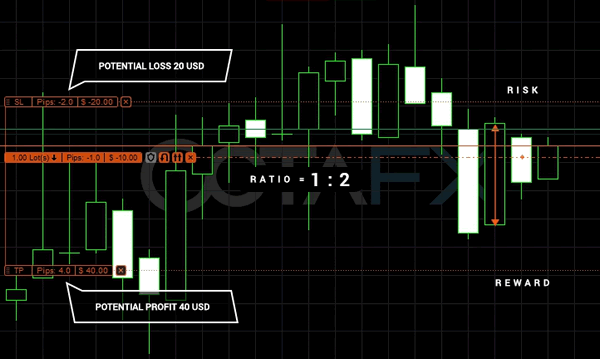
It is important to note that the price of each pip depends on the trading tool and the volume of your position.
Trailing Stop can be used to adjust stop loss level automatically whenever the price moves in a favorable direction. Along with reducing the risks, it may also eventually lock in the profit already gained.
Keep in mind, however, that neither stop loss nor take profit is guaranteed: when the market is volatile or during a price gap your order may be executed at a different price than expected.
07 – About ECN Trading
What is ECN/STP trading?
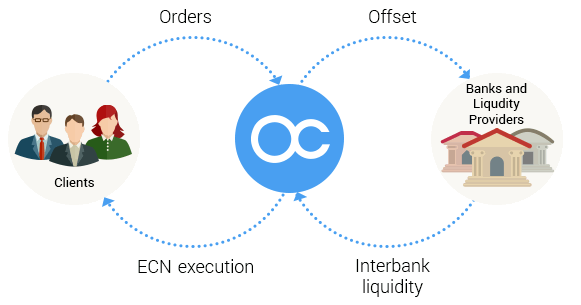
It is a broker's business model in which clients' orders are sent directly to one or several liquidity providers to be executed on their end at the liquidity provider. There may be many liquidity providers (that is, banks, aggregators, other financial institutions). The more liquidity providers a broker has in general, the better the execution for its clients can be (more liquidity available generally means less price slippage). What makes a true STP (Straight through processing) broker is that the STP broker doesn't internalise the orders, but sends them to liquidity providers, acting as an intermediary between their client and the real market.
Do you have requotes?
No, we don't. Any broker who re-quotes your orders is a dealing desk broker. A requote occurs whenever the dealer on the other side of the trade (whether human or automatic) sets an execution delay during which the price changes. Therefore the broker can't open your order and sends you a message that the price has changed. That is, a requote. You usually get a new price which can be different from the one you requested (especially when the market is volatile). Often the requote is not an improvement for the client. OctaFX doesn't have any requotes simply because we don't have a dealing desk, human or automatic (a piece of software usually referred to as a virtual dealer, automatic dealer and so on).
Can I scalp? Do you allow news trading?
Yes, you can. Unlike some brokers who prohibit scalping, OctaFX welcomes scalpers. Dealing desk brokers hold the other side of client trades, and have to decide whether to hedge or run their client's overall net position at any given moment. Therefore trading styles such as momentum scalping can make it difficult for dealing desk brokers to manage client positions, particularly as scalpers generally open and close trades relatively quickly.
Another potential issue for dealing desk brokers is that scalpers generate a proportionately large number of requests to trade at the same time during busy periods, for example during the release of key economic data, which above a certain trade size are generally handled individually and can lead to an increased number of requotes for clients.
OctaFX are not a dealing desk broker. Instead all the trades are passed to our liquidity providers. The larger the volume of orders to trade we receive, the better it is for us, as we receive a commission based on trade volume.
How do I find out if my broker is a dealing desk?
Indicators could be:
- A direct or indirect prohibition of scalping, news trading, or some other similar strategies
- Fixed spreads
- So-called "guaranteed" stop orders
- A possibility of requotes
If you encounter any of these, the broker is quite likely to be a dealing desk broker. Dealing desks brokers (also known as "market makers") create their own markets based on the underlying market. NDD (No Dealing Desk) brokers such as OctaFX act as intermediaries between the trader and the real market, and receive a defined and transparent commission for it.
How do dealing desks earn?
They earn the difference between overall client losses and client gains that aren't hedged. In general dealing desk brokers experience a two way buying and selling client flow in a given market. Dealing desk brokers need to manage the net position of the flow, whether long or short, at any given moment. Depending on the broker, a portion may be hedged in the real market and the remaining exposure, up to the brokers risk limit, run naked as a trade of the broker in its own right.
How does OctaFX make money? OctaFX needs profitable traders? WHY?
OctaFX receives a commission from its liquidity providers for each transaction.
We receive our liquidity from a wide range of liquidity providers around the world. Our system is designed to offer the best aggregated prices of our liquidity providers direct to our clients. When you open a new order, you get the best available bid (or ask) price which is available from our liquidity providers with our commission already included in the spread you see on the trading platform. Therefore we are interested in you trading more, and staying with us as our client. Therefore it's in our interest that your trading is as profitable as possible.
You have no requotes. WHY?
Putting it simply, we don't requote you because we have nothing to do with the quotes (i.e. the prices you see in your trading software). The order is filled when a price from one of our liquidity providers is available. It is important to understand, however, that we do not guarantee that your order will be filled exactly at the requested price; our system is setup to fill it by the next best price from another liquidity provider. But, again, your order will not be requoted, since we are more interested in your profitable trading.
Can liquidity providers see my orders?
No, they can't. From their point of view they see only one customer, that is, OctaFX. You remain anonymous to them in all cases.
The chart went through my limit, but my order wasn't opened. What's going on?
It is a possibility, and usually happens due to a lack of liquidity at a given time. For example, a number of clients place sell limit orders above the market prior to an important news release with a total volume of 1000 lots. When the news is released, the market goes up 50+ pips to where the chart hits the price of all these orders and requests are electronically made to open a number of orders worth 1000 lots in total. It may happen that only 200 lots are available from the liquidity providers at this price and at this given time. In this case the first 200 lots out of 1000 will be filled, while the remaining 800 will not be filled (no available liquidity) and will remain pending until the price hits the level or beyond again.
Do you allow Expert Advisors (EA's)?
Absolutely. All Expert Advisors (EA's) are welcome.
What is slippage and why does it happen?
Slippage is a slight order opening price movement which is a result of lack of liquidity (when it's already taken by other traders' orders). It may also happen during market gaps.
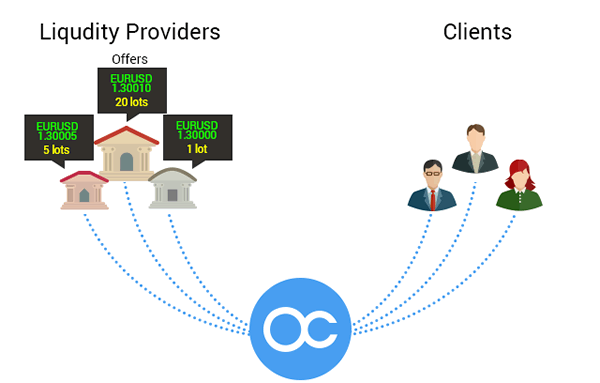
Slippage is an order execution price difference which can be a result of a lack of liquidity or speed (Other traders have got there first). It may also happen due to gaps in the pricing of a market.
It is important to understand that OctaFX do not guarantee that your order will be filled exactly at the requested price; our system is setup to fill orders with the next best price available from the liquidity providers when slippage occurs.
So during these news times it's possible that there won't be liquidity available at the price you requested. For example you want to open a 5 lot Buy order, EUR/USD, price is 1.30000. Now, in this case we can see the following liquidity available on the basic illustration above:
Provider 1: price is 1.30010, 20 lots available
Provider 2: price is 1.30005, 5 lots available
Provider 3: price is 1.30000, 1 lot available
In this case your order will be offset with Provider 2, since he has the best price and enough liquidity to fill your order. And the open price will be 1.30050, which is 0.5. pips away from the price you requested. But, again, your order will not be requoted, since we are more interested in your profitable trading.
Why don't you guarantee stop orders?
In the real market there is no such thing as a "guaranteed stop". They are offered by dealing desk brokers who create synthetic markets based on the underlying market. As dealing desk brokers generally run a proportion of the net client positions as an in-house trade against the clients, and the market is an in-house market, they have greater flexibility on stops. Guaranteed stops are typically set by the client at point of execution, can rarely be moved and incur a charge of additional spread to enter the initial trade.
In the real market any stop order is considered pending until its price is hit. After that the order is offset to a liquidity provider which may or may not involve slippage depending on the available liquidity. Therefore it's impossible to "guarantee" stop orders in the real market.