

Sample Category Title
17 – Using Oscillators or Leading Indicators
When it comes to using leading indicators, a good way of remembering how they work is to understand that they "oscillate" between two points, hence the name oscillator. This means that they bounce back and forth from point A to point B, which is another way of saying that what goes around comes around.
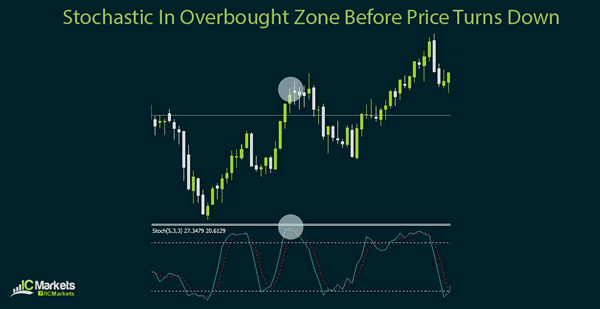
When an oscillator reaches the overbought zone or gives a sell signal, it eventually goes down along with price action. When an oscillator reaches the oversold zone or gives a buy signal, it then moves up along with price action.
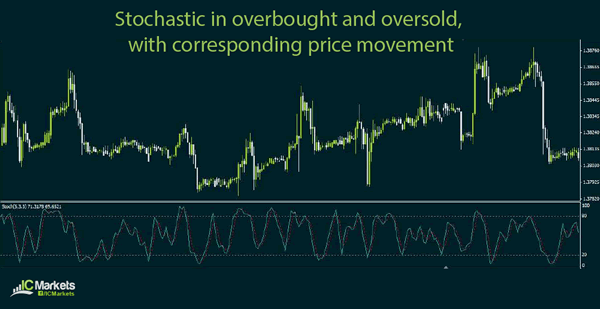
As you can see from the illustration, once stochastic hit the overbought zone above 80.00, price eventually went down along with the oscillator's movement. When stochastic reached the oversold area below 20.00, price eventually went up along with the oscillator's movement.
Of course the magnitude of the move still depends on a number of other technical and fundamental factors, and these are not necessarily indicated by the leading indicator's movement. In other words, the move up can be stronger than the move down or vice versa, depending on the market trend.
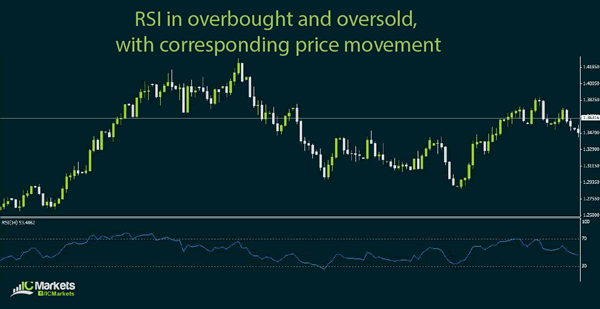
Another example of a leading indicator is the RSI or the relative strength index, which functions mostly like the stochastic. When RSI reaches the overbought area and gives a sell signal, price moves down. When RSI reaches the oversold area and gives a buy signal, price moves up.
The parabolic SAR (stop and reversal) is a special kind of leading indicator which also provides exit signals. Aside from that, this oscillator is usually applied as an overlay on price action to better allow the trader to visualize his entries and exits.
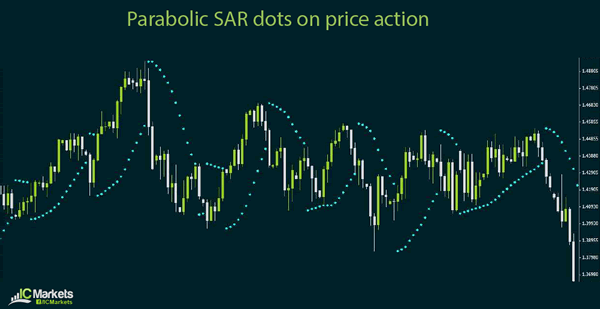
As you can see from the illustration, dots form above the price when a selloff is about to take place. On the other hand, dots form below the price when a rally is about to happen.
It may not be wise to jump in a long or short trade the moment a single dot appears below or above price action. One can wait for two or three dots to form before entering a position on the next candle then exiting when one or two dots form in the other direction.
Stochastic and RSI can also be used to identify trade exits by checking if the oscillator has reached the opposite end and is signaling a possible reversal. For stochastic, a crossover could signify a potential market turn. For RSI, a move below the middle 50.00 level could be an early sign that the trend is weakening.
Of course the parameters of these leading indicators can be tweaked to suit your trading style. More often than not, shorter-term parameters can generate more signals while longer-period ones give fewer signals. You can try different settings to filter out the false signals and to come up with a system that generates optimal results.
16 – Types of Technical Indicators
Technical indicators are grouped into two main classifications: oscillators or leading indicators and momentum or lagging indicators. Moving averages, as discussed in the previous section, typically fall under the category of lagging indicators but the parameters can be modified or shifted to allow it to act as a leading indicator.
As the name suggests, leading indicators give trade signals when the trend is just about to start. In other words, leading indicators give early trade signals.
On the other hand, lagging indicators give trade signals when the trend is already taking place. This means that lagging indicators give confirmation trade signals.
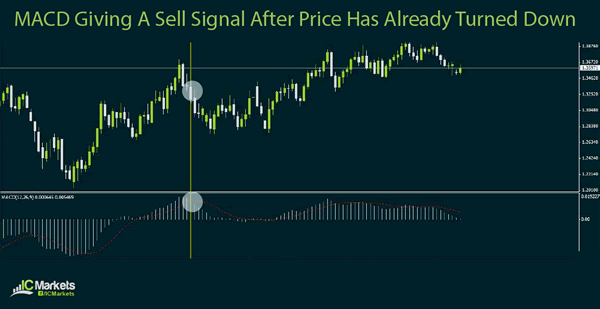
There is no right and wrong when picking whether to use a leading indicator or a lagging indicator. Some traders decide to use a combination of both, with the leading indicator serving as an alert for a new trend and the lagging indicator acting as confirmation for a trade entry.
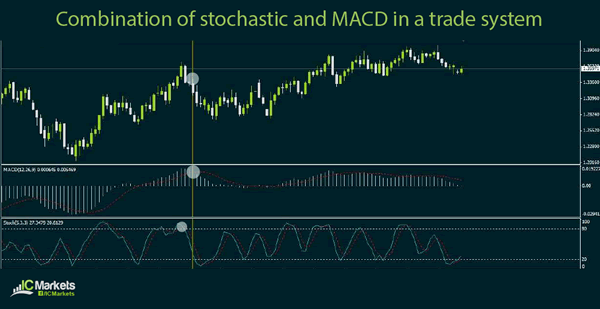
As you can see from the chart above, the stochastic hints that a new trend is about to take place while the MACD gives the go signal for the trader to enter a trade in the direction of the new trend.
Some argue that using only one or the other can give erroneous trade signals. After all, sticking with only a leading indicator can give false signals, telling the trader to enter a trade the moment a new trend seems to start. On the other hand, using only a lagging indicator can give late signals, with the trader not able to take advantage of the majority of the price movement or entering a trade when the trend is almost over.
At the end of the day, it is up to the trader to determine which technical indicators he is most comfortable with and which ones he thinks could yield the best returns. Trial and error is often key to figuring out which indicators and which parameters could lead to profitable results.
In the next sections, the different kinds of leading and lagging indicators will be discussed. Note that it is not important to memorize how the indicators are derived but that it is more crucial to have a clear understanding of how they work and how they can be applied to forex trading.
15 – How Moving Averages Work
This section covers the basic technical indicators used in forex trading, the most common of which is the moving average.
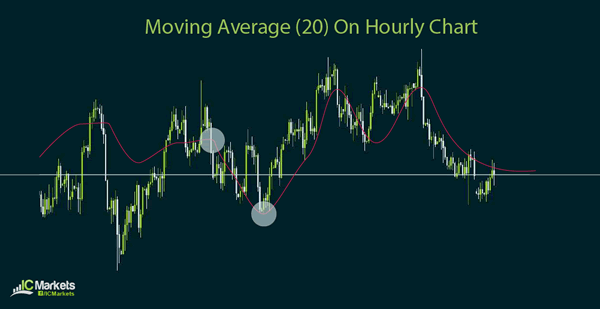
As the name suggests, this kind of technical indicator measures the average closing price of the currency pair for a specified period. For example, using the moving average (20) on an hourly chart takes the average of the closing price for the past 20 hours.
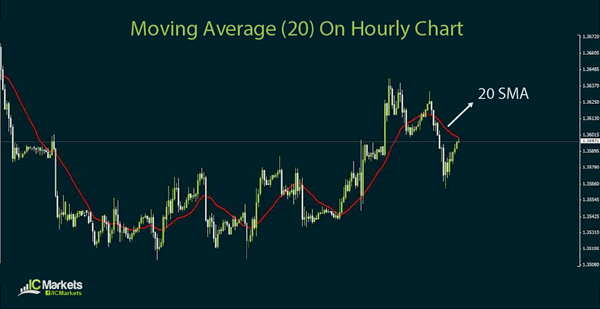
There are two main types of moving averages: simple and exponential. This has to do with the method in which the average is generated, with the simple moving average taking the sum of the closing prices then dividing by the number of time periods and the exponential moving average assigning weights to more recent time periods.
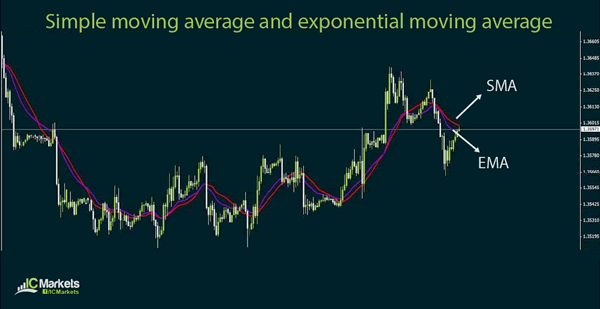
Either way, the goal in using moving averages in technical analysis is to smooth out price action and get a better idea of how future price movement will fare. Simple moving averages allow you to see a general idea of past price action while exponential moving averages incorporate the latest price volatility.
Moving averages can be used as a single indicator or as a group. As a single indicator, this is often used to generate buy or sell signals based on price crossovers. It can also be treated as a dynamic support or resistance level in a market trend.
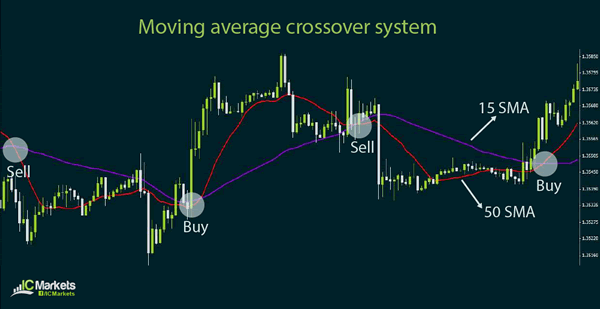
Using multiple moving averages is also useful for crossover systems. For instance, a trading system can specify that buy signals would be generated when the moving averages are arranged from shortest-term to longest-term. A sell signal could be generated when the moving averages are arranged from longest-term to shortest-term from top to bottom.
Which kind of moving average should you use? This depends on the type of trading strategy you are planning on using. In particular, traders who are more aggressive with their entry orders and are inclined to enter trends as soon as they start may prefer a short-term exponential moving average since this is very sensitive to recent price action. The downside to this method though is that it can be prone to fake outs.
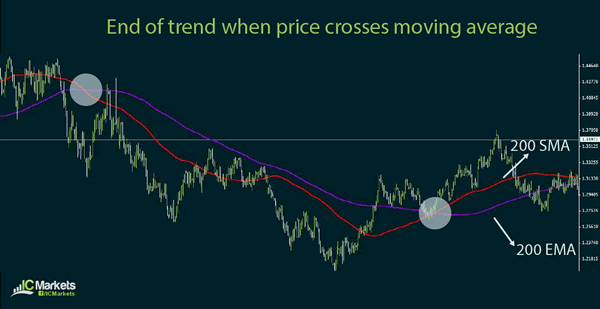
As for exits, moving averages can also give signals to close a trade when a new crossover has taken place. This is usually seen as a sign that a reversal is forming and that it may be time to book profits
14 – Using the Fibonacci Tool with Technical Indicators
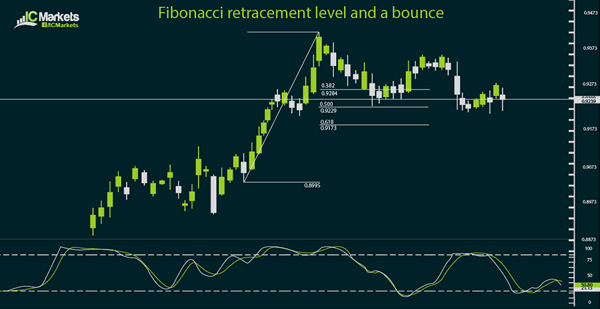
The use of Fibonacci retracement and extension levels could also be combined with technical indicators. For instance, one can enter at market when stochastic has already made a turn from the overbought or oversold area and price is showing signs of bouncing off a Fibonacci level.
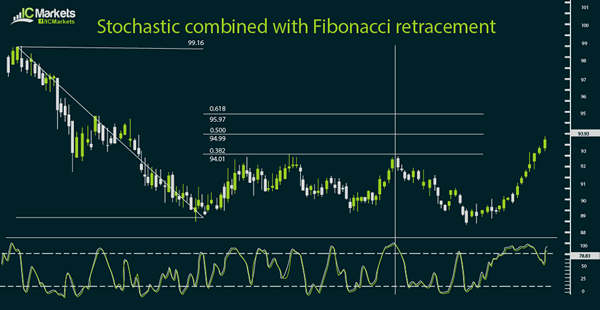
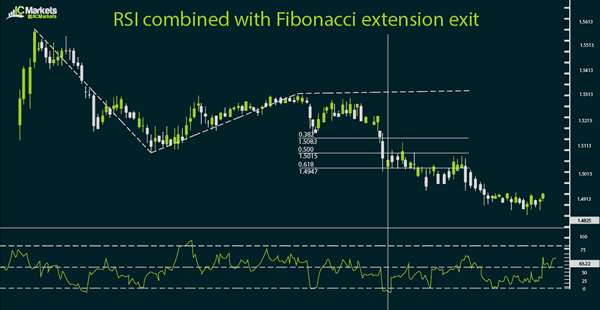
Similarly, one can decide to exit a trade at market when price is testing a Fibonacci extension level while RSI is moving out of the oversold or overbought area.
Another way to look for confirmation when using Fibonacci retracement and extension levels as entry and exit points would be to look at Japanese candlestick formations. As discussed in earlier sections, these tend to be reliable signals of a reversal in price action.
In particular, a doji forming right on a Fibonacci retracement level could be a sign that price is ready to turn. For additional confirmation, you can apply technical indicators such as stochastic or MACD to determine if it's a good time to enter a trade or not.
Take note though that using too many technical indicators doesn't necessarily improve their reliability. In fact, too much indicators might lead to an extremely cautious trading strategy that misses out on several valid trade signals.
Seasoned traders often say that the best trading systems are the simplest ones, and it can't get any simpler than watching basic candlestick patterns. It can be difficult to memorize the formations, particularly the group candlestick patterns, and those might be rare to spot. At the end of the day though, this is said to be one of the most reliable ways of spotting a possible reversal or trend continuation.
A spinning top on a Fibonacci retracement level could also serve as a sign of a market turn. Evening or morning stars could be signals that the Fibonacci retracement or extension level could hold as an inflection point.
Generally speaking, these candlestick patterns combined with Fibonacci levels tend to work better on longer-term time frames. However, there's no reason to not use these for scalping or shorter-term day trade setups. What's important is that you have a strong grasp of how these inflection points are used and what the candlestick patterns mean.
13 – Using the Fibonacci Tool with Trend Lines
As discussed in the previous sections, Fibonacci retracement is often used during trending market environments so it makes sense to combine it with the use of trend lines.
Of course this also requires one to be able to draw trend lines properly, and the rule of thumb is to use one that has already been tested at least thrice. This entry-setting method tends to be more reliable on longer-term time frames.
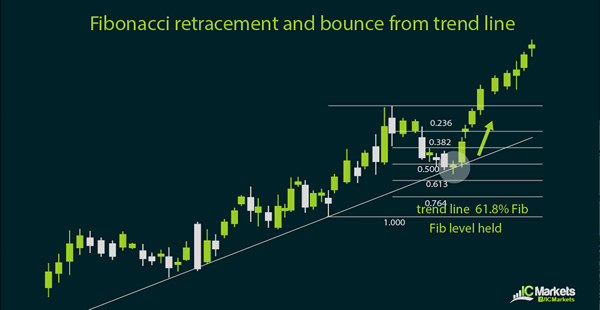
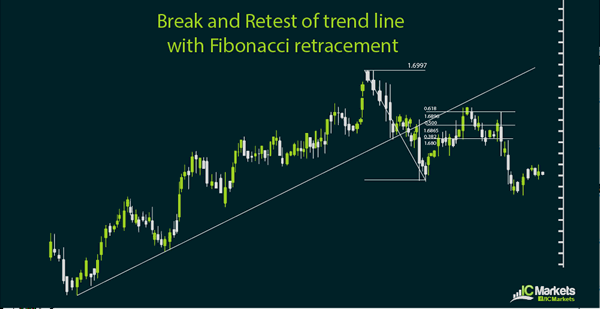
As with other types of support or resistance combined with Fibonacci retracement, there's always the chance that this method might fail. This could be indicative of a change in market bias or a shift in trend, signaling the start of a reversal.
In this case, traders who are able to be flexible enough to quickly shift biases could use the Fibonacci levels in the direction of the reversal to wait for a potential retest of the broken trend line.
Fibonacci extension levels can be used in setting profit targets as well, but some traders opt to close their trades or have a partial exit at the latest swing low or high. In a downtrend, price typically finds support at the latest swing low while the latest swing high usually acts as resistance in an uptrend.
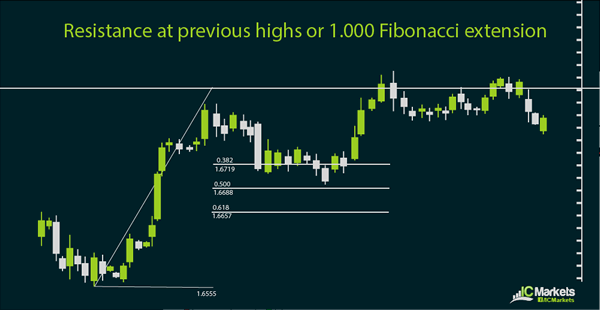
However in stronger trends, price tends to form new highs or lows. When price has already established which particular Fibonacci retracement level triggered a bounce, it could be easier to determine which extension levels could serve as exit points.
The selection of profit levels could vary depending on the aggressiveness of a trader. This could also depend on the reward-to-risk ratio that a trader is aiming for. Generally, trades that yield at least a 1:1 return on risk make for a good trade idea.
If the scaling-in method is a choice for entering trades, then the scaling-out method is an option for exiting trades. As mentioned earlier, one can book profits or exit part of the trade once price tests the previous swing high or low. The second or third profit level could be set at the next Fibonacci extension levels to press the advantage or catch more pips in case price makes new highs or lows.
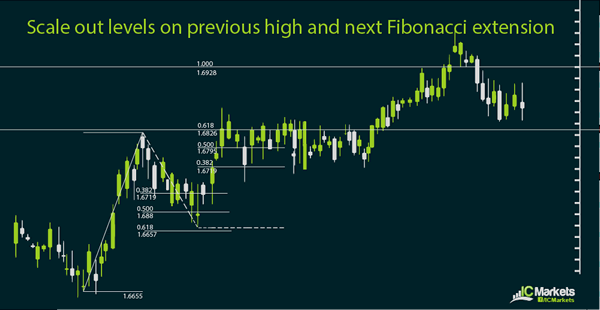
You can opt to close half your trade position on the previous high or low then adjust your stop loss to your entry level in the remaining open position in order to protect your recent profits. That way, you can wind up with a risk-free trade on the open position. This is one of the many ways you can reduce your exposure, particularly when there are top-tier events up for release or if you won't be able to watch your trades for a while.
12 – Using the Fibonacci Tool with Support and Resistance
This section further illustrates how the Fibonacci retracement and extension levels tend to have a higher probability of holding when they coincide with other types of support and resistance.
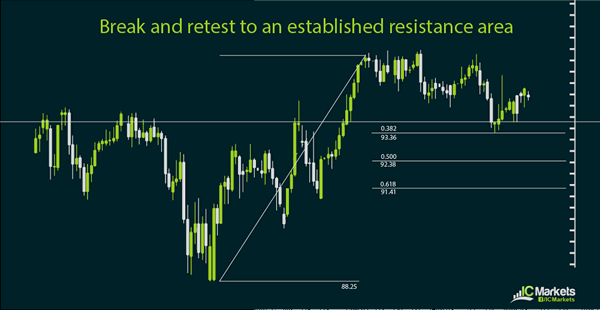
For instance, a price breakout tends to pull back to the broken support or resistance level as a retest. A downside break from a key support area, particularly in a longer-term time frame, tends to be followed by a retracement to that same level before price resumes its drop.
Similarly, an upside break from an established resistance area is usually followed by a pullback to that same level before price resumes its climb. Using the swing low to the swing high or the peak of the upside breakout should generate potential entry levels, and the one that is closest to the broken resistance area could have plenty of buy orders located.
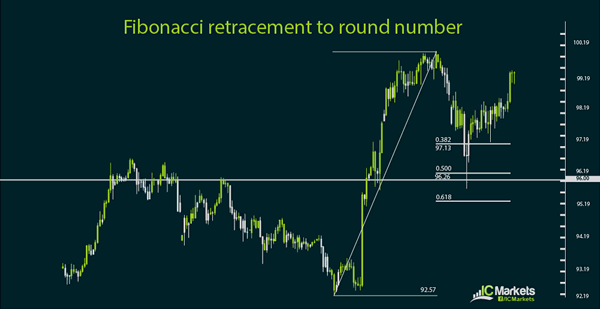
Another way to select which Fibonacci retracement level to place an order on is the one closest to a major or minor psychological level. Since these round numbers tend to be respected best by yen pairs, this method typically works on those.
The reason why this combination of Fibonacci levels with support or resistance works as an entry method is that plenty of traders already have their eyes locked on those levels. As such, they tend to have a self-fulfilling property in that the sheer number of buy or sell orders located in those levels are enough to make it hold and trigger a bounce.
The same principle applies for selecting profit targets with Fibonacci extension levels. Potential levels could be those located at established support or resistance levels, those nearby major or minor psychological levels, or pivot points.
In the event that you are having trouble choosing among the potential Fibonacci retracement levels to set your entry order on, you might want to consider the scaling in method. This involves setting several entry orders on multiple levels, with the trade entry price being the average of those levels.
Remember that it's not absolutely necessary to get the best possible entry price. What matters is that you did your homework, tried to come up with a high-probability setup, selected a potential entry point, and have a strategy to manage your risk properly.
Of course, nothing is set in stone in the forex market, and even the best technical analysis combining Fibonacci levels with support or resistance still has the chance of failing. This can happen when there is a sudden shift in market sentiment or an unforeseen event.
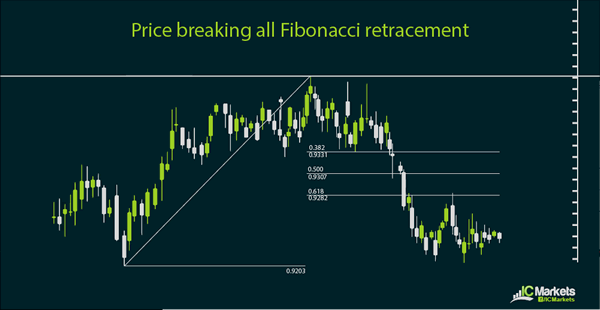
In this case, it could be a sign of a market turn and the start of a new trend. Before shifting sides, traders often zoom in to shorter-term time frames to see if there are opportunities to hop in smaller retracements.
Fibonacci retracement for intraday trading can also be used in conjunction with the previous day high, low, open, or close as these can also act as intraday inflection points.
11 – Fibonacci Extension
As introduced in the previous section, Fibonacci extension levels serve as excellent points for setting profit targets. After all, it's not enough that you try to pick the best entry levels for your trade. You must also be able to determine how long you plan to hold on to the trade or how long you think the market trend might last.
Just like the Fibonacci retracement levels, the extension levels are also based on the golden ratio determined by Leonardo Fibonacci. When it comes to Fibonacci extensions, the important levels to remember are 0, 0.382, 0.618, 1.000, 1.382, and 1.618.
Again, there is no need to memorize all these figures as the Fibonacci extension tool is also included among most forex trading platforms and charting software. You simply need a working knowledge of how these levels are generated and how you can apply this in coming up with trade ideas.
While the Fibonacci retracement only involves connecting two points in price action, which are the swing high and swing low, the Fibonacci extension has a third point to be connected and this is the retracement level where you plan to enter your trade or where price has already bounced. After clicking on the swing high and low, you also have to click on a specific retracement level before the extension levels automatically pop out.
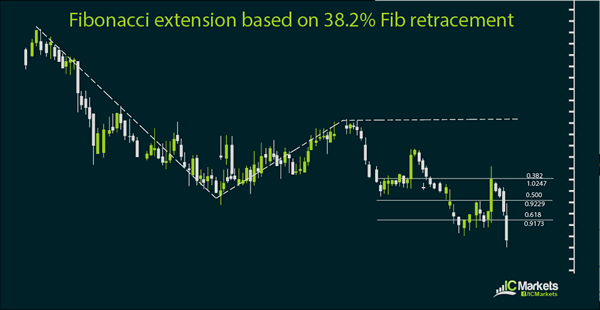
As you've probably surmised, the Fibonacci extension levels vary depending on which retracement level you pick.
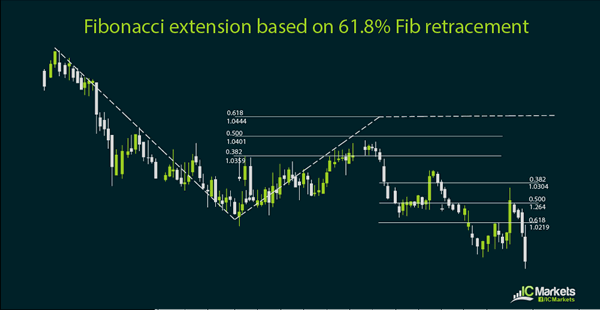
As with Fibonacci retracement levels, there is also no hard and fast rule in determining which extension level would hold best. One can make a choice depending on which level lines up with another kind of inflection point, such psychological levels or pivot points. The intersection of a trend channel with a Fibonacci extension level could also be a take-profit point.
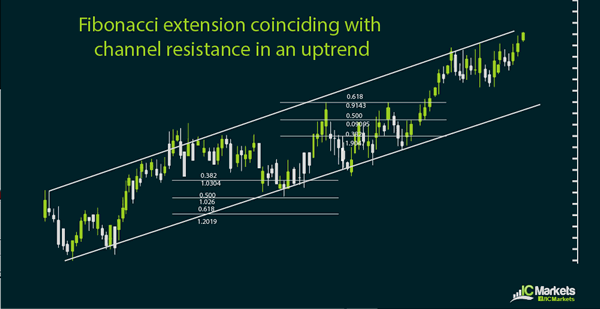
Reversal candlesticks forming right on a Fibonacci extension level could also be a good signal to exit a trade.
Extension levels are a bit trickier to use compared to retracement levels, as price often reacts to extension levels without necessarily reversing the trend afterwards. Price could retreat upon testing an extension level but resume the overall trend later on.
More cautious traders tend to set their profit targets at the 1.000 Fibonacci extension, which is basically the latest high or low in price action. Others favor the extension level that is equal to the retracement level. For many traders, setting definite trade rules like these remove the emotional or subjective component in coming up with trade ideas.
Despite that, the use of Fibonacci extension is common among technical traders, particularly those who also watch Elliott Wave patterns or harmonic price patterns.
10 – Fibonacci Retracement
Fibonacci retracement levels, which are commonly used to specify potential entry levels during a trending market environment, comprise another group of inflection points. These retracement levels were based the work of Leonardo Fibonacci, who is a famous mathematician known for his discovery of the golden ratio.
According to Fibonacci, this ratio describes the natural proportion of various things, from the spirals of a seashell to the high-probability forex trend retracements. When it comes to trading, the important Fibonacci retracement levels to note are the 0.236, 0.382, 0.500, and 0.618 ratios.
There is no need to memorize these figures as most forex trading platforms or charting software already include the Fibonacci retracement tool. All you need to do is to connect the latest swing low to swing high in an uptrend or the latest swing high to swing low in a downtrend, and the Fibonacci retracement levels will automatically be generated.
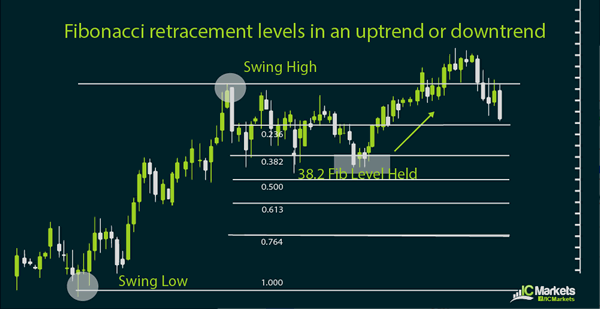
What's important to note when using this tool is how to connect the proper swing highs and lows. A good rule of thumb to determine a swing high is to look at the highest point of the trend with the previous two candles closing below it and the next two candles also closing below it. For the swing low, this is the lowest point of the trend with the previous two candles closing above it and the next two candles also closing above it.
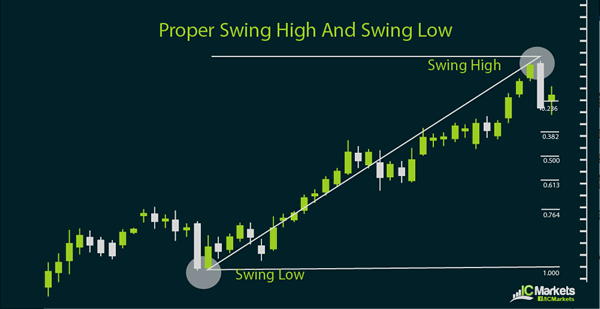
Another rule of thumb is to go from left to right. In an uptrend, you should be going from the swing low to the swing high in later price action. For a downtrend, you should be connecting the swing high to the swing low in later price action.
Now, once the Fibonacci retracement levels are generated, how do you decide where to set your entry orders? One way to go about it would be to pick the level that lines up with the most inflection points, such as the pivot points or psychological levels.
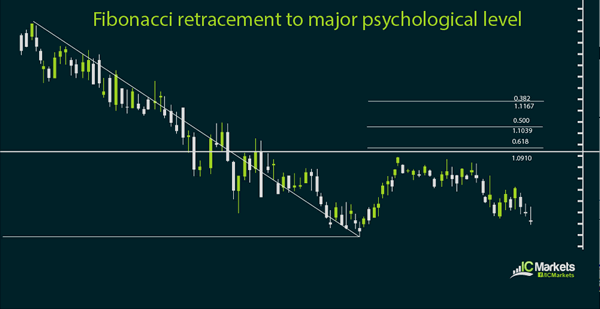
Another way would be to select the level that coincides with a prevailing trend line. Other traders pick their entry point when reversal candlesticks have formed and they decide to enter their trades at market.
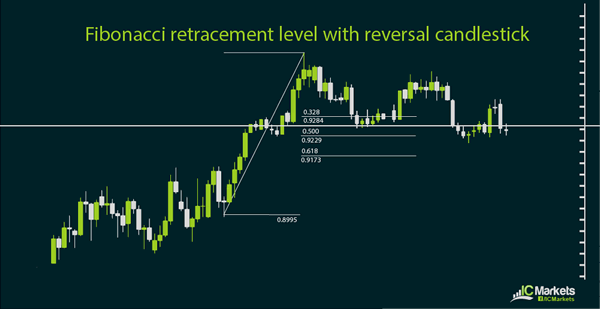
There is no hard and fast rule to pinpoint exactly which Fibonacci level is most likely to hold as support or resistance. A good grasp of market psychology, fundamentals, and other technical factors could guide you in your technical analysis, but this kind of understanding is developed with enough practice and screen time.
As for setting profit levels, another kind of Fibonacci levels comes in handy. These are known as Fibonacci extensions and are covered in the next section.
09 – Different Types of Inflection Points
There are several types of horizontal inflection points that can be employed in forex technical analysis. Among these, the most common ones are the psychological round numbers, which tend to hold well as support or resistance for major currency pairs and yen pairs.
Major psychological levels refer to price levels ending in 00, such as 1.3400 for EUR/USD or 95.00 for USD/JPY. Generally speaking, the more zeroes at the end of the price level tends to result in a stronger inflection point. For instance, 100.00 holds as a strong support or resistance level for USD/JPY while parity or 1.0000 tends to elicit a bounce from AUD/USD or USD/CAD.
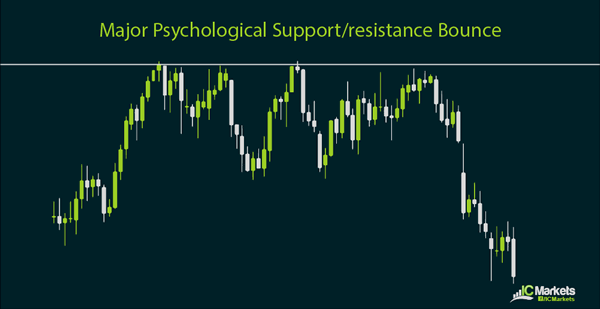
Minor psychological levels are those that end in 50, such as 1.6550 for GBP/USD or 171.50 for GBP/JPY. These tend to hold as intraday support or resistance, particularly when they line up with other kinds of inflection points and create what traders typically call a confluence.
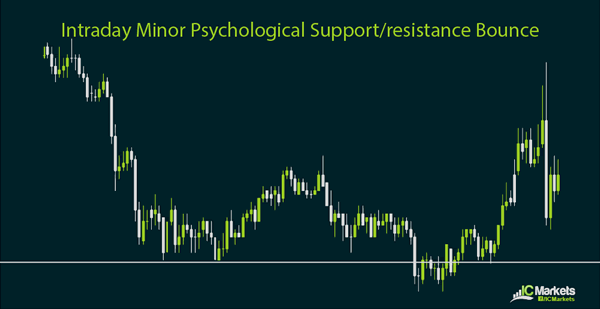
Other kinds of intraday inflection points include the previous day high, low, open and close. The previous day high is usually treated as a resistance level for potential rallies, with an upside break acting as a signal that further gains are in the cards. The previous day low is usually considered a support level for potential price declines, with a downside break acting as a signal that further losses might take place.
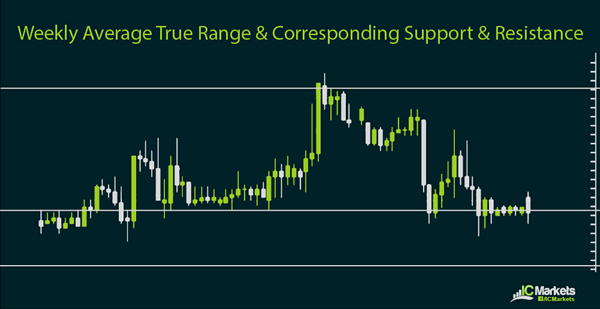
Average true ranges are also used in determining intraday inflection points, particularly among day traders or scalpers. The top and bottom daily average true range or ATR is calculated based on the average price movement per day for a specified number of days to be set by the trader. These usually act as support and resistance for the day, where price is expected to turn. A break above or below these levels could be indicative of stronger rallies or selloffs.
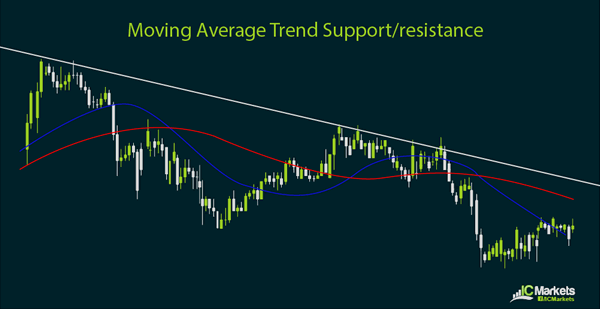
As mentioned in the previous section, technical indicators such as moving averages can also be treated as support and resistance. In particular, the 200 SMA or simple moving average on the daily time frame is usually considered support or resistance, depending on how the trend is going. During an uptrend, price is expected to bounce off the 200 SMA while a market downtrend could see the price bounce below the 200 SMA.
Bollinger bands can also serve as dynamic inflection points, with the upper band serving as resistance and the lower band acting as support. Just as with other types of inflection points, a break above the resistance could be a signal for more gains while a break below the support could indicate further losses.
Trend lines, uptrend and downtrend channels, as well as pivot points can also serve as support and resistance. These inflection points are determined mostly based on past price action, with trend lines and channels created by connecting the recent highs and/or lows of price action and pivot points calculated using formulas incorporating the open, high, low, and close for the previous period. Details for these kinds of inflection points are covered in the next sections.
08 – Pivot Point Calculation Methods
Pivot point calculation can be tedious for some but there are traders that find this method very reliable when coming up with shorter-term trade setups. Trading the news or economic events can also be combined with intraday setups using pivot points.
In particular, range traders look at pivot points for potential reversals in price action. Trend traders watch breakouts from pivot points to see if further gains or losses are about to take place.
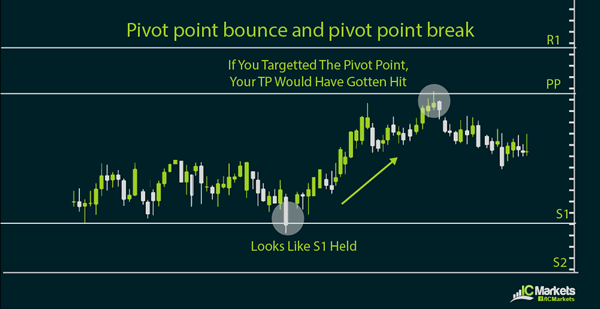
Pivot point formulas generate support and resistance levels, along with the pivot point for the day. The basic formula derives the pivot point by getting the average of the previous high, low, and close.
From there, the first support level is calculated by multiplying the pivot point by two then subtracting the previous high. The first resistance level is calculated by multiplying the pivot point by two then subtracting the previous low.
The second support level is calculated by adding the pivot point to the difference of the previous high and low. The second resistance level is calculated by subtracting the difference of the previous high and low from the pivot point.
Charting software and most trading platforms usually have these pivot point calculators or tools that can automatically generate these inflection points so there is no need to memorize the formulas. However, it's important to have an idea of how these levels are generated in order to better take advantage of the potential trading methods using these tools.
Other pivot point calculation methods exist and might be more effective means of determining inflection points, depending on your trading method. For instance, there's the Woodie pivot point method which generates very different support and resistance levels from the basic one.
Another kind of pivot point calculation is the Camarilla equation, which can generate as much as four support and resistance levels. Fibonacci pivot point methods are also an option, possibly when a trader is looking to combine these levels with Fibonacci retracement or extension points during a market trend.
There is no saying which among these methods is the best one, as it varies depending on market conditions or how these inflection points are incorporated in one's trading strategy. What is important is that the trader has a clear understanding of how the support and resistance levels are generated in order to figure out if it is an appropriate trading method.
The simplicity and objectivity of pivot points makes it one of the most watched levels among forex traders, giving the inflection points a self-fulfilling trait. Buy or sell orders could be located around pivot points, especially when these line up with major or minor psychological levels.
In addition, the flexibility of using pivot points as levels to watch for range and trend traders makes it more appealing to use. The convenience of having pivot point calculators also makes for an easy-to-use trading method.