
Sample Category Title
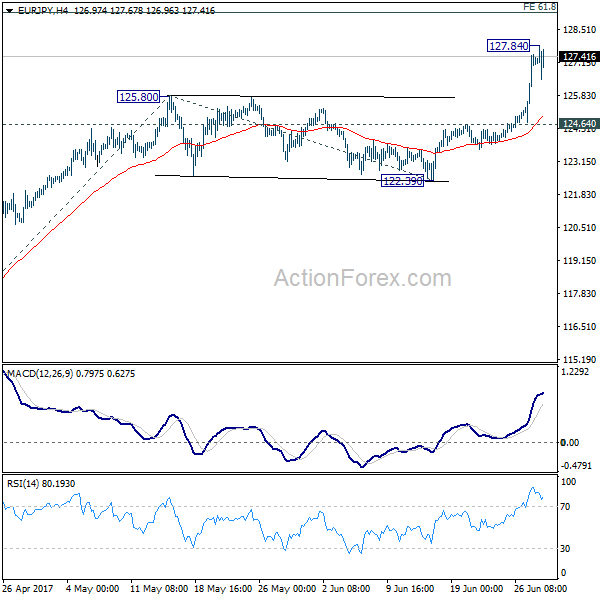
EUR/JPY Mid-Day Outlook
Daily Pivots: (S1) 125.58; (P) 126.52; (R1) 128.32; More...
EUR/JPY retreats after hitting 127.84. A temporary top is likely formed and intraday bias is turned neutral first. Downside of consolidation should be contained by 124.64 support to bring another rally. Above 127.84 will extend the rise from 114.84 to 61.8% projection of 114.84 to 125.80 from 122.39 at 129.16 first. That's also close to medium term projection level at 129.89.
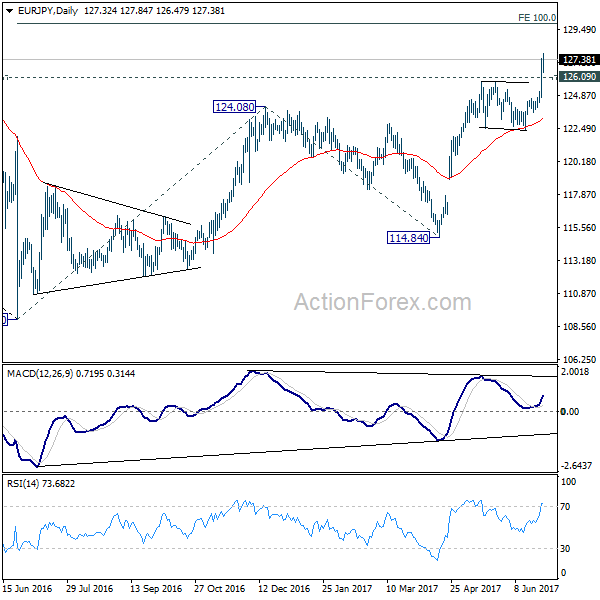
In the bigger picture, the break of 126.09 support turned resistance should have confirmed completion of down trend form 149.76 (2014 high), at 109.03 (2016 low). Current rise from 109.03 should target 100% projection of 109.03 to 124.08 from 114.84 at 129.89 first. Break there will pave the way to 61.8% retracement of 149.76 to 109.03 at 134.20 and above. Medium term outlook will now remain bullish as long as 122.39 support holds.
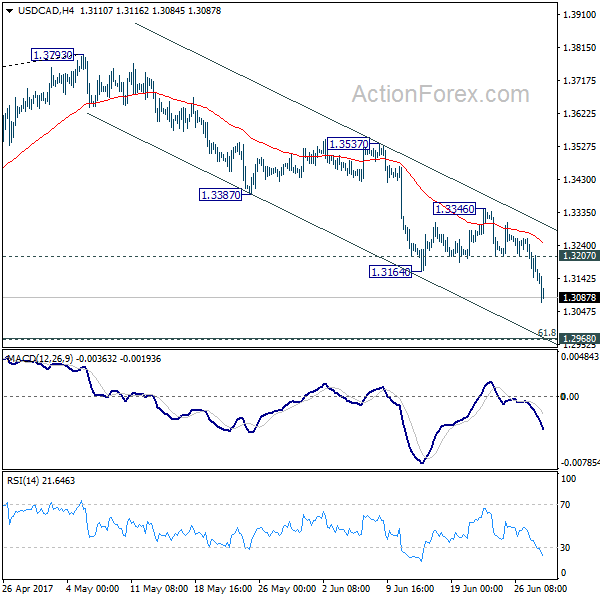
USD/CAD Mid-Day Outlook
Daily Pivots: (S1) 1.3143; (P) 1.3202; (R1) 1.3256; More....
USD/CAD's fall extends to as low as 1.3075 so far today. Intraday bias remains on the downside for 1.2968 cluster support, 61.8% retracement of 1.2460 to 1.3793 at 1.2969. Decisive break there will confirm our bearish view that whole corrective rise from 1.2460 has completed at 1.3793. On the upside, above 1.3207 minor resistance will turn bias neutral and bring recovery. But break of 1.3346 resistance is needed to indicate short term bottoming. Otherwise, outlook will remain bearish.
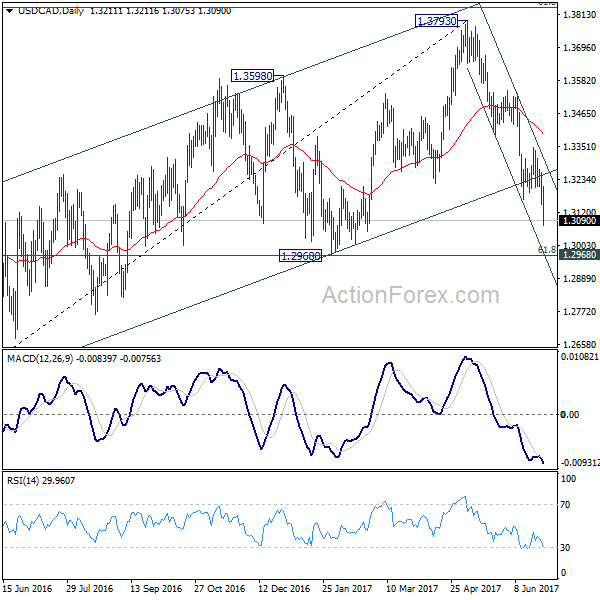
In the bigger picture, price actions from 1.4689 medium term top are seen as a correction pattern. The first leg has completed at 1.2460. Rise from 1.2460 is seen as the second leg and has completed at 1.3793, ahead of 61.8% retracement of 1.4689 to 1.2460 at 1.3838. Break of 1.3222 should now indicate the start of the third leg while further break of 1.2968 should confirm. In that case, USD/CAD should decline through 1.2460 support to 50% retracement of 0.9406 to 1.4869 at 1.2048.
USD/JPY Mid-Day Outlook
Daily Pivots: (S1) 111.71; (P) 112.09; (R1) 112.71; More...
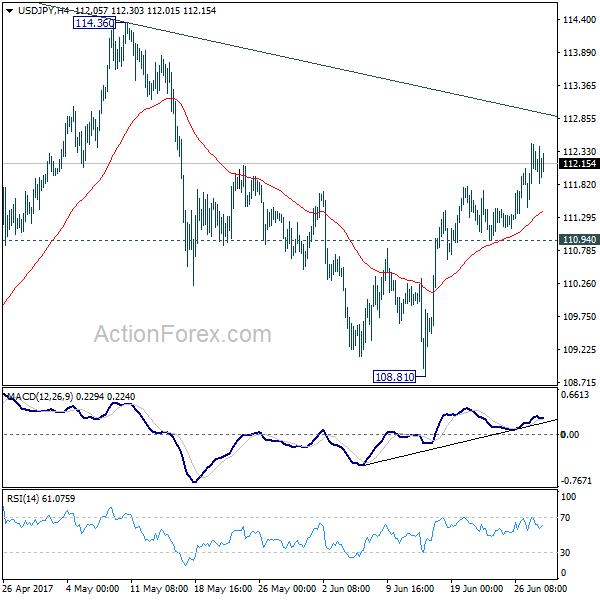
Intraday bias in USD/JPY remains on the upside as rise from 108.81 is in progress for channel resistance (now at 112.89). Sustained break there will suggest that whole pull back from 118.65 has completed at 108.12 already. In such case, further rise should be seen to 114.36 resistance for confirmation. On the downside, however, break of 110.94 support will argue that rebound from 108.81 has completed and turn bias back to the downside.
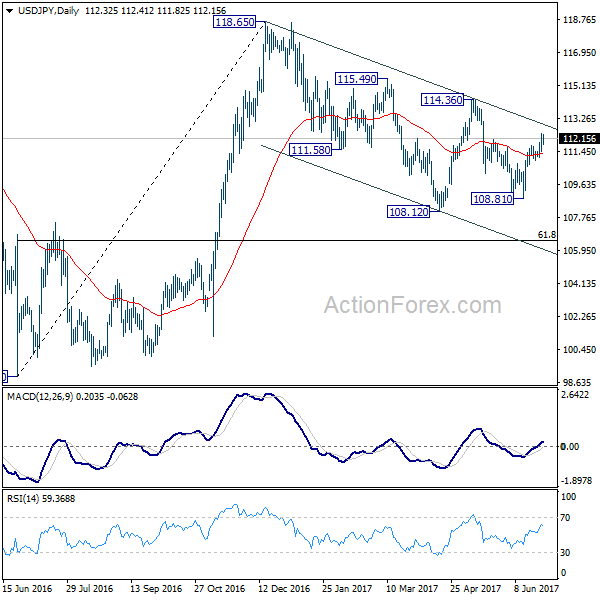
In the bigger picture, price actions from 125.85 high are seen as a corrective pattern. It's uncertain whether it's completed yet. But in case of another fall, downside should be contained by 61.8% retracement of 75.56 to 125.85 at 94.77 to bring rebound. Overall, rise from 75.56 is still expected to resume later after the correction from 125.85 completes.
USD/CHF Mid-Day Outlook
Daily Pivots: (S1) 0.9552; (P) 0.9643; (R1) 0.9693; More.....
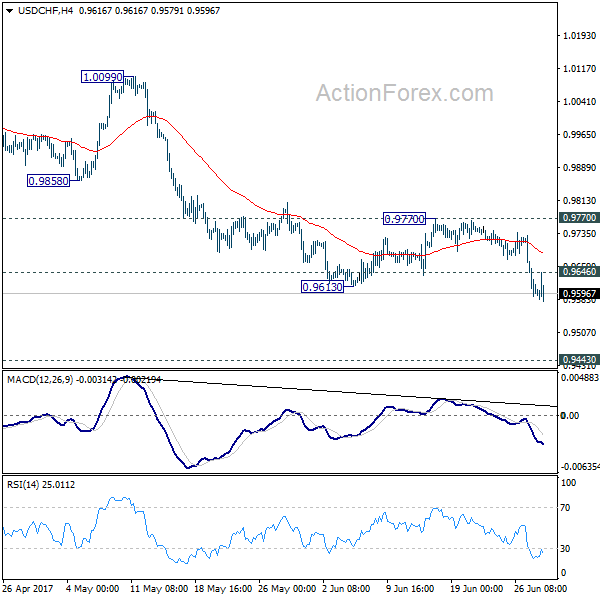
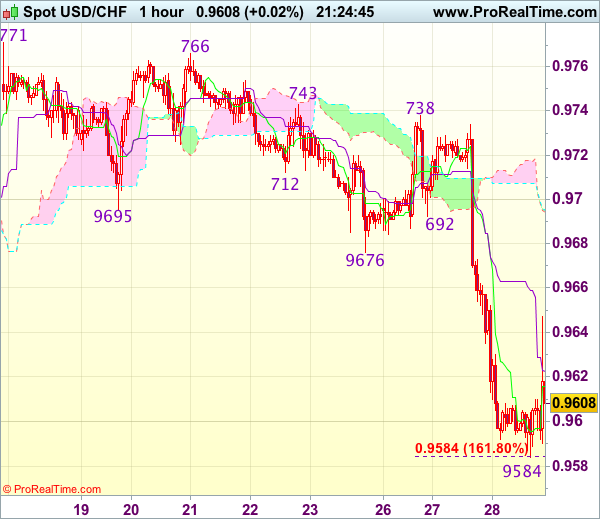
Intraday bias in USD/CHF remains on the downside for the moment. Current decline is part of the whole fall from 1.0342 and should target 0.9548 support and below. We'd start to look for bottoming signal again as it approaches 0.9443 key support level. On the upside, above 0.9646 minor resistance will turn bias neutral and bring recovery. But still, break of 0.9770 resistance is ended to indicate short term bottoming. Otherwise, outlook will remain bearish.
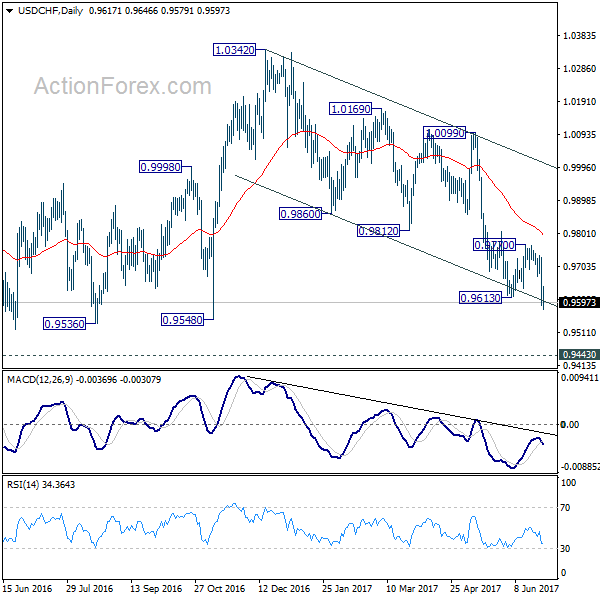
In the bigger picture, USD/CHF is still bounded in medium term range of 0.9443/1.0342 for the moment. Consolidative trading would likely continue and medium term outlook remains neutral. Break of 1.0342 key resistance is needed to confirm underlying bullish momentum in the pair. Meanwhile, downside attempts should be contained by 0.9443 key support level. However, sustained break of 0.9443 will carry larger bearish implication and target 0.9 handle.
Trade Idea Update: USD/CHF – Sell at 0.9645
USD/CHF - 0.9598
Original strategy :
Sell at 0.9660, Target: 0.9550, Stop: 0.9695
Position : -
Target : -
Stop : -
New strategy :
Sell at 0.9645, Target: 0.9545, Stop: 0.9680
Position : -
Target : -
Stop : -
The greenback has remained under pressure after yesterday’s selloff below previous chart support at 0.9613, adding credence to our bearish view that the decline from 0.9771 top is still in progress and downside bias remains for further weakness towards 0.9550, however, reckon downside would be limited to 0.9525-30 (50% projection of 1.10100-0.9613 measuring from 0.9771) and 0.9500 should hold, price should stay above 0.9470 (61.8% projection), bring rebound later.
In view of this, would not chase this fall here and we are looking to sell dollar on recovery as previous support at 0.9676 should turn into resistance and limit dollar’s upside, bring another decline. Above another previous support at 0.9692 would defer and risk a stronger rebound to 0.9715-20 but only break of resistance at 0.9738-43 would signal low is formed.
Trade Idea Update: GBP/USD – Buy here
GBP/USD - 1.2845
Original strategy :
Buy at 1.2780, Target: 1.2880, Stop: 1.2745
Position : -
Target : -
Stop : -
New strategy :
Buy at market level, Target: 1.2945, Stop: 1.2810
Position : -
Target : -
Stop : -
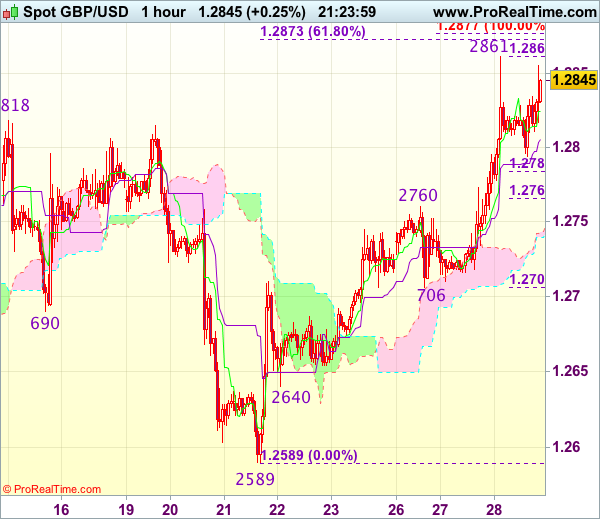
As cable has rebounded again after finding renewed buying interest just below 1.2800 level, suggesting recent upmove from 1.2589 low is still in progress and may extend further gain to 1.2915-20 (1.236 times projection of 1.2589-1.2760 measuring from 1.2706), then towards 1.2945-50, however, reckon upside would be limited to 1.2978-83 (previous resistance and 1.618 times projection) and price should falter below psychological resistance at 1.3000, bring retreat later.
In view of this, we would buy cable here and exit on such rise. Below 1.2794 support would abort and signal an intra-day top is formed instead, risk weakness to 1.2760 (previous resistance turned support), then 1.2740 but price should stay well above 1.2706 support,.
GBP/USD Mid-Day Outlook
Daily Pivots: (S1) 1.2731; (P) 1.2796; (R1) 1.2876; More...
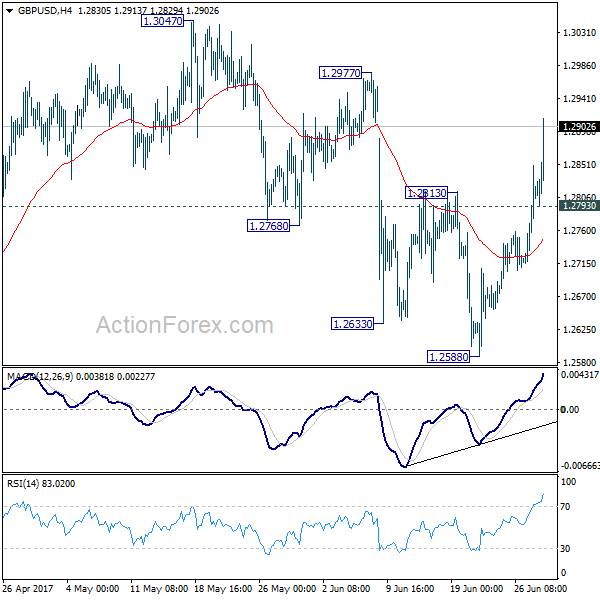
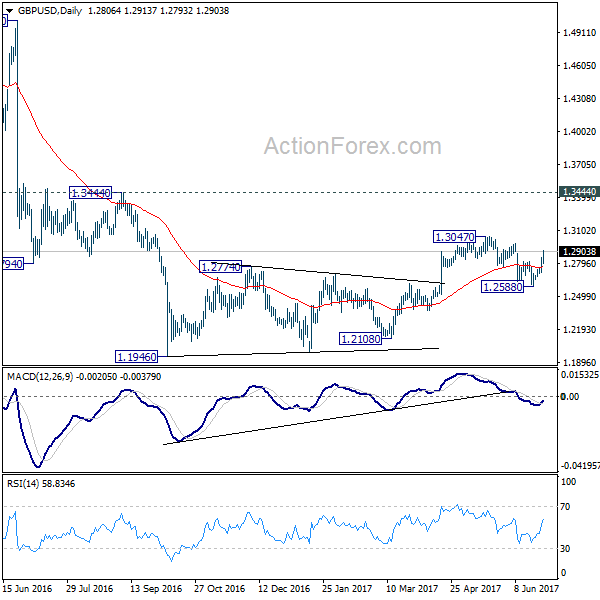
GBP/USD's rally accelerates to as high as 1.2911 so far today and intraday bias remains on the upside. Pull back from 1.3047 should have completed at 1.2588 already. Rise from there should now target 1.2977 resistance first. Break there will likely extend the larger rise through 1.3047 resistance. On the downside, below 1.2793 minor support will turn bias neutral first and bring retreat.
In the bigger picture, overall, price actions from 1.1946 medium term low are seen as a corrective pattern. Pull back from 1.3047 has completed after failing to sustain below 1.2614 resistance turned support. It argues that the corrective pattern from 1.1946 is still in progress for another high above 1.3047. But still, outlook remains bearish as long as 1.3444 key resistance holds. Larger down trend from 1.7190 is expected to resume later after the correction completes.
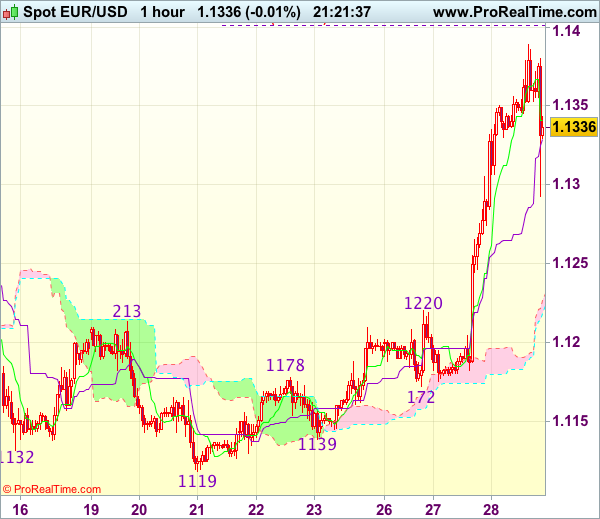
Trade Idea Update: EUR/USD – Buy at 1.1280
EUR/USD - 1.1335
Original strategy :
Buy at 1.1280, Target: 1.1395, Stop: 1.1245
Position : -
Target : -
Stop : -
New strategy :
Buy at 1.1280, Target: 1.1395, Stop: 1.1245
Position : -
Target : -
Stop : -
The single currency has retreated after rising to 1.1389, suggesting consolidation below this level would be seen and pullback to 1.1280-85 (50% Fibonacci retracement of 1.1172-1.1389) cannot be ruled out, however, reckon 1.1255 (61.8% Fibonacci retracement) would hold and bring another rise later, above said resistance at 1.1389 would extend recent upmove 1.1400-05 (61.8% projection of 1.0839-1.1296 measuring from 1.1119), then towards 1.1430 but overbought condition should prevent sharp move beyond 1.1450-60 and price should falter below 1.1500.
In view of this, would not chase this rise here and would be prudent to buy euro on pullback as 1.1280-85 should limit downside. Below 1.1245-50 would defer and risk test of previous resistance at 1.1220 but break there is needed to confirm top is formed instead, bring correction towards 1.1180-85 later.
Trade Idea Update: USD/JPY – Buy at 111.80
USD/JPY - 112.16
Original strategy :
Buy at 111.80, Target: 112.80, Stop: 111.45
Position : -
Target : -
Stop : -
New strategy :
Buy at 111.80, Target: 112.80, Stop: 111.45
Position : -
Target : -
Stop : -
The greenback has maintained a firm undertone after this week’s rally on active cross-selling in yen, adding credence to our bullishness and signal the rise from 108.82 low is still in progress, hence further gain to 112.75–80 (61.8% projection of 108.82-111.79 measuring from 110.95) would be seen, however, loss of momentum should limit upside and price should falter below 113.00-10 today, risk from there is seen for a retreat later.
In view of this, would not chase this rise here and we are looking to buy dollar on pullback but at a higher level as 111.80 should limit downside. Below minor support at 111.46 would defer and suggest top is possibly formed, risk weakness to 111.10-15, break there would confirm, then test of support at 110.95 would follow.

CAC Ticks Lower, Investors Look for Cues
The CAC index is showing little movement in the Wednesday session. Currently, the index is down 0.07% and is trading at 5264.00. ECB President Mario Draghi will address the ECB Forum of Central Bankers. Will Draghi perform an encore and push the euro even higher? On Thursday, the US will publish Final GDP.
The markets continue to keep an eye on Sintra, Portugal, which is hosting the ECB Forum. On Tuesday, Mario Draghi was upbeat about economic conditions in the eurozone, and the euro responded with sharp gains, although the CAC lost ground. Draghi acknowledged that economic indicators continued to point to a broadening recovery in the eurozone, but pointed to inflation as the barrier to tightening policy. Draghi defended the bank's loose accommodative policy, saying that it had pushed inflation higher, but stimulus was needed until inflation becomes "durable and self-sustaining".
The election of Emmanuel Macron as president has revived morale in the country, as the young and charismatic Macron appears determined to bring major changes to France. This sense of optimism was underscored by the latest INSEE consumer confidence report, which jumped to 108 points in the June report, up from 103 in May. This marked the highest level since 2007. Although consumers are in a good mood, this optimism has so far not translated into stronger consumer spending, but nevertheless is another sign that the French economy is improving. INSEE has revised upwards its estimate for France's GDP for the first quarter to 0.5%, up from 0.4% earlier in June.
Investors are anxiously awaiting a key report card for the US economy, with the release of Final GDP on Thursday. Preliminary GDP, which was released in May, came in at 1.2%, and this is the same estimate for the upcoming GDP report. Recent economic data has been softer than expected, notably construction and manufacturing reports. US durable goods releases were weak in May. Core Durable Goods broke a streak of two straight declines, but the weak gain of 0.1% missed expectations. Durable Goods declined 1.1%, its sharpest decline since June 2016. The slowdown in orders of business equipment could weigh on second quarter growth. Last week, it was the turn of construction numbers to disappoint, as Housing Starts and Building Permits both missed expectations. Consumer spending has also been softer than expected, and if Final GDP falls short of the modest estimate of 1.2%, the dollar could respond with losses.