
Sample Category Title
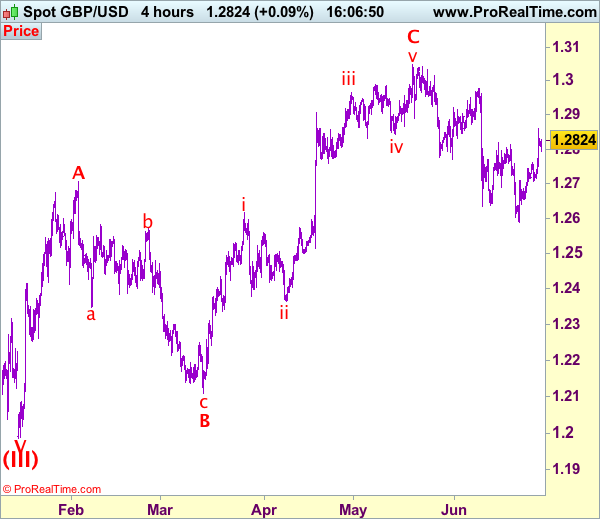
GBP/USD Analysis: Mildly Bearish On Wednesday
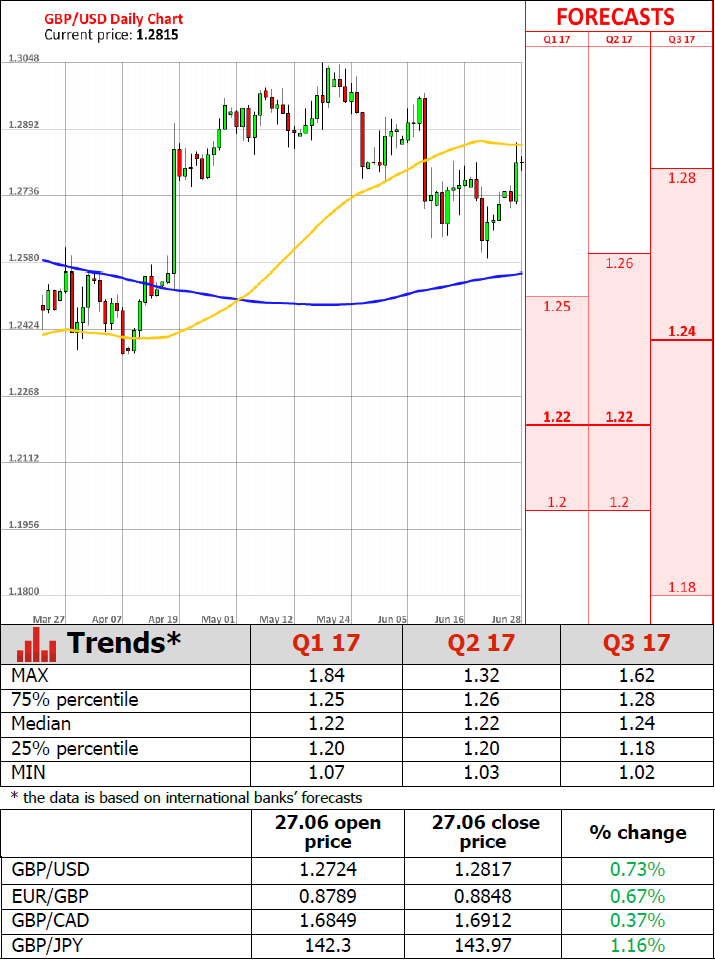
The US Dollar's continuous weakness resulted in GBP/USD surging up to a three-week high at 1.2828 on Tuesday. Subsequently, the price was not able to overcome the 1.2820 mark and has since traded below the given level. Daily trading indicators signal that there is still some upside potential up to the monthly PP at 1.2903. However, the rate's minor motion sideways indicates that bears may prevail in this session. In addition, a retracement from the upper channel boundary is still expected. Nevertheless, this scenario might occur only within the following two days if strong downside risks do not set the British currency for a plunge. A more likely lower limit for this session might be the 38.2% Fibo or the monthly S1 at 1.2770 and 1.2758, accordingly.
EUR/USD Analysis: Jumps Above 1.13 Mark
Just like recently all the patterns on gold were broken, everything previously created is now irrelevant on the EUR/USD charts. The reason for that are massive fundamental changes in the Euro. During yesterday's speech the President of the European Central Bank Mario Draghi made an important announcement. The ECB is set to stop its monetary easing policies, which means that there will be less Euros in circulation. Subsequently that has caused the price of the Euro to skyrocket. The future outlook of the pair is set to be dictated by details of the stimulus cutting. However, some guidance for the short term can be taken from the technical levels. It can be seen that the previously active long term pattern's upper trend line is now providing support. That and the fundamental situation indicate at a surge.
Technical Outlook: EURJPY May Extend Rally Towards Fibo 61.8% Barrier At 128.91
The cross ticked higher on Wednesday and posted fresh high at 127.85 (the highest since 01 Apr 2016) in extension of Tuesday’s strong rally (the biggest one-day rally this year) when the price was up 1.88%.
Break above 125.81 (14 May former high) generated bullish signal for extension of bull-leg from 114.84 (16 Apr trough) towards next barrier at 128.91 (Fibo 61.8% of 140.99/109.38 (June 2015/June 2016 descend).
Overbought daily RSI / slow stochastic suggest corrective easing which should be ideally contained by previous high rising daily Tenkan-sen at 125.80/68 zone.
Res: 127.85, 128.91, 129.56, 130.00
Sup: 127.06, 126.67, 125.81, 125.68
EUR/CHF Elliott Wave Analysis
EUR/CHF : 1.0913
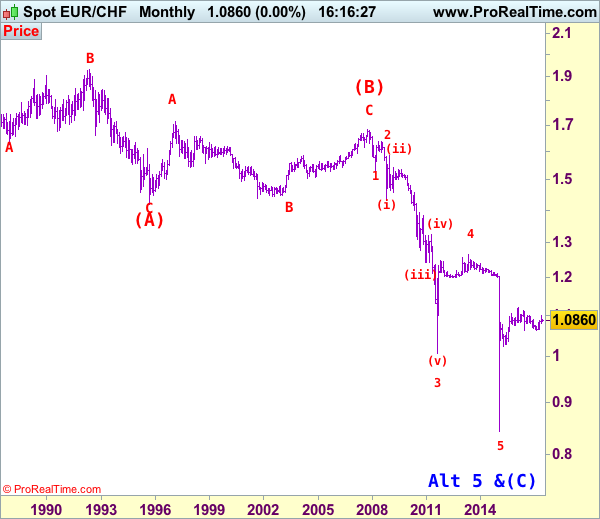
EUR/CHF: Major wave 5 trough ended at 0.8426 and correction has commenced from there for subsequent gain towards 1.1400-1.1500.
Although the single currency fell marginally to 1.0833 last week, euro found good support there and has staged another rebound, retaining our bullish view and consolidation with upside bias remains for test of resistance at 1.0910, break there would signal low is formed, bring test of 1.0949 resistance, only a daily close above there would signal the pullback from 1.0988 has ended and bring retest of this level. Looking ahead, above said resistance at 1.0988 would confirm recent rise has resumed and extend further gain to another previous resistance at 1.1001, break there would signal the upmove from 1.0622 low (2016 low) is still in progress for headway to 1.1018, then 1.1050 but reckon resistance at 1.1107 would limit upside and price should falter well below 2016 high at 1.1129.
To recap our preferred count, the decline from 1.6828 (end wave (B)) is labeled as the beginning of wave (C) which should unfold as an impulsive move with 1: 1.5326, 2: 1.6377 and wave 3 is sub-divided into (i): 1.4300, (ii): 1.5880 and wave (iii) is still unfolding with (1): 1.4577, (2): 1.5448 and wave (3) is an extended 3rd with i: 1.5006, ii: 1.5383, wave iii: 1.3073, then wave iv ended at 1.3925 and wave v at 1.3073, wave (4) ended at 1.3925 and wave (5) has ended at 1.2765 which also marked the low of wave (iii) and wave (iv) has ended at 1.3835 and wave (v) as well as larger degree wave 3 has ended at 1.0075. The selloff from 1.2650 signals wave 4 has ended there and we are taking a view that the wave 5 could also have ended 0.8426, hence consolidation is seen with mild upside bias for rebound to 1.1000 first, then towards 1.1400.
On the downside, below said support at 1.0833 would risk weakness to previous support at 1.0792, however, a daily close below this level is needed to signal recent rise has ended and extend the fall from 1.0988 towards previous minor resistance at 1.0720. Looking ahead, only a drop below 1.0720 would suggest top is formed instead, risk weakness towards said support at 1.0656 first.
Recommendation: Hold long entered at 1.0905 for 1.1105 with stop below 1.0805.
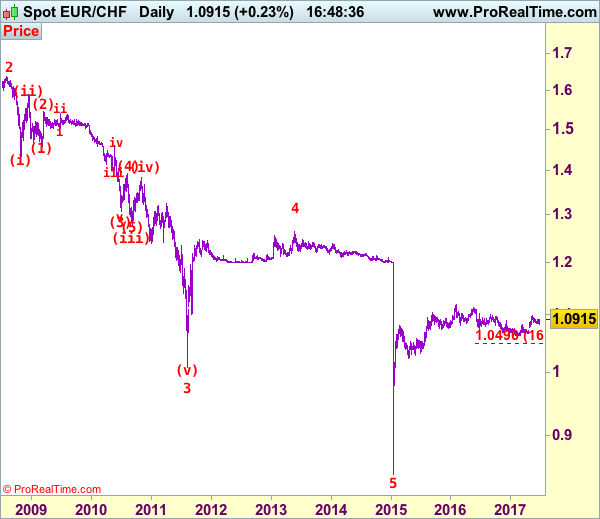
The long-term downtrend started from 1.9626 (Apr 1985) to 1.4166 (Sep 1995) is treated as wave (A) with A:1.6285 (Dec 1987), B: 1.9342 (May 1992) and C: 1.4166, then wave (B) ended at 1.6828 with A: 1.7147 (Feb 1997), B: 1.4398 (Sep 2001), C: 1.6828 (Nov 2007), therefore, wave (C) is now in progress with the breakdown indicated as above. This wave (C) already met indicated downside target at 1.1455/60 and 1.1300, it could have ended at 0.8426, consolidation with mild upside bias is seen for gain to 1.1000 and later towards 1.2000.
Bank Of England To Tighten Credit Rules
'Tightening consumer lending will always have an adverse effect on business and British Plc won't be reassured by any of the measures in today's report.' — Angus Dent, ArchOver
The Bank of England Governor Mark Carney held a press conference about the Financial Stability Report in London on Tuesday. Carney said that the Financial Policy Committee would increase the countercyclical capital buffer rate to 0.5% from 0%. Apart from that, the FPC expects to raise the rate to 1% at its November meeting. The Bank acknowledged the UK'[s economic performance had been markedly stronger than its gloomy predictions. However, the BoE noted that risk levels had been varying from sector to sector and remained quite high in the consumer credit market. Carney said that consumers should carefully identify the rationale for purchasing property or investing in a business. Starting from July, the BoE will start tightening rules on unsecured lending in order to slow lending growth among people who are unable to meet loan obligations. Furthermore, the Bank pointed to the high private-sector borrowing in China, which can potentially cause problems to British banks. Policymakers cited the country's exit from the EU as a risk to the economy, adding that the Bank was preparing for all scenarios post-Brexit.
American Consumer Morale Improves Unexpectedly In June
'Overall, consumers anticipate the economy will continue expanding in the months ahead, but they do not foresee the pace of growth accelerating.' — Lynn Franco, Conference Board
The mood of American shoppers rose unexpectedly this month, hitting a 16-year high. The Conference Board reported on Tuesday that its Consumer Confidence Index climbed to 118.9 in June, up from the preceding month's 117.6 points, while analysts anticipated a slight drop to 116.1 during the reported month. The share of respondents who perceived business conditions as 'good' advanced to 30.8% from the prior month's 29.8%, whereas the share of those who perceived business conditions as 'bad' dropped to 12.7%, down from May's 13.9%. Furthermore, 32.8% of respondents said that jobs were 'plentiful', compared to the previous month's 30%. Meanwhile, 18% said that jobs were 'hard to get', down from the previous month's 18.3%. As to the short-term outlook, the share of those expecting to improve over the next six months fell to 20.4% from 21.5%. Nevertheless, the share of respondents expecting future business conditions to worsen declined to 9.9% in June from 10.3%. Tuesday's data suggested that household consumption growth would likely accelerate in the upcoming months.
AUD/USD Elliott Wave Analysis
AUD/USD – 0.7599
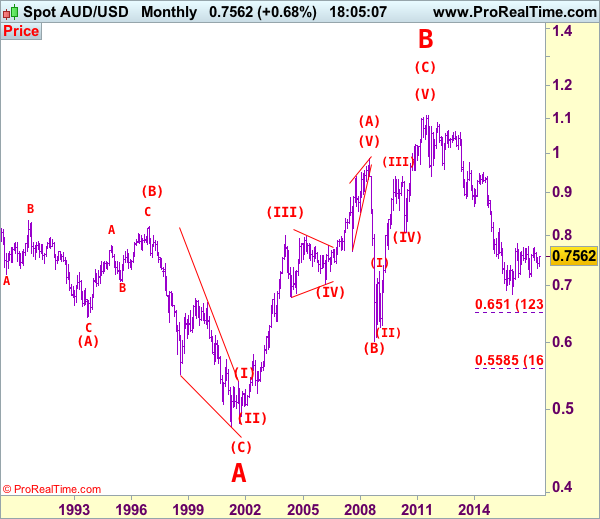
AUD/USD – Wave 5 of C and (B) has possibly ended at 1.1081
Although aussie found support at 0.7535 and staged a strong rebound, break of resistance at 0.7636 is needed to signal the rise from 0.7329 has resumed and extend further gain to resistance at 0.7680 but a daily close above there is needed to add credence to our view that the fall from 0.7750 has ended at 0.7329, then further gain towards said resistance at 0.7750 would follow but this level is likely to hold on first testing.
We are keeping our count that top has been formed at 1.1081 (wave 5 of V) and major correction (A-B-C-X-A-B-C) has commenced, indicated downside targets at 0.7945 (61.8% Fibonacci retracement of entire rise from 0.6007-1.1081) and 0.7750 had been met and downside bias is seen for further weakness to 0.6800, then 0.6700 but reckon 0.6500 would hold from here.
Our preferred count is that the rally from 0.6007 to 0.7270 (7 Jan 2009) is marked as wave A, the retreat to 0.6248 (2 Feb 2009) is wave B and the subsequent upmove is labeled as wave C with wave (iii) and wave (iv) ended at 0.8265 and 0.7700 respectively and wave (v) as well as 3 ended at 0.9407, then wave 4 ended at 0.8066 (instead of 0.8578). The wave 5 has met our indicated projection target of 1.1060 and could ended at 1.1081, this level is now treated as the peak of wave (C) as well as larger degree wave B, hence major fall in wave C has commenced, our initial downside target at psychological support at 0.7000 has just been met and further weakness to 0.6500 would be seen later.
On the downside, if said resistance at 0.7636 continues to hold, then further consolidation would take place and another corrective fall to 0.7535 cannot be ruled out, however, reckon 0.7470 would limit downside and bring another rise later. Only below support at 0.7415 would abort and suggest top is possibly formed, bring weakness towards said strong support at 0.7372 which is likely to hold from here. Looking ahead, a break below this support is needed to signal the rebound from 0.7329 has ended and revive bearishness for retest of this level later.
Recommendation: Buy at 0.7470 for 0.7670 with stop below 0.7370.

Our alternate count on the daily chart treated the top formed in 2008 at 0.9851 could be a larger degree wave I and was followed by a deep and sharp correction in wave II to 0.6007 and wave III is unfolding from there.
The long-term uptrend started from 0.4775 (2 Apr 2001) with an impulsive structure. Wave I is labeled as 0.4775 to 0.9851 (15 Jul 2008), wave II has ended at 0.6007 (Oct 2008) and wave III is still in progress which may extend further gain to 1.1265.
Daily Technical Analysis: EURUSD, GBPUSD, USDJPY, USDCHF
EURUSD
The EURUSD had a significant bullish momentum yesterday broke above 1.1285 key resistance, topped at 1.1349 and hit 1.1355 earlier today in Asian session. This fact ends the bearish correction phase. The bias is bullish in nearest term testing 1.1425 area. Immediate support is seen around 1.1305 – 1.1285. A clear break back below that area could lead price to neutral zone in nearest term but as long as stay above 1.1080 key support I remain bullish and any downside pullback should be seen as a good opportunity to buy. On the upside, a clear break and daily close above 1.1425 would expose 1.1615 region.
GBPUSD
The GBPUSD had a bullish momentum yesterday topped at 1.2859 but closed a little bit lower at 1.2812. The bias is bullish in nearest term testing 1.2900 area or higher. However, we have a bearish pin bar as you can see on my H4 chart below, suggest a potential bearish view. It’s better to wait for a clear break above 1.2859 to buy this pair, targeting 1.3000 – 1.3050 region. Immediate support is seen around 1.2775. A clear break below that area could lead price to neutral zone in nearest term but would give further confirmation to the bearish pin bar scenario testing 1.2700 region. Overall I remain neutral.
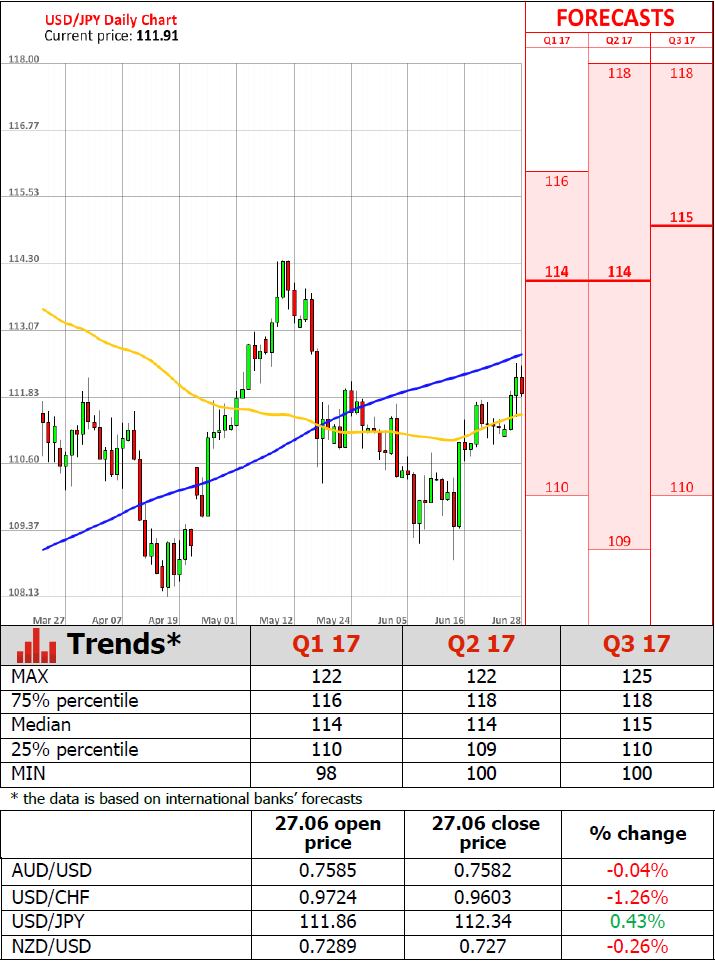
USDJPY
The USDJPY attempted to push lower yesterday bottomed at 111.46 but whipsawed to the upside and closed higher at 112.34. The bias is bullish in nearest term testing 113.00 region. Immediate support is seen around 111.78/45 area. A clear break back below that area could lead price to neutral zone in nearest term but as long as stay above 110.65 price is still in a bullish phase. On the upside, a clear break and daily close above 113.00 would expose 114.30 region. Overall I remain neutral.
USDCHF
The USDCHF had a strong bearish momentum yesterday bottomed at 0.9592. The bias is bearish in nearest term testing 0.9550 – 0.9500 region. Immediate resistance is seen around 0.9615. A clear break above that area could lead price to neutral zone in nearest term testing 0.9675 but as long as stay below 0.9765 I remain bearish and any upside pullback should be seen as a good opportunity to sell.
Trade Idea: GBP/USD – Buy at 1.2760
GBP/USD – 1.2817
Recent wave: Wave V of larger degree wave (III) has ended at 1.1986 and major correction has commenced from there for gain to 1.3000 and 1.3140-50
Trend: Near term down
Original strategy :
Buy at 1.2660, Target: 1.2810, Stop: 1.2600
Position: -
Target: -
Stop: -
New strategy :
Buy at 1.2760, Target: 1.2910, Stop: 1.2700
Position: -
Target: -
Stop:-
As sterling has eased after surging to 1.2861, suggesting consolidation below this level would be seen and pullback to 1.2785-90 is likely, however, reckon previous resistance at 1.2760 would turn into support and limit cable’s downside, bring another rise later, above said resistance at 1.2861 would extend the rise from 1.2589 low for at least a strong retracement of recent entire decline from 1.3048 to 1.2900 and possibly towards 1.2950.
Our preferred count on the daily chart is that cable's rebound from 1.3500 (wave (A) trough) is unfolding as a wave (B) with A ended at 1.7043, followed by triangle wave B and wave C as well as wave (B) has ended at 1.7192, the subsequent selloff is the larger degree wave (C) which is still unfolding with minor wave (III) of larger degree wave 3 ended at 1.1986, hence wave (IV) correction is in progress which could either be a triangle wave (IV) of a complex formation but upside should be limited to 1.3500 and price should falter well below 1.4000, bring another decline in wave (V) of 3 for weakness to 1.1500, then 1.1200.
On the downside, expect pullback to be limited to 1.2760 (previous resistance turned support) and bring such a rise. Below support at 1.2706 would abort and signal top is formed instead, risk further fall to 1.2675 and then towards support at 1.2640 which is likely to hold from here.
Euro Maintains Strong Momentum, Dollar Pressured On Healthcare Bill
In a quiet data day for many Asian countries, the forex market continued to ride on yesterday's wave of several key events and speeches during the Asian trading session. The euro continued to build on its positive momentum against the dollar, following European Central Bank President's bullish take on the eurozone economy. The dollar had a setback against the yen amid the postponed voting on the healthcare bill in the US Senate.
The euro maintained its upward trend against the dollar, rising to the highest level in 10 months on the speech by ECB President Mario Draghi. His view that 'Deflationary forces have been replaced by reflationary ones' has helped euro/dollar rise 0.40%, to last trade at 1.1383. Stronger than expected French consumer confidence might have also helped the euro. At a 108, the confidence in June rose above the estimated level of 103 and above May's 103. In early European session, the markets will be monitoring the release of Italian core inflation for June.
As the euro was consolidating gains, the dollar index, which measures the greenback against a basket of peers, was down 0.18%, at one point hitting 96.165, its lowest intraday-quote since the pre-election period in November of last year.
Federal Reserve Chair Janet Yellen offered little support for the dollar during her speech last night. She said, 'it will be appropriate to raise interest rates very gradually', though she tried to sidestep the topic of US monetary policy. Additionally, the dollar weakened against the yen during the Asian session following the news that the voting on the US healthcare bill was postponed in the Senate. Dollar/yen was last flat on the day, trading at 112.33. US pending home sales for May will be released later in the day.
Sterling has retraced some of yesterday's gains against the dollar during the Asian trading session. Pound/dollar last traded at 1.2796.
Looking at commodities, WTI oil futures (August 2017 contract) is up slightly today, last trading at $43.87 a barrel. However, it has been pressured after a report of rising US inventories, underpinning a major concern that a three-year supply glut is far from over.
Gold has continued to rise during the Asian session, last trading at $1250.43 an ounce.
The European and the US sessions will also be dominated by another set of monetary policy speeches. ECB President and the governors of Bank of England, Bank of Canada and Bank of Japan are all expected to speak later in the day during a central bank conference in Portugal.