Sample Category Title
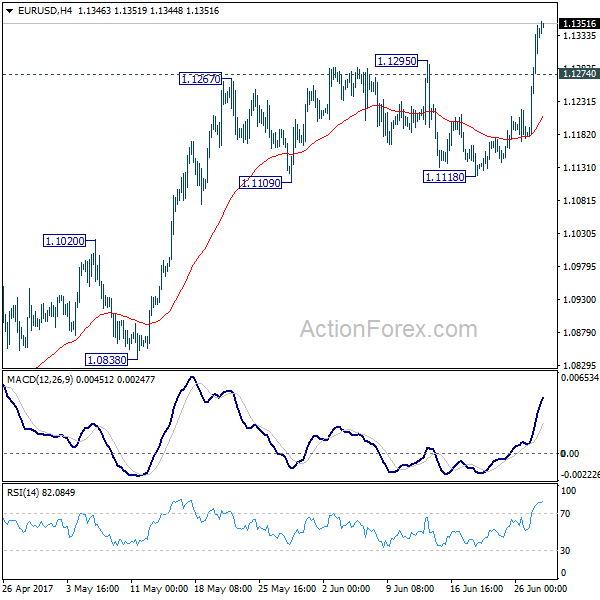
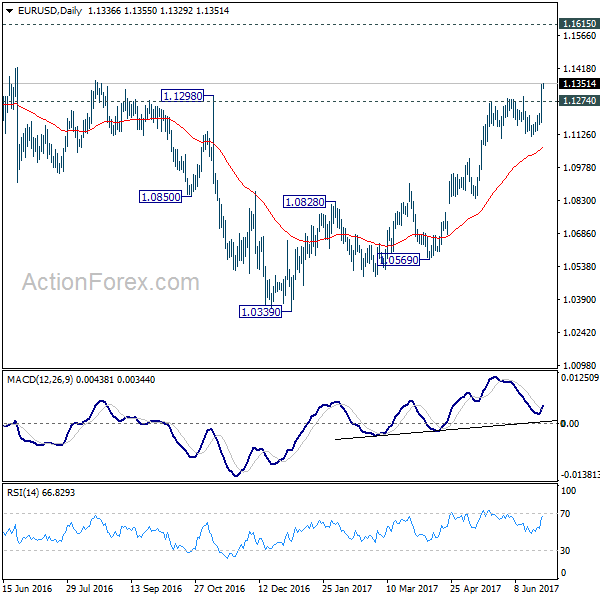
EUR/USD Daily Outlook
Daily Pivots: (S1) 1.1227; (P) 1.1288 (R1) 1.1398; More....
EUR/USD surges to as high as 1.1355 as larger rally from 1.0339 resumed. Break of 1.1298 resistance carries larger bullish implication. Intraday bias stays on the upside for 1.1615 resistance next. On the downside, below 1.1274 minor support will turn bias neutral and bring retreat. But pull back should be contained above 1.1118 support to bring rise resumption.
In the bigger picture, the break of 1.1298 resistance further affirm medium term reversal. That is an important bottom was formed at 1.0339 on bullish convergence condition is seen in weekly MACD. Further rise would be seen to 55 month EMA (now at 1.1776). Sustained break there will pave the way to 38.2% retracement of 1.6039 (2008 high) to 1.0339 (2017 low) at 1.2516 next. This will now remain the favored case as long as .1118 support holds.
GBP/USD Daily Outlook
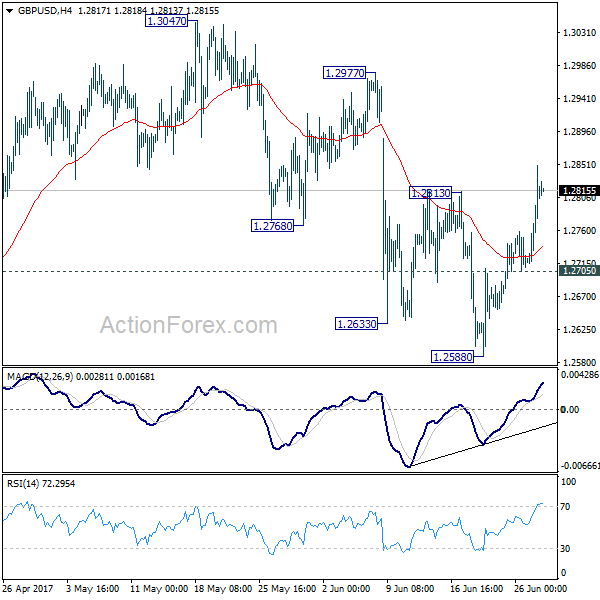
Daily Pivots: (S1) 1.2731; (P) 1.2796; (R1) 1.2876; More...
GBP/USD's rebound from 1.2588 extended higher to 1.2849 so far. Break of 1.2813 resistance argues that pull back from 1.3047 has completed at 1.2588. Intraday bias is turned back to the upside for 1.2977 resistance first. Break there will likely extend the larger rise through 1.3047 resistance. On the downside, below 1.2705 minor support will turn intraday bias back to the downside for 1.2588 instead.
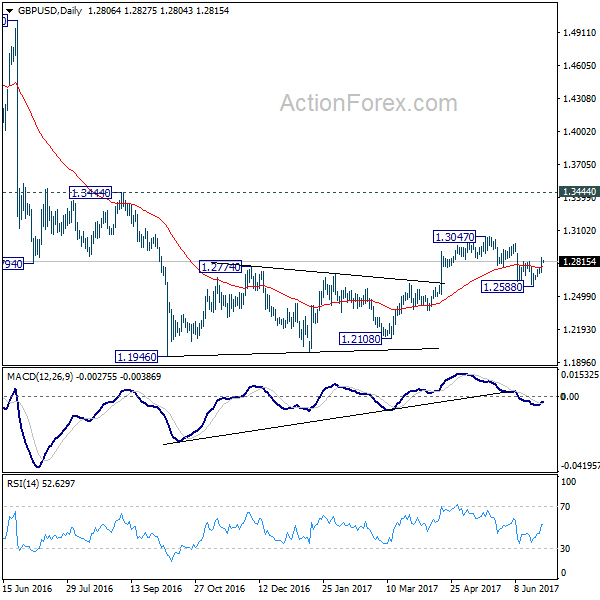
In the bigger picture, overall, price actions from 1.1946 medium term low are seen as a corrective pattern. Pull back from 1.3047 has completed after failing to sustain below 1.2614 resistance turned support. It argues that the corrective pattern from 1.1946 is still in progress for another high above 1.3047. But still, outlook remains bearish as long as 1.3444 key resistance holds. Larger down trend from 1.7190 is still expected to resume later after the correction completes.
USD/CHF Daily Outlook
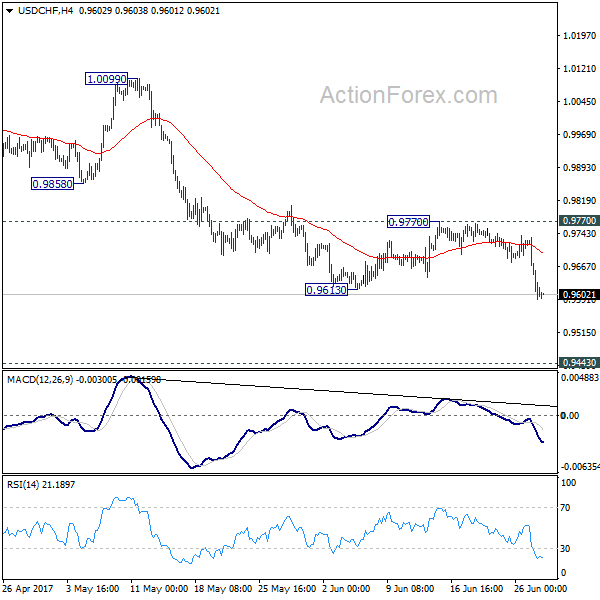
Daily Pivots: (S1) 0.9552; (P) 0.9643; (R1) 0.9693; More.....
Break of 0.9613 support indicates resumption of whole fall from 1.0342. Intraday bias in USD/CAD is turned back to the downside for 0.9548 support and below. We'd start to look for bottoming signal again as it approaches 0.9443 key support level. But still, break of 0.9770 resistance is ended to indicate short term bottoming. Otherwise, outlook will remain bearish in case of recovery.
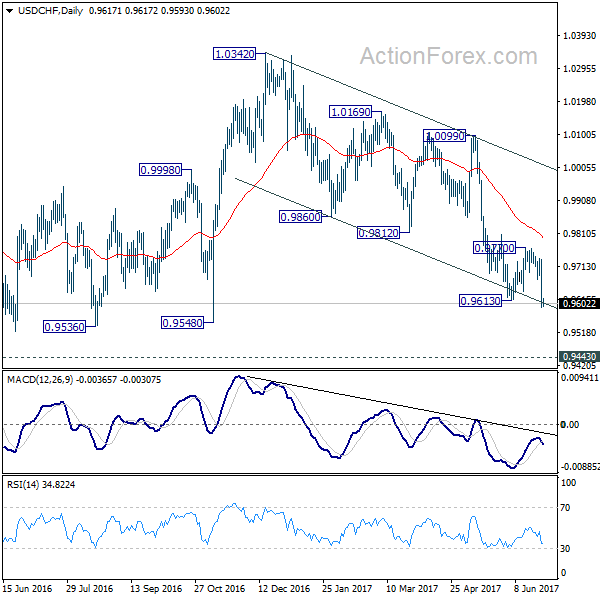
In the bigger picture, USD/CHF is still bounded in medium term range of 0.9443/1.0342 for the moment. Consolidative trading would likely continue and medium term outlook remains neutral. Break of 1.0342 key resistance is needed to confirm underlying bullish momentum in the pair. Meanwhile, downside attempts should be contained by 0.9443 key support level. However, sustained break of 0.9443 will carry larger bearish implication and target 0.9 handle.
USD/JPY Daily Outlook
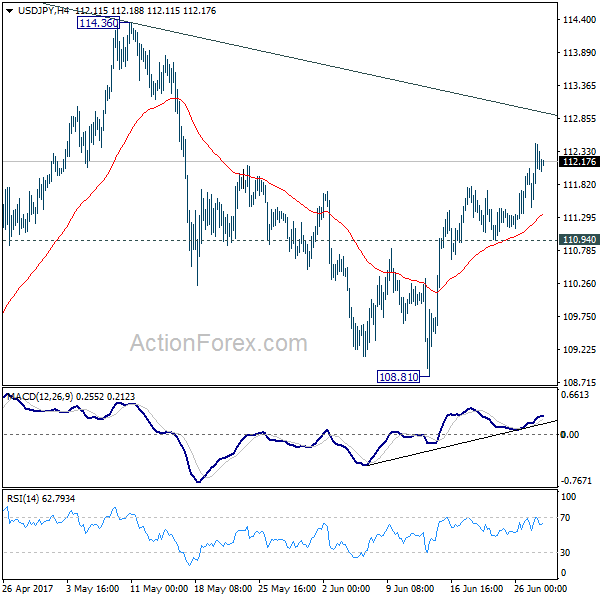
Daily Pivots: (S1) 111.71; (P) 112.09; (R1) 112.71; More...
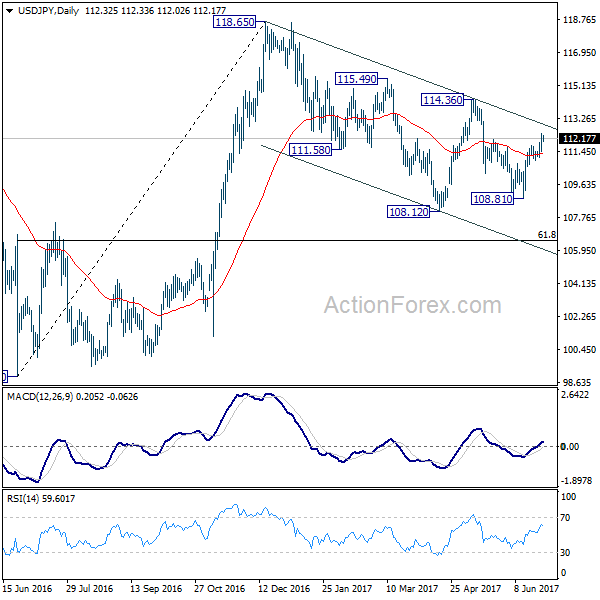
Intraday bias in USD/JPY remains on the upside as rise from 108.81 is in progress for channel resistance (now at 112.99). Sustained break there will suggest that whole pull back from 118.65 has completed at 108.12 already. In such case, further rise should be seen to 114.36 resistance for confirmation. On the downside, however, break of 110.94 support will argue that rebound from 108.81 has completed and turn bias back to the downside.
In the bigger picture, price actions from 125.85 high are seen as a corrective pattern. It's uncertain whether it's completed yet. But in case of another fall, downside should be contained by 61.8% retracement of 75.56 to 125.85 at 94.77 to bring rebound. Overall, rise from 75.56 is still expected to resume later after the correction from 125.85 completes.
USD/CAD Daily Outlook
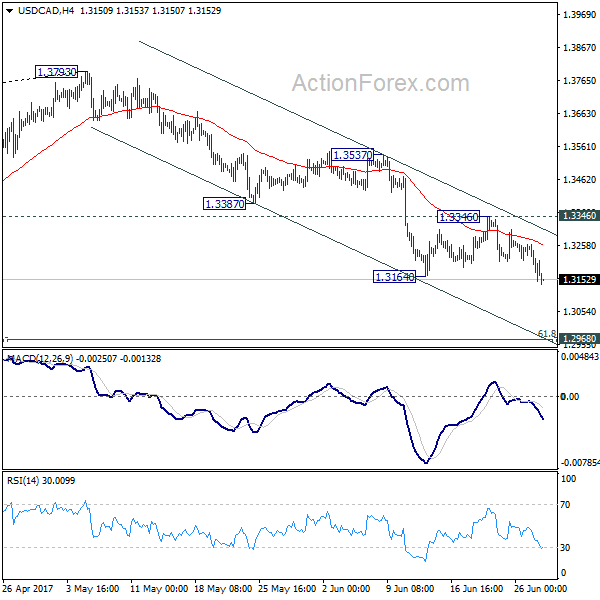
Daily Pivots: (S1) 1.3143; (P) 1.3202; (R1) 1.3256; More....
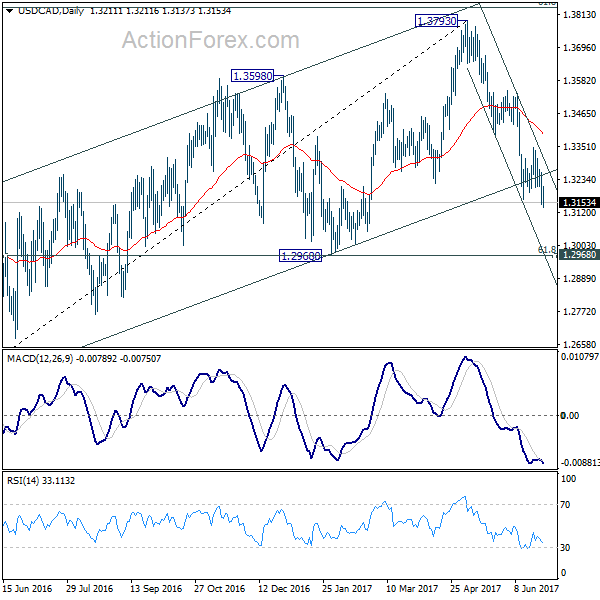
Break of 1.3164 support indicates resumption of fall from 1.3793. Intraday bias in USD/CAD is turned back to the downside for 1.2968 cluster support, 61.8% retracement of 1.2460 to 1.3793 at 1.2969. Decisive break there will confirm our bearish view that whole corrective rise from 1.2460 has completed at 1.3793. On the upside, break of 1.3346 resistance is needed to indicate short term bottoming. Otherwise, outlook will remain bearish in case of recovery.
In the bigger picture, price actions from 1.4689 medium term top are seen as a correction pattern. The first leg has completed at 1.2460. Rise from 1.2460 is seen as the second leg and has completed at 1.3793, ahead of 61.8% retracement of 1.4689 to 1.2460 at 1.3838. Break of 1.3222 should now indicate the start of the third leg while further break of 1.2968 should confirm. In that case, USD/CAD should decline through 1.2460 support to 50% retracement of 0.9406 to 1.4869 at 1.2048.
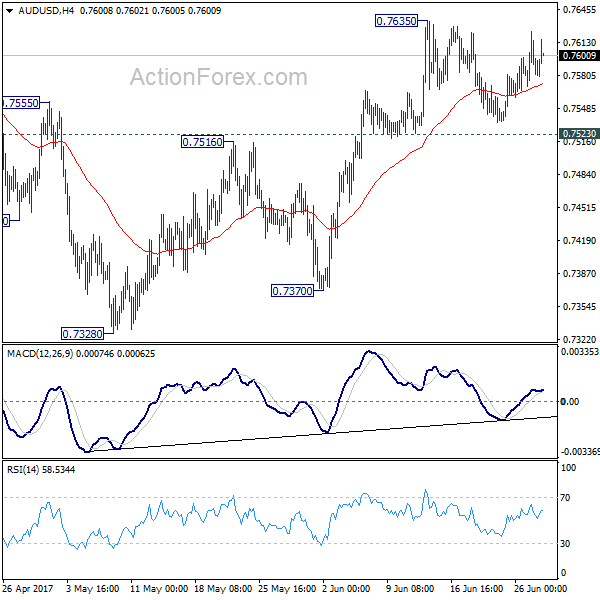
AUD/USD Daily Outlook
Daily Pivots: (S1) 0.7565; (P) 0.7594; (R1) 0.7612; More....
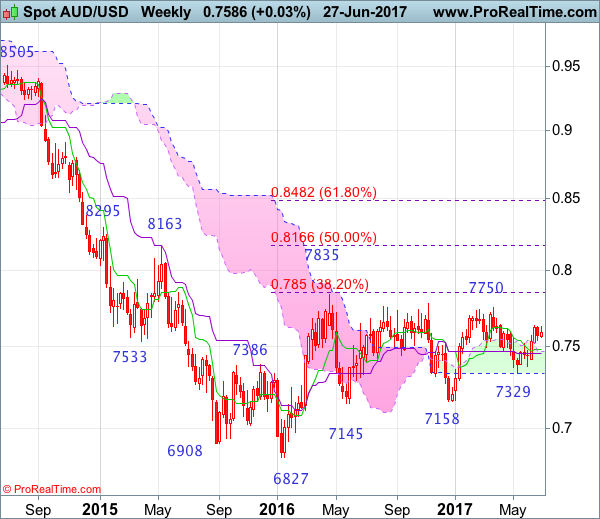
AUD/USD is still bounded in range below 0.7635 and intraday bias stays neutral first. On the upside, break of 0.7635 will extend the rise from 0.7328 to 0.7748 resistance and above. At this point, there is no clear sign of range breakout yet. Hence, we'd be cautious on topping again as it approaches medium term fibonacci level at 0.7849. Meanwhile, break of 0.7523 will argue that rebound from 0.7328 is possibly completed. In that case, intraday bias will be turned back to the downside for 0.7370 support.
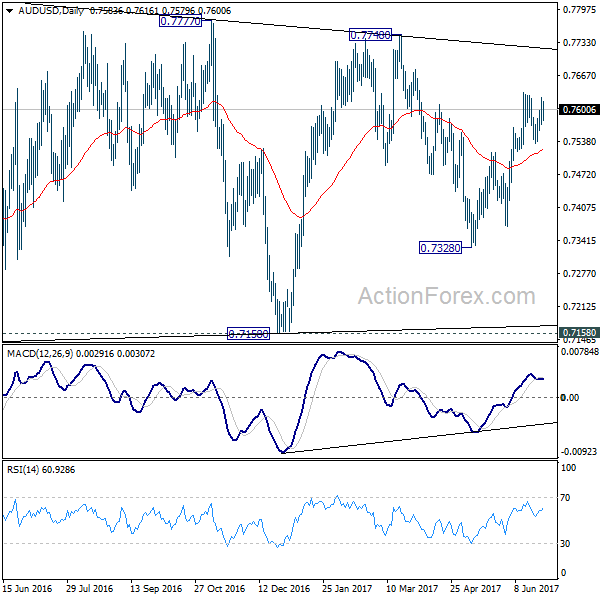
In the bigger picture, we're still treating price actions from 0.6826 low as a corrective pattern. And, as long as 38.2% retracement of 0.9504 to 0.6826 at 0.7849 holds, long term down trend from 1.1079 is expected to resume sooner or later. Break of 0.6826 low will target 0.6008 key support level. However, firm break of 0.7849 will indicate that rise from 0.6826 is developing into a medium term rebound, rather than a sideway pattern. In such case, stronger rise should be seen to 55 month EMA (now at 0.8116) and above.
AUD/JPY Candlesticks and Ichimoku Analysis
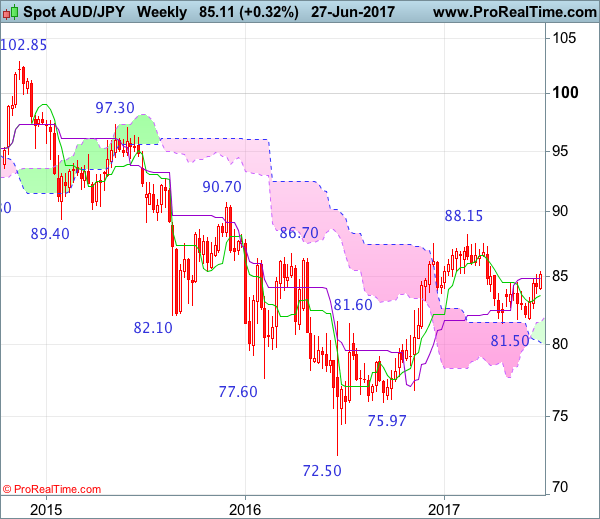
Weekly
• Last Candlesticks pattern: Shooting star
• Time of formation: 13 Mar 2017
• Trend bias: Down
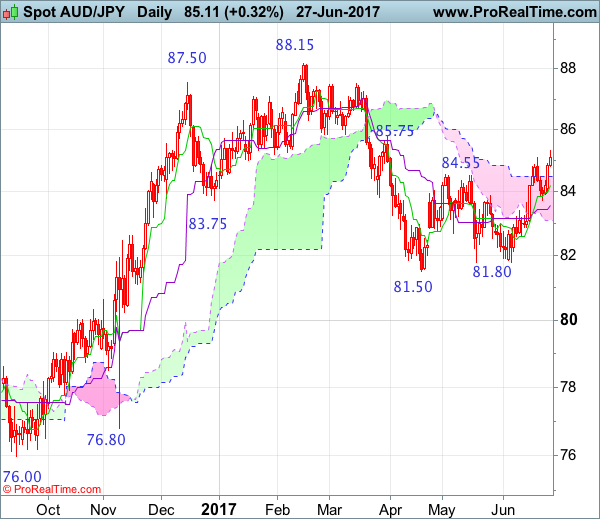
Daily
• Last Candlesticks pattern: Bearish engulfing pattern
• Time of formation: 16 Feb 2017
• Trend bias: Near term down
The Australian dollar rallied this month after holding above previous support at 81.50, suggesting the erratic rise from this recent low is still in progress and bullishness is seen for this move to extend further gain to 85.75 resistance, break there would suggest recent fall from 88.15 (this year’s high formed made in Feb) has ended at 81.50 and consolidation with upside bias is seen for further gain to 86.00, then towards 86.40-50 but near term overbought condition should limit upside to 87.00, risk from there has increased for a retreat later.
On the downside, expect pullback to be limited to the upper Kumo (now at 84.50) and the Tenkan-Sen (now at 84.20) should hold, bring another rise later. A daily close below support at 83.75 would abort and suggest top is formed instead, risk test of the Kijun-Sen (now at 83.56), break there would confirm and extend further weakness 83.00-10 which is likely to hold on first testing. Below this level would suggest the erratic rise from 81.50 has ended and bring further subsequent decline to 82.50-55 first.
Recommendation: Buy at 84.50 for 86.50 with stop below 83.50.
On the weekly chart, aussie continued finding good support at 81.80 and has staged a strong rebound this month, suggesting the erratic rise from 81.50 is still in progress and further gain to 85.75-80, then 86.40-50 would be seen, however, break of 87.50 resistance is needed to confirm the pullback from 88.15 (this year’s high) has ended, bring retest of this level later. Looking head, only above 88.15 would indicate early uptrend has resumed and encourage for headway to 88.50, then 89.00-10 but price should falter well below psychological resistance at 90.00.
On the downside, whilst initial pullback to 84.40-50 cannot be ruled out, reckon support at 83.75 would hold and bring another rise later. Only a weekly close below the Tenkan-Sen (now at 83.55) would abort and risk weakness to 83.00 and possibly towards 82.55-60 but said strong support at 81.80 should remain intact. Looking ahead, only break of support at 81.80 support would revive bearishness and signal recovery from 81.50 has ended, bring retest of this level, below there would extend the retreat from 88.15 top for a stronger retracement of early upmove to support at 81.10-15, a weekly close below there would retain bearishness and suggest the rise from 72.50 has ended, then further fall to 80.50 and possibly psychological support at 80.00 would follow.
AUD/USD Candlesticks and Ichimoku Analysis
Weekly
• Last Candlesticks pattern: Shooting doji
• Time of formation: 20 Feb 2017
• Trend bias: Sideways
Daily
• Last Candlesticks pattern: Bearish engulfing pattern
• Time of formation: 21 Mar 2017
• Trend bias: Near term down
Although aussie found support at 0.7535 last week and rebounded, a break of recent high at 0.7636 is needed to confirm the erratic upmove from 0.7329 low has resumed and extend further gain to previous resistance at 0.7680, having said that, aussie needs to break this level to signal the fall from 0.7750 top has ended at 0.7329 and bring subsequent retest of said chart resistance at 0.7750 which is likely to hold on first testing.
On the downside, if said resistance at 0.7636 continues to hold, then further consolidation would take place and another test of 0.7535 support cannot be ruled out, however, reckon the Kijun-Sen (now at 0.7510) would limit downside and bring another rise later. Below 0.7455-60 would defer and risk weakness towards 0.7400-10 but support at 0.7372 should remain intact. Looking ahead, only below 0.7372 would revive bearishness and suggest the rebound from 0.7329 has ended, bring retest of this level, break there would extend recent fall from 0.7750 top to 0.7300 and possibly 0.7250-60 but reckon downside would be limited to 0.7200-10 and price should stay well above indicated previous chart support at 0.7158.
Recommendation: Buy at 0.7510 for 0.7710 with stop below 0.7410.

On the weekly chart, aussie traded with a firm undertone after staging a strong rebound from 0.7329, adding credence to our view that the retreat from 0.7750 has ended at 0.7329 and consolidation with upside bias remains for further gain to 0.7680, however, break there is needed to add credence to this view and bring retest of this level later. Looking ahead, only a break above 0.7750 would another leg of the major rise from 0.6827 low is underway for retest of 0.7778, then towards last year’s high at 0.7835.
On the downside, expect pullback to be limited to 0.7500-10 and bring another rise. Below the Kijun-Sen (now at 0.7458) would prolong consolidation and risk weakness to 0.7410-15 but break of support at 0.7372 is needed to signal the rebound from 0.7329 has ended, bring retest of this level first. A break below there would extend recent decline from 0.7750 to 0.7290-00 and possibly towards 0.7230, however, downside should be limited to 0.7200 and price should stay well above previous support at 0.7158, risk from there is seen for a rebound to take place later.
EUR/AUD Daily Outlook
Daily Pivots: (S1) 1.4767; (P) 1.4863; (R1) 1.5045; More...
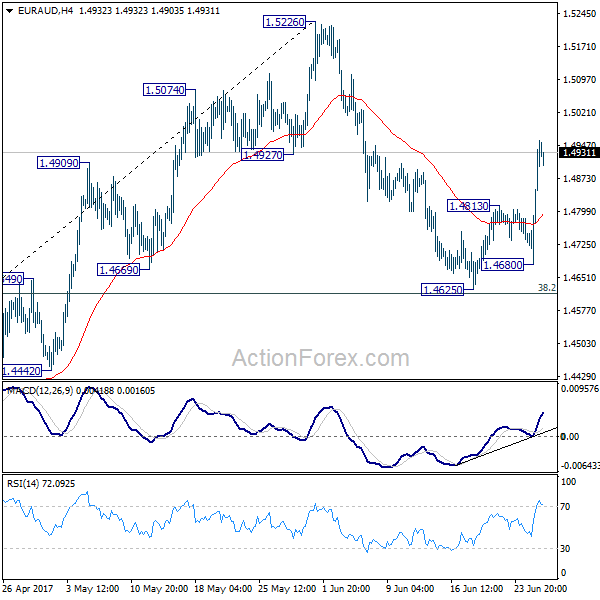
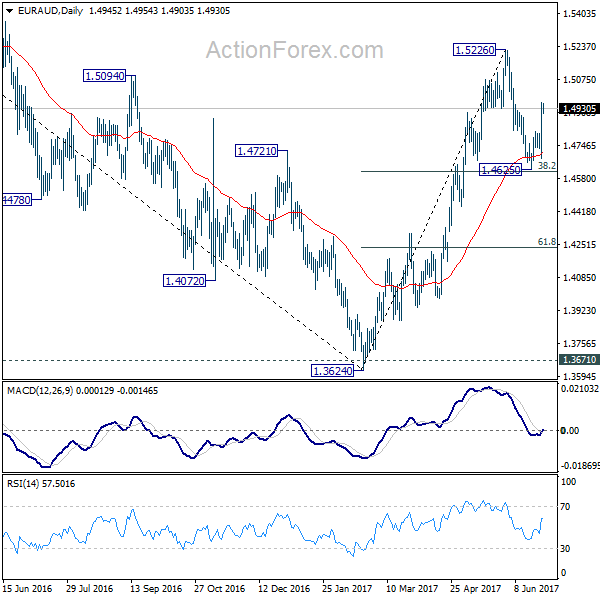
Intraday bias in EUR/AUD remains on the upside as rebound from 1.4625 continues. Pull back from 1.5226 should have completed at 1.4625, ahead of 38.2% retracement of 1.3624 to 1.5226 at 1.4614. Further rally should be seen to retest 1.5226 next. On the downside, though, below 1.4813 resistance turned support will turn bias to the downside for 1.4625 again.
In the bigger picture, price actions from 1.6587 medium term top are viewed as a corrective pattern. Such correction should be completed at 1.3624 after defending 1.3671 key support. Rise from 1.3642 would extend to 61.8% retracement of 1.6587 to 1.3624 at 1.5455. Sustained break there will pave the way to retest 1.6587. However, sustained break of 1.4669 support will dampen this bullish view. We'll assess the outlook later after looking at the structure and depth of the pull back.
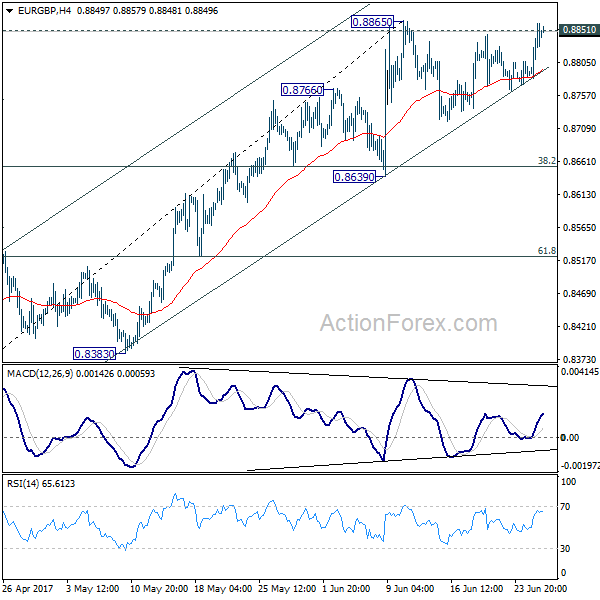
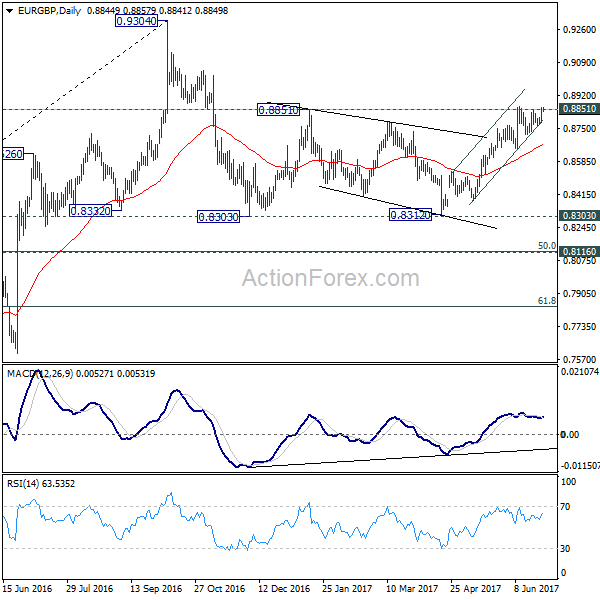
EUR/GBP Daily Outlook
Daily Pivots: (S1) 0.8800; (P) 0.8831; (R1) 0.8879; More...
At this point, intraday bias in EUR/GBP remains neutral as it's bounded in range below 0.8865. On the upside, decisive break of 0.8851/65 resistance zone will pave the way to retest 0.9304 high. In case of another fall, downside should be contained by 0.8639 support to bring rebound. However, break of 0.8639 support will now indicate near term topping and bring deeper pull back 0.8529 resistance turned support and below.
In the bigger picture, price actions from 0.9304 are viewed as a medium term corrective pattern. The leg from 0.9304 should have completed after testing 0.8332 structural support. But it's too early to say that larger rise from 0.6935 is resuming. Rejection from 0.9304 will extend the consolidation with another falling leg. Meanwhile, firm break of 0.9304 will target 0.9799 (2008 high). In case of another decline, we'd expect strong support from 0.8116 cluster support (50% retracement of 0.6935 to 0.9304 at 0.8120) to contain downside and bring rebound.