Sample Category Title
Trade Idea Update: GBP/USD – Buy at 1.2710
GBP/USD - 1.2771
New strategy :
Buy at 1.2710, Target: 1.2810, Stop: 1.2675
Position : -
Target : -
Stop : -
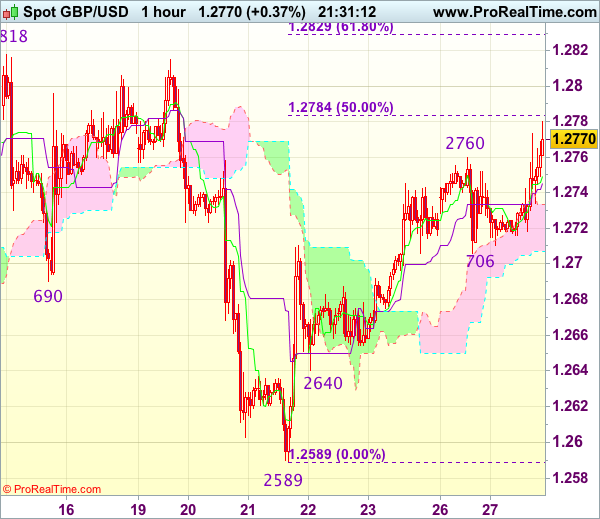
As cable has risen again after finding renewed buying interest at 1.2706, suggesting the erratic rise from 1.2589 low is still in progress and upside bias is seen for further gain to 1.2780-85 (50% Fibonacci retracement of 1.2978-1.2589), then towards resistance at 1.2818, however, break of latter level is needed to retain bullishness and extend the aforesaid rise to 1.2830 (approx. 61.8% Fibonacci retracement).
In view of this, would not chase this move here and would be prudent to buy cable on pullback as said support at 1.2706 should limit downside. Below 1.2680 would defer and suggest an intra-day top is formed instead, risk weakness to 1.2660 but support at 1.2640 should remain intact.
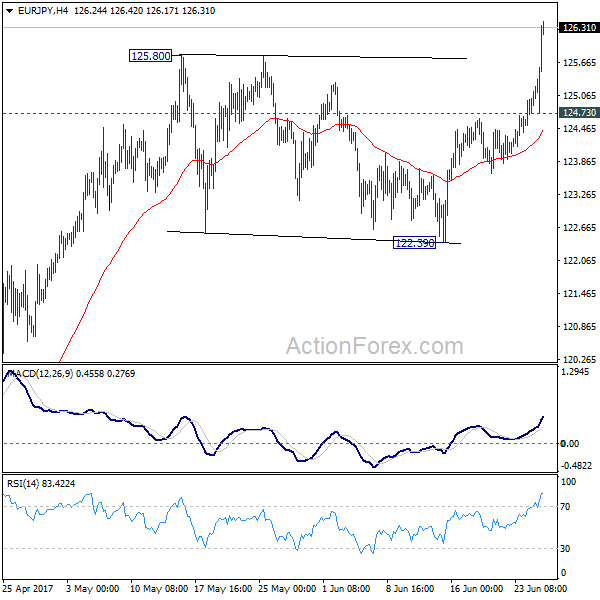
EUR/JPY Mid-Day Outlook
Daily Pivots: (S1) 124.60; (P) 124.87; (R1) 125.34; More...
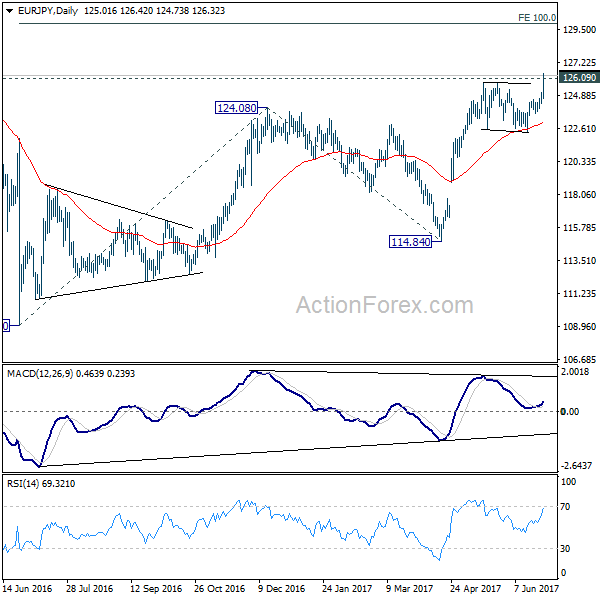
EUR/JPY surges to as high as 126.24 and broke 125.80/126.09 resistance zone. The development indicates resumption of rise from 114.84 and that from 109.03. Intraday bias is back on the upside for 100% projection of 109.03 to 124.08 from 114.84 at 129.89. On the downside, below 124.73 minor support will turn bias neutral first. But outlook will stay bullish as long as 122.39 support holds.
In the bigger picture, focus is staying on 126.09 support turned resistance. Decisive break there will confirm completion of the down trend from 149.76. And in such case, rise from 109.20 is at the same degree and should target 141.04 resistance and above. Meanwhile, rejection from 126.09 and break of 114.84 will extend the fall from 149.76 through 109.20 low.
Trade Idea Update: EUR/USD – Buy at 1.1260
EUR/USD - 1.1299
New strategy :
Buy at 1.1260, Target: 1.1360, Stop: 1.1225
Position : -
Target : -
Stop : -
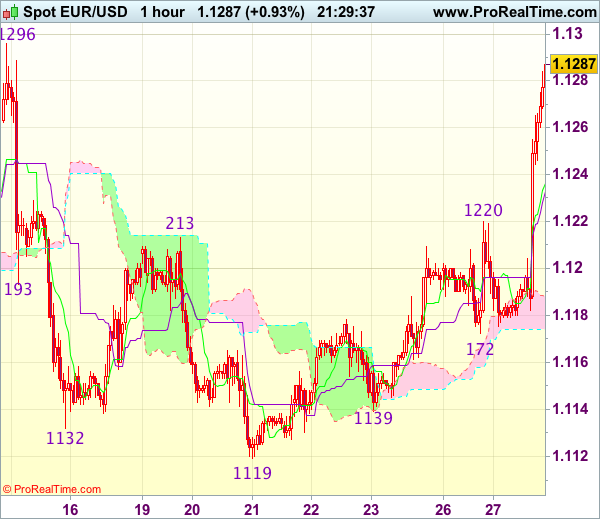
The single currency has rallied today and just broke above previous resistance at 1.1296, confirming recent upmove has resumed and bullishness is seen for further gain to 1.1335-40 (50% projection of 1.0839-1.1296 measuring from 1.1119), then towards 1.1360, however, near term overbought condition should prevent sharp move beyond 1.1400 (61.8% projection), risk from there is seen for a retreat later.
In view of this, would not chase this rise here and would be prudent to buy euro on pullback as 1.1250-60 should limit downside. Below the Kijun-Sen (now at 1.1240) would defer and risk test of previous resistance at 1.1220 but break there is needed to confirm an intra-day top is formed, bring correction towards 1.1180-85 later.
EUR/AUD Mid-Day Outlook
Daily Pivots: (S1) 1.4714; (P) 1.4758; (R1) 1.4785; More...
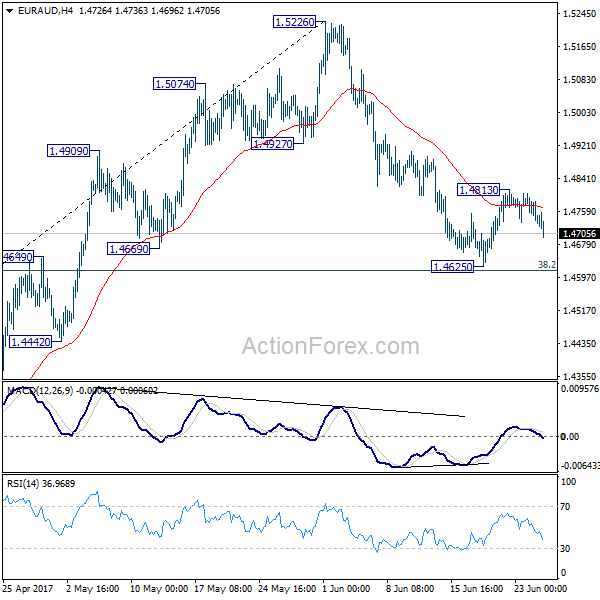
EUR/AUD's strong rise and break of 1.4813 indicates resumption of rebound from 1.4625. The development is in line with the view that pull back from 1.5226 has completed, ahead of 38.2% retracement of 1.3624 to 1.5226 at 1.4614. Intraday bias is turned back to the upside for retesting 1.5226 first. On the downside, below 1.4680 will turn bias back to the downside for 1.4625.
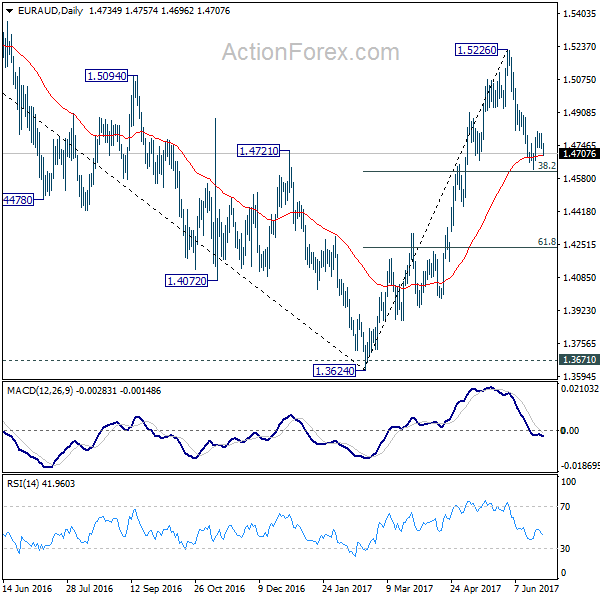
In the bigger picture, price actions from 1.6587 medium term top are viewed as a corrective pattern. Such correction should be completed at 1.3624 after defending 1.3671 key support. Rise from 1.3642 would extend to 61.8% retracement of 1.6587 to 1.3624 at 1.5455. Sustained break there will pave the way to retest 1.6587. However, sustained break of 1.4669 support will dampen this bullish view. We'll assess the outlook later after looking at the structure and depth of the pull back.
DAX Dips as Draghi Says ECB Stimulus to Continue
The DAX index has lost ground in the Tuesday session. Currently, the index is at 12,679.50, down 0.72%. On the release front, there are no German or eurozone releases. Earlier in the day, ECB President Mario Draghi addressed the ECB Forum on Central Banking. On Wednesday, Draghi will again address the forum, and Germany will release Import Prices.
The markets were listening closely as ECB President Mario Draghi addressed the ECB Forum on Tuesday, and although the euro responded positively, Draghi's message to the markets was essentially "more of the same". Draghi acknowledged that economic indicators were showing a broadening recovery in the eurozone, but pointed to inflation as the barrier to tightening policy. Draghi defended the bank's loose accommodative policy, saying that it had pushed inflation higher, but stimulus was needed until inflation becomes "durable and self-sustaining". Germany is not happy with the ECB's current monetary policy, as it feels that tighter policy is more appropriate for the strong German economy. For his part, Draghi has no intentions of altering current policy until inflation moves closer to the ECB's target of 2 percent, and he has been consistent in this message.
It was a busy weekend in Italy, as the Italian government announced that would bail out two ailing banks, Banca Popolare di Vicenza and Veneto Banca. This deal will cost the Italian taxpayer 5.2 billion euros, and the government provided additional guarantees of 12 billion euros. Italy has already agreed to bail out another Italian bank, Monte dei Pashci di Siena, for up to 6.6 billion euros. The Italian government has set aside 20 billion euros to bail out struggling banks, and potentially may have used up the entire amount for these bailouts, depending on how the actual size of the bailouts. European stock markets reacted positively to the move, and Deustche Bank and Commerzbank both started the week with gains. The bailouts remove a major headache for European regulators and should strengthen the fragile Italian banking sector, which has had times been in crisis mode, threatening the stability of the eurozone financial sector.
AUD/NZD is Supported at 1.0360
Today we witnessed a slowing growth in the NZ Trade Balance, which fell below forecasts. It has followed a string of positive data from NZ, but as we saw last week, in my opinion. there was a slightly dovish stance from the RBNZ. Despite this, the NZD has made gains against the AUD for the past 3 months, particularly as Iron Ore, Gold and LNG prices have been retreating, thus being negative for the AUD. We are very close to the Daily long term trend line since April 2015, and we might see supports around 1.036.
That being said, the POC zone (D L4, ATR low, trend line, historical buyers) comes within 1.0360-75 and a retrace within the zone should spike the price up. Important level to watch is also 1.0394 and X cross of trend line and D H3. A continuation and daily close above 1.0433 will possibly prolong an uptrend move in the pair targeting 1.0475 and 1.0525. A daily close below 1.0350 could negate this scenario.
Trade Idea Update: USD/JPY – Buy at 111.00
USD/JPY - 111.87
Original strategy :
Buy at 111.00, Target: 112.00, Stop: 110.65
Position : -
Target : -
Stop : -
New strategy :
Buy at 111.00, Target: 112.00, Stop: 110.65
Position : -
Target : -
Stop : -
Although the greenback resumed recent upmove and rose to 112.08, the subsequent retreat suggests consolidation below this level would be seen and pullback to 111.35-40 cannot be ruled out, however, support at 110.95 should contain downside and bring another upmove later, break of resistance at 112.08-13 would extend further gain to 112.40-45 (50% projection of 108.82-111.79 measuring from 110.95) but price should falter below 112.75-80 (61.8% projection).
In view of this, would not chase this rise here and we are looking to buy dollar on pullback as support at 110.95 should contain downside. below 110.80 (38.2% Fibonacci retracement of 108.82-111.79 measuring from 10.95) but only break of 110.65 support would confirm top is formed.

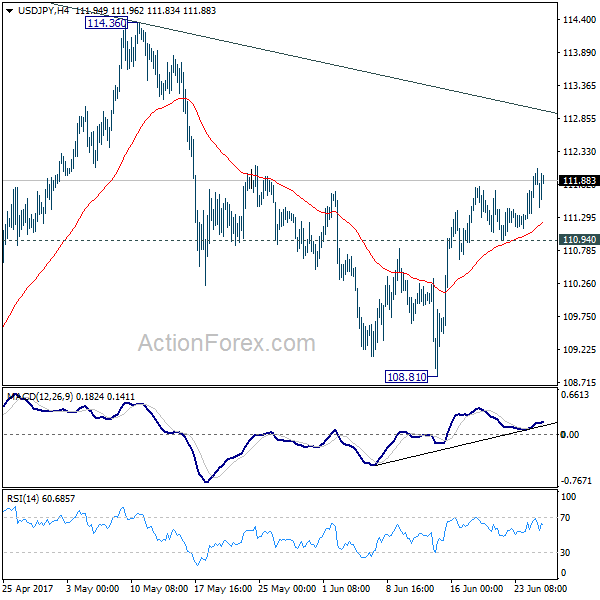
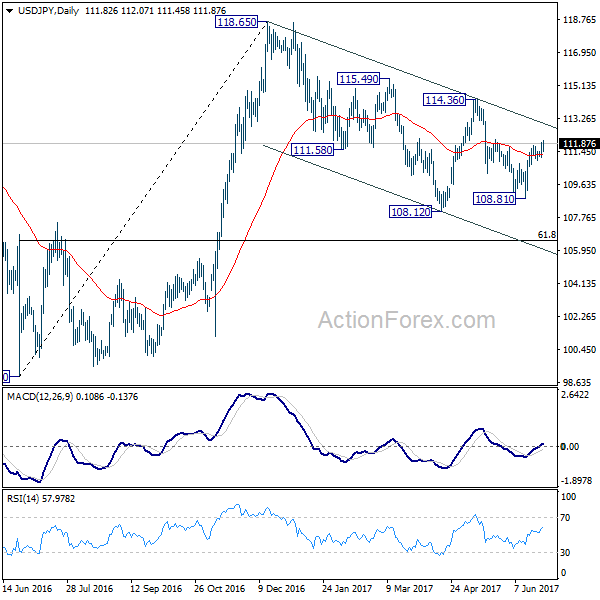
USD/JPY Mid-Day Outlook
Daily Pivots: (S1) 111.34; (P) 111.64; (R1) 112.16; More...
Intraday bias in USD/JPY remains on the upside as rise from 108.81 continues. Further rally would be seen to channel resistance (now at 112.99). Sustained break there will suggest that whole pull back from 118.65 has completed at 108.12 already. In such case, further rise should be seen to 114.36 resistance for confirmation. On the downside, however, break of 110.94 support will argue that rebound from 108.81 has completed and turn bias back to the downside.
In the bigger picture, price actions from 125.85 high are seen as a corrective pattern. It's uncertain whether it's completed yet. But in case of another fall, downside should be contained by 61.8% retracement of 75.56 to 125.85 at 94.77 to bring rebound. Overall, rise from 75.56 is still expected to resume later after the correction from 125.85 completes.
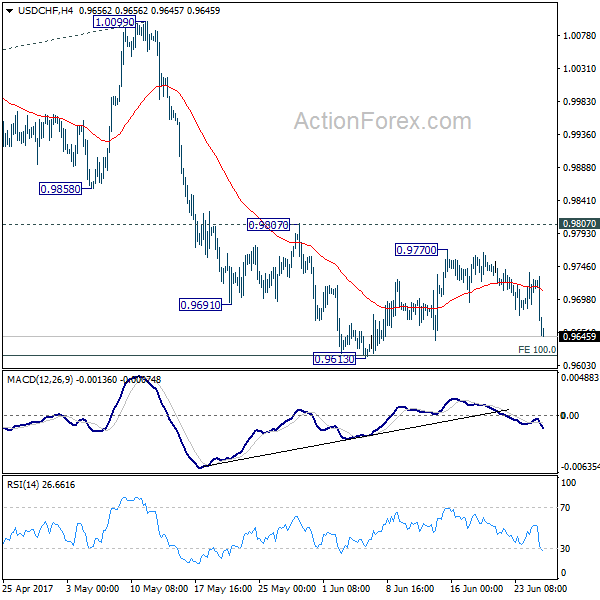
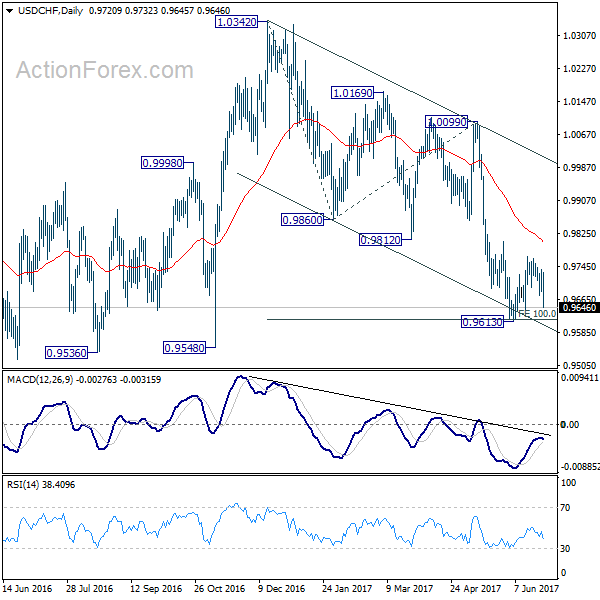
USD/CHF Mid-Day Outlook
Daily Pivots: (S1) 0.9690; (P) 0.9714; (R1) 0.9748; More.....
USD/CHF drops sharply today with focus on 0.9613 support. Decisive break there will extend the decline from 1.0342 and target 0.9548 support and below. We'd start to look for bottoming signal again as it approaches 0.9443 key support level. In any case, outlook will remain bearish as long as 0.9807 resistance holds. Firm break of 0.9807, however, will indicate near term reversal and turn outlook bullish for 1.0099 resistance next.
In the bigger picture, USD/CHF is still bounded in medium term range of 0.9443/1.0342 for the moment. Consolidative trading would likely continue and medium term outlook remains neutral. Break of 1.0342 key resistance is needed to confirm underlying bullish momentum in the pair. Meanwhile, downside attempts should be contained by 0.9443 key support level. However, sustained break of 0.9443 will carry larger bearish implication and target 0.9 handle.
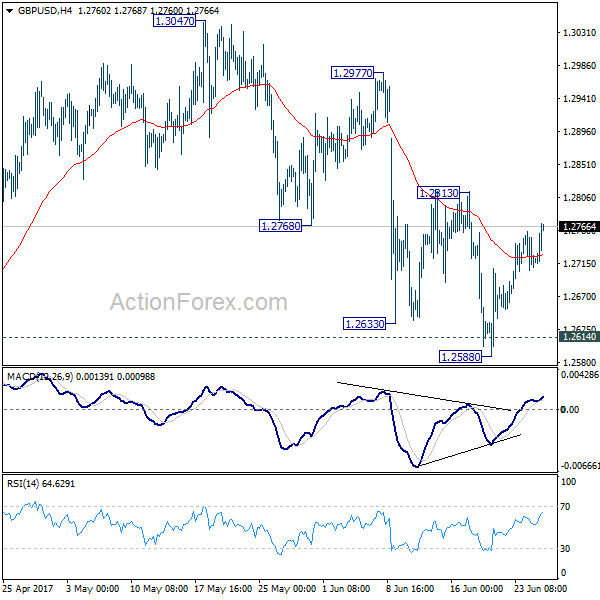
GBP/USD Mid-Day Outlook
Daily Pivots: (S1) 1.2698; (P) 1.2728; (R1) 1.2752; More...
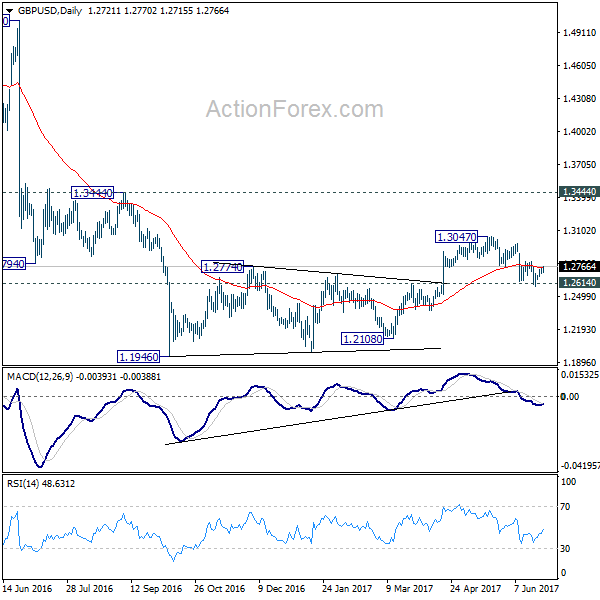
GBP/USD recovers further today but stays in range of 1.2588/2813. Intraday bias remains neutral for the moment. With 1.2813 resistance intact, deeper decline is expected. Sustained break of 1.2614 resistance turned support will confirm our bearish view that consolidation pattern from 1.1946 has completed. In that case, deeper fall should be seen back to retest 1.1946 low. However, break of 1.2813 resistance will dampen our view and turn bias back to the upside for 1.3047 and above.
In the bigger picture, fall from 1.7190 is seen as part of the down trend from 2.1161. Price actions from 1.1946 medium term low are seen as a consolidation pattern, which could have completed at 1.3047 after hitting 55 week EMA. Break of 1.1946 low will target 61.8% projection of 1.5016 to 1.1946 from 1.3047 at 1.1150 next. In case the consolidation from 1.1946 extends, outlook will stay remain bearish as long as 1.3444 resistance holds.