Sample Category Title
Trade Idea: GBP/USD – Buy at 1.2660
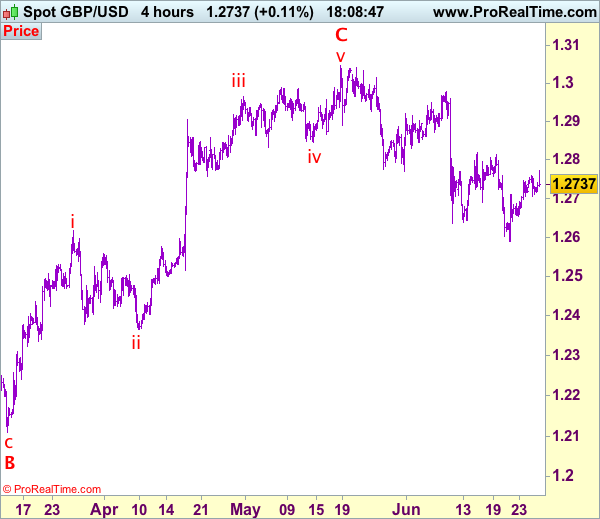
GBP/USD – 1.2741
Recent wave: Wave V of larger degree wave (III) has ended at 1.1986 and major correction has commenced from there for gain to 1.3000 and 1.3140-50
Trend: Near term down
Original strategy :
Buy at 1.2660, Target: 1.2810, Stop: 1.2600
Position: -
Target: -
Stop: -
New strategy :
Buy at 1.2660, Target: 1.2810, Stop: 1.2600
Position: -
Target: -
Stop:-
As sterling has continued trading with a firm undertone after staging a strong rebound from 1.2589 (last week’s low), suggesting low has been formed there and consolidation with mild upside bias is seen for gain towards resistance at 1.2818, however, a sustained breach above there is needed to add credence to this view and suggest recent decline from 1.3048 has ended at 1.2589, then headway to 1.2850-60 would follow.
Our preferred count on the daily chart is that cable's rebound from 1.3500 (wave (A) trough) is unfolding as a wave (B) with A ended at 1.7043, followed by triangle wave B and wave C as well as wave (B) has ended at 1.7192, the subsequent selloff is the larger degree wave (C) which is still unfolding with minor wave (III) of larger degree wave 3 ended at 1.1986, hence wave (IV) correction is in progress which could either be a triangle wave (IV) of a complex formation but upside should be limited to 1.3500 and price should falter well below 1.4000, bring another decline in wave (V) of 3 for weakness to 1.1500, then 1.1200.
On the downside, expect pullback to be limited to 1.2660-70 and support at 1.2640 should hold, bring another rebound later. Only a drop below 1.2640 would suggest the rebound from 1.2589 has ended, bring retest of this level, break of this support would revive bearishness and signal recent decline from 1.3048 top has resumed for retracement of early upmove to 1.2550, then towards previous support at 1.2515.
Trade Idea: GBP/JPY – Buy at 141.30
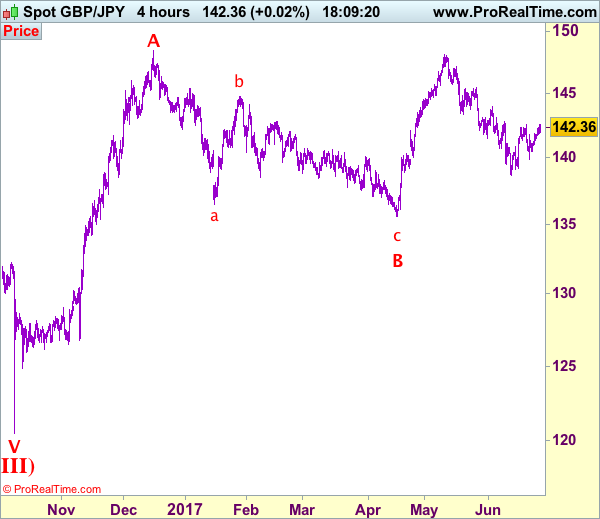
GBP/JPY - 142.45
Recent wave: Medium term low formed at 120.50 and (A)-(B)-(C) major correction has commenced with (A) leg ended at 148.45, hence wave (B) is unfolding for retreat to 131.00-10.
Trend: Near term down
Original strategy:
Buy at 141.45, Target: 143.45, Stop: 140.85
Position: -
Target: -
Stop: -
New strategy :
Buy at 141.30, Target: 143.30, Stop: 140.70
Position: -
Target: -
Stop:-
As sterling has maintained a firm undertone and indicated resistance at 142.50 was penetrated, adding credence to our bullish view that the erratic rise from 138.70 is still in progress for test of indicated previous resistance at 142.75, above there would signal recent decline has ended and encourage for at least a strong retracement of recent selloff to 143.05-10, then 143.50 but price should falter below previous resistance at 143.95.
In view of this, we are looking to buy sterling on subsequent pullback as support at 141.35 should limit downside and bring another rise. Below 140.95 would risk weakness to 140.45-50 but only break there would signal the rebound from 139.85 has ended bring another test of this level first. Looking ahead, only break there would suggest the aforesaid erratic rise fro 138.70 is over, bring further fall to 139.15 support first.
Our preferred count is that larger degree wave V with circle is unfolding from 251.12 with wave (I) 219.34, (II): 241.38 and wave (III) is subdivided into 1: 192.60, 2: 215.89 (23 Jul 2008) and wave 3 ended at 118.87 earlier in 2009. The correction from there to 162.60 is wave 4 which itself is a double three and is labeled as first a-b-c ended at 151.53, followed by wave x at 139.03, 2nd a ended at 162.60, 2nd b at 146.75 and 2nd c leg of wave 4 ended at 163.00. Therefore, the decline from 163.00 to 116.85 is now treated as wave 5 which also marked the end of larger degree wave (III), hence wave (IV) major correction has commenced for retracement of the wave (III) from 241.38 and upside target at 183.95-00 (50% Fibonacci retracement of the wave (II) from 241.38) had been met, a drop below 160.00 would suggest wave (IV) has ended at 195.85, bring decline in wave (V) for initial weakness to 130 (already met) and 120.
Technical Outlook: AUDUSD – Extended Recovery Eyes Key 0.7635 Barrier
The Aussie dollar is in strong rally for the third consecutive day and establishes above 0.7600 handle after recovery peaked at 0.7624 on Tuesday.
The pair is on track to fully retrace 0.7635/0.7535 pullback which was contained by top of thick daily cloud, where a higher base was left.
Slow stochastic in steep ascend on daily chart shows enough room at the upside for stretch towards key near-term barrier at 0.7635 (14 June high), break of which is needed to signal bullish continuation of broader uptrend from 0.7328 (09 May low).
Daily studies in firm bullish configuration continue to underpin advance. Broken Fibo 61.8% of 0.7635/0.7535 now acts as initial support at 0.7597, followed by 10SMA at 0.7581, which is expected to contain extended dips.
Res: 0.7624, 0.7635, 0.7662, 0.7679
Sup: 0.7597, 0.7581, 0.7553, 0.7535
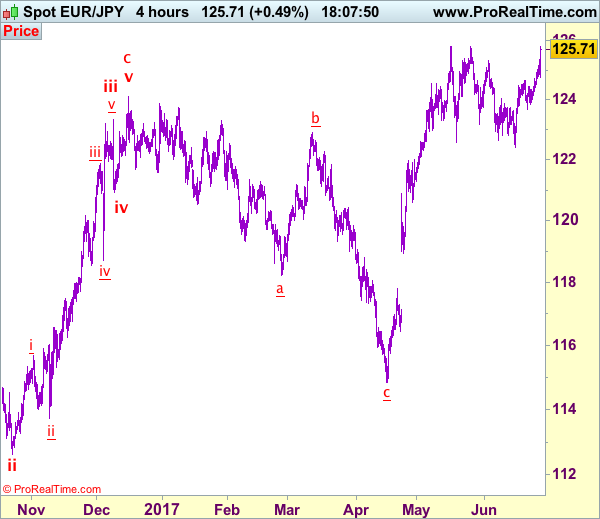
Trade Idea: EUR/JPY – Target met and buy again at 125.00
EUR/JPY - 125.71
Recent wave: wave v of (C) ended at 94.12 and major correction in wave A has ended at 149.79
Trend: Near term up
Original strategy:
Bought art 123.80, met target at 125.30
Position: - Long at 123.80
Target: - 125.30
Stop: -
New strategy :
Buy at 125.00, Target: 127.00, Stop: 124.40
Position: -
Target: -
Stop:-
Current anticipated rally confirms our bullish view (our long position entered at 123.80 met target at 125.30 with 150 points profit), this move adds credence to our view that early upmove has resumed and may extend headway to 126.40-50, then towards 127.00, however, near term overbought condition should prevent sharp move beyond latter level and reckon 127.50-60 would hold from here, bring retreat later.
In view of this, we are looking to reinstate long on pullback as 125.00 should limit downside. Below previous resistance at 124.65 would defer and risk correction towards 124.00-10 but only break of indicated support at 123.66 would signal top is formed instead, bring correction to 123.00 later.
Our latest preferred count is that wave (ii) is ABC-X-ABC which ended at 123.33 and wave (iii) is unfolding with wave iii ended at 100.77, followed by wave iv at 111.57 and wave v as well as the wave (iii) has ended at 97.04, followed by wave (iv) at 111.43 and wave (v) has ended at 94.12 which is also the end of the larger degree v, this also implied the major wave (C) has also ended there, hence major correction has commenced from there with (A) leg unfolding in its lower degree wave c which has possibly ended at 145.69. Under this count, A-B-C wave (B) has commenced with A leg ended at 136.23, wave B at 143.79 and wave C has possibly ended at 149.79.
Our larger degree count is that the decline from 139.26 is wave (C) and is sub-divided into a diagonal triangle i-ii-iii-iv-v with wave i - 105.44, wave ii- 123.33, wave iii - 97.03, wave iv - 111.43, followed by the final wave v as well as the end of wave (C) at 94.12, this also mark the bottom of larger degree wave B. Under this count, major rise in wave C has commenced as an impulsive wave with minor wave III ended at 145.69, wave V is still in progress for further gain to 150.00. Having said that, this so-called wave V could well be the first leg of larger degree 5-waver wave C and this wave C should bring at least a retest of wave A top at 169.97 (July 2008).
Central Bankers Take Centre Stage On Tuesday
- Yellen, Harker and Kashkari scheduled to appear;
- Euro climbs as Draghi appears open to gradual removal of stimulus;
- Sterling briefly pops as FPC raises counter-cyclical capital buffer.
Central bankers will be the centre of attention over the next couple of days, with a number of policy makers appearing, including Federal Reserve Chair Janet Yellen, ECB President Mario Draghi and the Bank of England Governor Mark Carney.
Already today, we've heard from Carney and Draghi – both of whom will appear again tomorrow – while Yellen is scheduled to appear later in the session, as well as fellow Fed policy makers Patrick Harker and Neel Kashkari – both of whom are voting members on the FOMC this year. Needless to say, this could prompt plenty of volatility throughout the session, as we've already seen in the euro and sterling.
The euro is climbing again on Tuesday, buoyed by comments from ECB President Mario Draghi who highlighted the strengthening and broadening recovery in the region. While Draghi is among the more dovish policy makers at the central bank, there has been persistent speculation that the ECB will announce further reductions in asset purchases later this year and a more positive assessment of the economy from the President may suggest he's willing to back it.
Draghi maintained his dovish stance though, warning that the central bank needs to be prudent in how it adjusts its parameters to improving economic conditions, calling for any adjustments to be gradual and only when improving dynamics that justify them appear significantly secure. This suggests to me that he will back a gradual tightening in monetary policy, which we have been seeing an increasing demand for.
The pound – which was already trading higher against the dollar on the day, albeit largely down to weakness in the latter – briefly popped higher after the release of the Financial Stability Report, in which the Bank of England raised the counter-cyclical capital buffer to 0.5%, from 0%, and laid out plans to raise it to 1% in November. While banks have one year to implement the change, it still represents a minor tightening in financial conditions which triggered the initial move in sterling, a move that was almost immediately fully reversed.
It will be interesting to see how sterling trades in the coming hours and whether markets perceive this to be an effective tightening or an alternative to a rate hike that some policy makers have been leaning towards in recent months. Should the latter be true then I would expect to see the pound coming under a little pressure. It is currently trading below the levels it was at prior to the release but the moves are so small that we can't read too much into them.
Trade Idea: AUD/USD – Hold long entered at 0.7595
AUD/USD – 0.7603
Recent wave: Wave 5 ended at 1.1081 and major correction has commenced for fall to 0.7000 and then towards 0.6500-10
Trend: Near term up
Original strategy :
Bought at 0.7595, Target: 0.7745, Stop: 0.7535
Position: - Long at 0.7595
Target: - 0.7745
Stop: - 0.7535
New strategy :
Hold long entered at 0.7595, Target: 0.7745, Stop: 0.7555
Position: - Long at 0.7595
Target: - 0.7745
Stop:- 0.7555
As aussie found good support at 0.7535 and has staged a strong rebound, retaining our bullish view and consolidation with upside bias remains for a test of indicated resistance at 0.7636, break there would confirm recent upmove has resumed and extend the rise from 0.7329 towards previous resistance at 0.7680 but loss of momentum should limit upside to chart resistance at 0.7750 and price should falter below 0.7785-90.
In view of this, we are holding on to our long position entered at 0.7595. Only below said support at 0.7535 would defer and suggest top is possibly formed, bring correction to 0.7515-20, break there would provide confirmation, then correction to 0.7490-95 and possibly towards support at 0.7457 would be seen later.
On the 4-hour chart, the move from 0.8066 is the wave 5 with i: 0.8860, ii: 0.8315, wave iii is an extended move ended at 1.0183, iv: 0.9706 and wave v has ended at 1.1081 (also the top of entire wave 5). The subsequent selloff is the major correction which is unfolding as ABC-X-ABC and 2nd A leg has ended at 0.8848, followed by a-b-c wave B which ended at 0.9758, hence, 2nd C wave is now in progress and indicated downside target at 0.7000 and 0.6950 had been met, so further fall to 0.6710-20 cannot be ruled out.

Euro Improves As Draghi Upbeat About Economy
The euro has posted gains in the Tuesday session. EUR/USD is trading at 1.1260, as the pair is up 0.70%. For a second straight day, there are no eurozone releases. Earlier in the day, ECB President Mario Draghi addressed the ECB Forum on Central Banking, and his upbeat comments pushed the euro higher. In the US, today's key event is CB Consumer Confidence, which is expected to dip to 116.1.
ECB President Mario Draghi addressed the ECB Forum on Tuesday, and the markets liked what they were hearing, as the euro has improved to 2-week highs. Draghi acknowledged that economic indicators were showing a broadening recovery in the eurozone, and even had something positive to say about inflation, as he noted that “deflationary forces have been replaced by reflationary ones”. Draghi defended the bank's loose accommodative policy, saying that it had pushed inflation higher, but stimulus was needed until inflation becomes “durable and self-sustaining”. Draghi's message to the markets and his critics is that “we're on the right path, but please show some patience”. Germany, the eurozone's largest economy, wants to see a tighter policy, which is a better fit for the robust economy. Clearly however, the ECB under Draghi's stewardship has no intentions of altering current policy until inflation moves closer to the ECB's target of 2 percent.
The German economy is firing on all four cylinders, and the business sector remains optimistic, according to a key survey released on Monday. Ifo Business Climate hit a record high in June, climbing to 115.1. The indicator has improved for five consecutive months as optimism in the business sector continues to rise. Ifo chief Clemens Fuest said that the German business sector was in a “jubilant” mood, and said that he expected business conditions to continue to improve. Major economic institutes and the German central bank have revised upwards their forecast for German growth in 2017 and 2018. German GDP grew 0.6% in the first quarter, and the German locomotive has boosted growth in the eurozone. Analysts are closely monitoring how the ECB plans to respond to stronger economic conditions in the euro-area. So far, the central bank has dismissed calls to tighten monetary policy.
GOLD Ready For Pushing Higher, SILVER Ready For Another Leg Lower, CRUDE OIL Short-Squeeze.
GOLD Ready for pushing higher.
Gold's medium-term momentum is positive. Hourly support is located at 1236 (26/06/2017 low). Stronger support is given at 1214 (09/05/2017 low). Expected to show short-term upside pressures.
In the long-term, the technical structure suggests that there is a growing upside momentum. A break of 1392 (17/03/2014) is necessary ton confirm it, A major support can be found at 1045 (05/02/2010 low).
SILVER Ready for another leg lower.
Silver's selling pressures are strong despite ongoing bullish consolidation. Closest support is given at 16.36 (21/06/2017 low). Strong support is given at 16.06 (09/05/2017 low). Key resistance is given at a distance at 19.00 (09/11/2017 high). The road seems wide open for further decline.
In the long-term, the death cross indicates that further downsides are very likely. Resistance is located at 25.11 (28/08/2013 high). Strong support can be found at 11.75 (20/04/2009).
CRUDE OIL Short-squeeze.
Crude Oil is now consolidating higher since the commodity hit 11-month low. Support is given at 42.05 (21/06/2017 low). Expected to show renewed weakness.
In the long-term, crude oil has recovered after its sharp decline last year. However, we consider that further weakness are very likely. Strong support lies at 35.24 (05/04/2016) while resistance can now be found at 55.24 (03/01/2017 high).
Forex Technical Analysis: EUR/USD, USD/JPY, GBP/USD
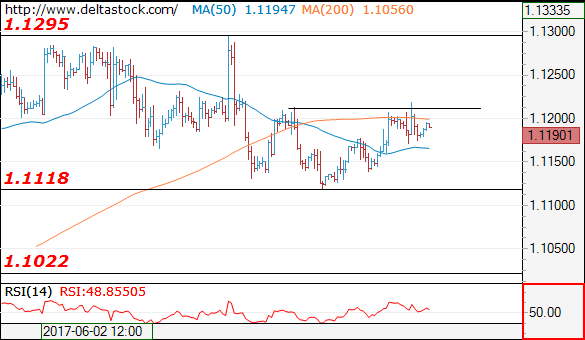
EUR/USD
Current level - 1.1190
There is no sign of a reversal yest and the bias is positive, with a risk of an upswing towards 1.1250 area. Crucial support lies at 1.1175.
| Resistance | Support | ||
| intraday | intraweek | intraday | intraweek |
| 1.1210 | 1.1360 | 1.1175 | 1.1020 |
| 1.1295 | 1.1610 | 1.1110 | 1.0838 |
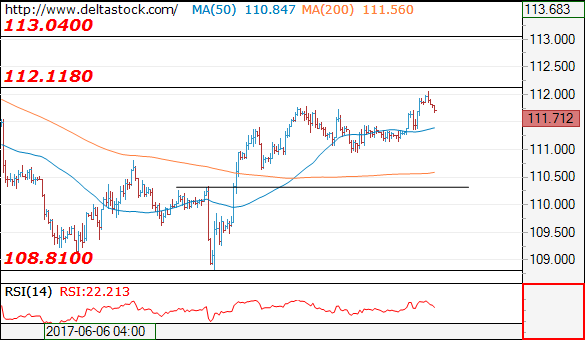
USD/JPY
Current level - 111.71
The recent spike to 112.10 should be followed by a brief corrective leg towards 111.00 area, before continuation of the general upmove towards 113.00 area.
| Resistance | Support | ||
| intraday | intraweek | intraday | intraweek |
| 112.10 | 112.10 | 111.00 | 109.08 |
| 113.00 | 114.30 | 110.30 | 108.12 |
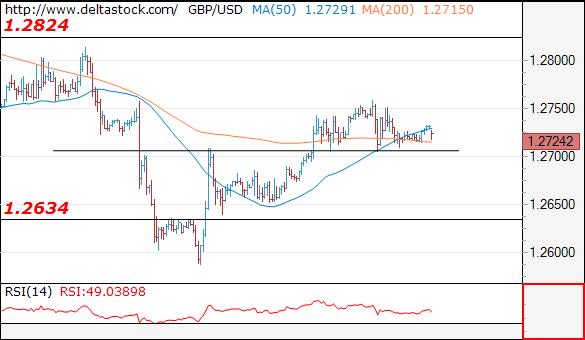
GBP/USD
Current level - 1.2724
The overall outlook remains positive above 1.2700 support area, for a rise towards 1.2825 zone.
| Resistance | Support | ||
| intraday | intraweek | intraday | intraweek |
| 1.2825 | 1.2970 | 1.2700 | 1.2480 |
| 1.2825 | 1.3050 | 1.2634 | 1.2480 |
EUR/JPY Pushing Higher Towards Resistance At 125.82, EUR/GBP Ready To Break Symmetrical Triangle, EUR/CHF Ready To Bounce Back Lower...
EUR/JPY Pushing higher towards resistance at 125.82.
EUR/JPY has bounced back after breaking hourly support given at 122.56 (18/05/2017 low) has been broken. Hourly resistance can be found at 125.82 (16/05/2017 high). Major support is given at 114.90 (18/04/2017 low).
In the longer term, the technical structure validates a medium-term succession of lower highs and lower lows. As a result, the resistance at 149.78 (08/12/2014 high) has likely marked the end of the rise that started in July 2012. Strong support at 94.12 (24/07/2012 low) looks nonetheless far away.
EUR/GBP Ready to break symmetrical triangle.
EUR/GBP is struggling to go any higher. Hourly resistance is given at 0.8866 (12/06/2017 high). Other support can be found at 0.8652 (08/06/2017 low). Expected to break lower symmetrical triangle.
In the long-term, the pair has largely recovered from recent lows in 2015. The technical structure suggests a growing upside momentum. The pair is trading above from its 200 DMA. Strong resistance can be found at 0.9500 psychological level.
EUR/CHF Ready to bounce back lower on downtrend channel.
EUR/CHF's short-term bullish pressures are definitely on. The pair is riding higher within downtrend channel. Expected to show bearish pressures towards strong hourly support that can be found at 1.0792 (03/05/2017 low).
In the longer term, the technical structure is mixed. Resistance can be found at 1.1200 (04/02/2015 high). Yet,the ECB's QE programme is likely to cause persistent selling pressures on the euro, which should weigh on EUR/CHF. Supports can be found at 1.0184 (28/01/2015 low) and 1.0082 (27/01/2015 low).