Sample Category Title
EUR/JPY Pushing Higher Towards Resistance At 125.82, EUR/GBP Ready To Break Symmetrical Triangle, EUR/CHF Ready To Bounce Back Lower...
EUR/JPY Pushing higher towards resistance at 125.82.
EUR/JPY has bounced back after breaking hourly support given at 122.56 (18/05/2017 low) has been broken. Hourly resistance can be found at 125.82 (16/05/2017 high). Major support is given at 114.90 (18/04/2017 low).
In the longer term, the technical structure validates a medium-term succession of lower highs and lower lows. As a result, the resistance at 149.78 (08/12/2014 high) has likely marked the end of the rise that started in July 2012. Strong support at 94.12 (24/07/2012 low) looks nonetheless far away.
EUR/GBP Ready to break symmetrical triangle.
EUR/GBP is struggling to go any higher. Hourly resistance is given at 0.8866 (12/06/2017 high). Other support can be found at 0.8652 (08/06/2017 low). Expected to break lower symmetrical triangle.
In the long-term, the pair has largely recovered from recent lows in 2015. The technical structure suggests a growing upside momentum. The pair is trading above from its 200 DMA. Strong resistance can be found at 0.9500 psychological level.
EUR/CHF Ready to bounce back lower on downtrend channel.
EUR/CHF's short-term bullish pressures are definitely on. The pair is riding higher within downtrend channel. Expected to show bearish pressures towards strong hourly support that can be found at 1.0792 (03/05/2017 low).
In the longer term, the technical structure is mixed. Resistance can be found at 1.1200 (04/02/2015 high). Yet,the ECB's QE programme is likely to cause persistent selling pressures on the euro, which should weigh on EUR/CHF. Supports can be found at 1.0184 (28/01/2015 low) and 1.0082 (27/01/2015 low).
GBP/USD Candlesticks and Ichimoku Analysis
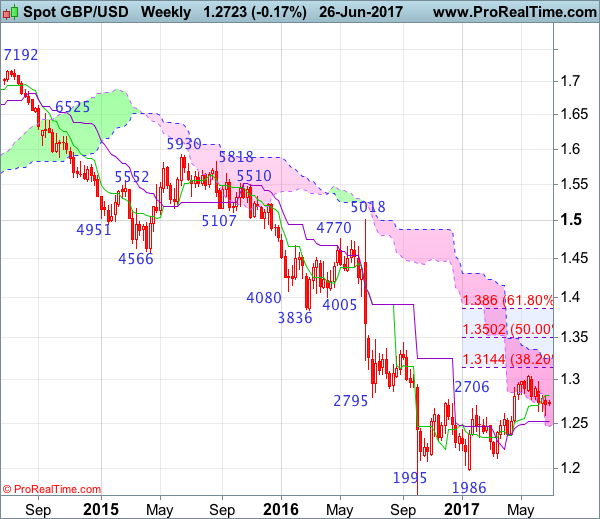
Weekly
• Last Candlesticks pattern: Long white candlestick
• Time of formation: 16 Jan 2017
• Trend bias: Down
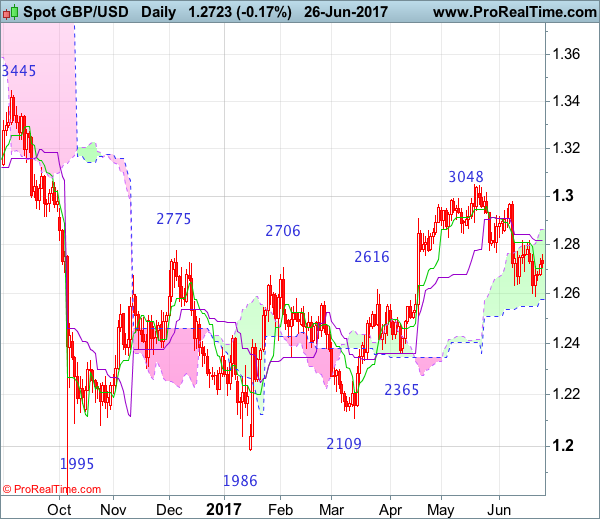
Daily
• Last Candlesticks pattern: Long white candlestick
• Time of formation: 18 Apr 2017
• Trend bias: Near term up
GBP/USD – 1.2750
Although cable resumed recent decline and fell to as low as 1.2589 (our short position entered at 1.2800 met target at 1.2600 with 200 points profit), lack of follow through selling on break of previous support at 1.2635 and the subsequent strong rebound suggest consolidation above this level would be seen and initial recovery to 1.2775-80 and possibly towards the Kijun-Sen (now at 1.2812) cannot be ruled out, however, reckon upside would be limited and 1.2860-65 would hold and price should falter well below 1.2900-10, bring another decline later.
On the downside, expect pullback to be limited to the Tenkan-Sen (now at 1.2702) and bring another rebound. Below 1.2675-80 would bring weakness to 1.2650-55 but said support at 1.2589 should hold from here, bring another rebound later. Only a drop below 1.2589 would signal recent decline from 1.3048 top has resumed and extend weakness to 1.2550, then 1.2500 support, having said that, oversold condition should limit downside to 1.2440-50 and price should stay well above key support at 1.2365, bring rebound later.
Recommendation: Hold short entered at 1.2800 for 1.2600 with stop above 1.2900.
On the weekly chart, despite cable’s anticipated fall to 1.2589 last week, the subsequent bounce from there formed a black candlestick with a long lower shadow, suggesting consolidation above this level would be seen (for 1-2 weeks) and recovery to the Tenkan-Sen (now at 1.2819) cannot be ruled out, however, reckon upside would be limited to 1.2915-20 and price should falter well below resistance at 1.2978, bring another decline later. Looking ahead, only a break of 1.2978 would signal the pullback from 1.3048 has ended instead, bring retest of this recent high, only above there would confirm the erratic upmove from 1.1986 low (2017 low) has resumed for retracement of early decline to 1.3090-00, then towards 1.3140-50 (38.2% Fibonacci retracement of 1.5018-1.1986) but price should falter well below 1.3200-10.
On the downside, whilst pullback to 1.2650-60 cannot be ruled out, price should stay well above said support at 1.2589 and bring another rebound later. Only a break of said support at 1.2589 would signal the fall from 1.3048 top is still in progress for correction of early upnove to 1.2550, however, still reckon downside would be limited and previous support at 1.2515 should remain intact, price should stay well above previous support at 1.2365, bring rebound later.
USD/CHF Short-Term Bearish, USD/CAD Buying Demand Is Fading, AUD/USD Strengthening.
USD/CHF Short-term bearish.
USD/CHF is pushing lower. Hourly resistance can be found at 0.9771 (09/06/2017 high). Strong resistance is given at 1.0107 (10/04/2017 high). Expected to show continued short-term bearish pressures towards 0.9700.
In the long-term, the pair is still trading in range since 2011 despite some turmoil when the SNB unpegged the CHF. Key support can be found 0.8986 (30/01/2015 low). The technical structure favours nonetheless a long term bullish bias since the unpeg in January 2015.
USD/CAD Buying demand is fading.
USD/CAD is in a consolidation phase after the strong decline. Hourly support lies at 1.3165 (14/06/2017 high). Expected to show continued weakness towards support given at 1.3010 (16/02/2017 low).
In the longer term, the pair lies in a bullish channel since a year. Strong resistance is given at 1.4690 (22/01/2016 high). Long-term support can be found at 1.2461 (16/03/2015 low).
AUD/USD Strengthening.
AUD/USD's technical structure is positive since early May. Yet, in the short-term there will likely be renewed bearish pressures towards support given at 0.7520 (09/06/2017 low)
In the long-term, we are waiting for further signs that the current downtrend is ending. Key supports stand at 0.6009 (31/10/2008 low) . A break of the key resistance at 0.8295 (15/01/2015 high) is needed to invalidate our long-term bearish view.
EUR/USD Sideways Price Action, GBP/USD Buying Pressures Are Slowing Down, USD/JPY Monitoring Resistance At 112.13.
EUR/USD Sideways price action.
EUR/USD is trading mixed. The pair is still trading below strong resistance given at 1.1300 (09/11/2017 high). Hourly support can be found at 1.1076 (18/05/2017 low). Stronger support lies at 1.0842 (11/05/2017 low).
In the longer term, the momentum is clearly negative. We favour a continued bearish bias towards parity. Key resistance holds at 1.1714 (24/08/2015 high) while strong support lies at 1.0341 (03/01/2017 low).
GBP/USD Buying pressures are slowing down.
GBP/USD has stopped its rebound. Hourly support is given at 1.2589 (21/06/2017 low). Hourly resistance lies at 1.2818 (14/06/2017 high). Expected to show further renewed selling pressures.
The long-term technical pattern is even more negative since the Brexit vote has paved the way for further decline. Long-term support given at 1.0520 (01/03/85) represents a decent target. Long-term resistance is given at 1.5018 (24/06/2015) and would indicate a long-term reversal in the negative trend. Yet, it is very unlikely at the moment.
USD/JPY Monitoring resistance at 112.13.
USD/JPY has failed to monitor resistance given at 112.13 (24/05/2017 high). Hourly support can be found at 110.65 (16/06/2017 low). Stronger support is located at 108.13 (17/04/2017 low).
We favor a long-term bearish bias. Support is now given at 96.57 (10/08/2013 low). A gradual rise towards the major resistance at 135.15 (01/02/2002 high) seems absolutely unlikely. Expected to decline further support at 93.79 (13/06/2013 low).
Technical Outlook: USDJPY – Monday’s Rally Cracked Daily Cloud But Firm Break Above Is Needed For Stronger Bullish Signal
Strong rally on Monday has fully reversed 111.78/110.94 pullback and managed to close marginally above daily cloud/100SMA barriers. Today's probe above 112.00 handle was so far short-lived, as strong offers lay at this zone. However, current easing is seen as consolidation ahead of fresh attempts higher, as daily MA's in strong bullish setup continue to underpin. Bulls need sustained break and close above daily cloud (which is currently spanned between 111.65 and 111.82) as well as break above 112.24 (Fibo 61.8% of 114.36/108.80) to generate strong bullish signal for resumption of recovery rally from 108.80 (14 June low). Session low/lower 20d Bollinger band at 111.48 marks solid support, guarding a cluster of MA's between 111.17 and 110.70. Speech of Fed's chair Janet Yellen is due later today and will be closely watched for firmer signals of timing of Fed's next rate hike.
Res: 111.82, 112.07, 112.24, 112.40
Sup: 111.48, 111.33, 111.17, 110.91
Elliott Wave Analysis: BTCUSD Trading In A Correction; Downside Can Be Limited
BTCUSD may unfold a more slow and choppy movement in the next couple of trading sessions as we see a corrective phase in action. We see red wave A completed with three waves and also wave B. Current weakness can now be red wave C, that can search for a base around the 1854 level.
BTCUSD, 4H
USD/CHF Candlesticks and Ichimoku Analysis
Weekly
• Last Candlesticks pattern: Shooting star
• Time of formation: 7 Mar 2017
• Trend bias: Sideways
Daily
• Last Candlesticks pattern: Morning star
• Time of formation: 9 May 2017
• Trend bias: Near term up
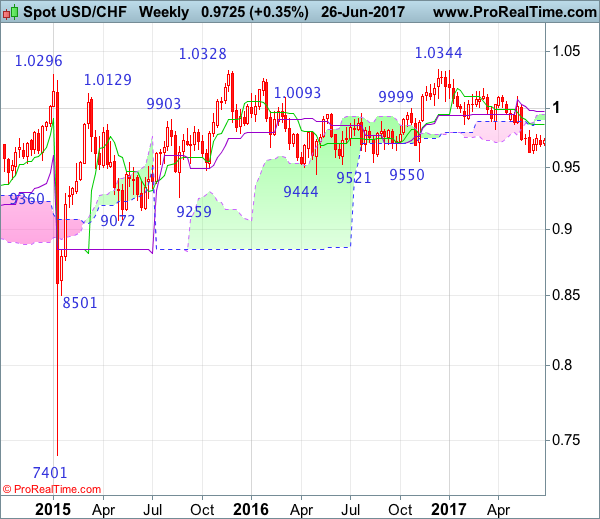
USD/CHF – 0.9700
Although the greenback retreated after meeting resistance at 0.9771 earlier this month, below 0.9641 support is needed to signal the rebound from 0.9613 has ended there, bring retest of this level, break there would confirm recent decline from 1.0344 top (2016 high) has resumed and may extend further weakness to support at 0.9550, then towards psychological support at 0.9500, having said that, near term oversold condition should prevent sharp fall below latter level and risk from there has increased for a rebound later.
On the upside, if said support at 0.9641 continues to hold, then further consolidation would take place and another bounce to 0.9771 cannot be ruled out, however, reckon upside would be limited to indicated resistance at 0.9808, bring another decline. A daily close above 0.9859 (previous support now resistance) would defer and suggest a temporary low has been formed instead, bring a stronger rebound to the lower Kumo (now at 0.9896) and then 0.9950 but price should falter below 1.0000 and bring another selloff.
Recommendation: Sell at 0.9805 for 0.9605 with stop above 0.9905

On the weekly chart, as the greenback has remained under pressure, suggesting bearishness remains for recent decline from 1.0344 to resume after consolidation, expect recovery to be limited to resistance at 0.9808 and the Tenkan-Sen (now at 0.9857) should hold, bring another decline later. Below support at 0.9613 would confirm the aforesaid decline has resumed and may extend weakness for retracement of early upmove towards previous support at 0.9550 but reckon downside would be limited to 0.9500 and another previous support at 0.9444 should remain intact.
On the upside, although initial recovery to 0.9770-75 cannot be ruled out, reckon resistance at 0.9808 would limit upside and bring another decline. A weekly close above the Tenkan-Sen (now at 0.9857) would defer and risk a stronger rebound to 0.9940-50 but 1.0007 (previous resistance) should limit upside and price should falter well below 1.0100, bring another selloff later. Above 1.0100 would signal low is formed instead and suggest the aforesaid decline from 1.0344 has ended, bring test of 1.0171 resistance next.
Central Bank Speeches In Focus, Euro Eases On Draghi, Dollar Awaits Yellen, Gold Recovers
As the Asian markets were closing for the day, major currencies were mostly range-bound in a relatively quiet session due to few data releases and ahead some of the key events scheduled for later in the day.
European Central Bank President Mario Draghi will speak shortly at the ECB Forum on Central Banking in Portugal. Bank of England Governor Mark Carney is scheduled to speak following the release of the BoE's Financial Stability Report, while Federal Reserve Chair Janet Yellen will be speaking later today from London. Forex market participants are keen on getting more insight into the latest thinking of these monetary policy makers.
The dollar has been under slight pressure against the yen as Asian markets were coming to the end of the trading day. At 111.71, the greenback fell 0.16% versus the yen during the session. Market participants are eyeing Janet Yellen's speech, as they are hoping for more clarity into the latest inflation outlook and the potential for another rate hike this year.
Euro/dollar traded in the narrow range of 1.1180-1.1203 during the Asian session. The euro managed to recoup some of the losses against the dollar, after weakening in yesterday's US trading session on Mario Draghi's opening remarks at the ECB Forum. The ECB President defended the Bank's loose monetary policy.
In the meantime, the Bank of England is expected to publish the Financial Stability Report that will be followed by Mark Carney's speech. His remarks will be closely watched. Pound/dollar traded in the range between 1.2722 and 1.2724.
Both the Australian and the New Zealand dollar got a boost during the Asian session amid yesterday's soft US durable goods data. The China-linked aussie might have also been helped by Chinese industrials strong profit growth, as well as positive comments by Chinese Premier on the growth outlook for the Mainland. The Australian dollar posted gains for the third consecutive day against the greenback. It was last trading at $0.7606, up 0.3% on the day.
New Zealand's trade surplus in May stood at NZ$103 million (US$75 million), well under the NZ$420m expected and the prior month's NZ$536m. A strong rise in imports of both petroleum products and motor vehicles caused total imports to top forecasts and weighed on the overall balance. By contrast, exports were close to the expected level at NZ$4.95 billion, with the key dairy sector leading the gain. The New Zealand dollar edged lower against its US counterpart as the data were released, but firmed up later during the Asian session.
Taking a look at gold, the precious metal managed to recover some of yesterday's losses, following a large sell order that hit the market. The commodity last traded at $1250.33 an ounce. This compares to yesterday's one-month low of $1235.84 an ounce.
WTI oil futures (August 2017 contract) continued to gain for the fourth consecutive day, trading at $43.65 a barrel.
Conservatives Reach A Deal With The DUP
Yesterday, the UK Conservative Party finally reached a deal with Northern Ireland's Democratic Unionist Party (DUP) to back Theresa May's minority government. The deal suggests that the 10 DUP MPs will vote for the Queen's Speech, which will allow May to keep her job as Prime Minister. The Irish Party also committed to back the Tories in other key votes in the House of Commons.
Sterling reacted little to the announcement, as this deal had been widely anticipated and probably came as a surprise to nobody. Moving forward, the next risk event for the pound is the actual vote on the Queen's Speech, expected to take place on Thursday. If all goes as planned and the Speech is passed, political uncertainty in the UK could dissipate further, and market focus is likely to turn to headlines surrounding the negotiating process. Monetary policy may also keep investors sitting on their hands, especially considering the divided views within the BoE Committee.
GBP/USD traded slightly lower on Monday after it hit resistance at 1.2755 (R1). During the Asian morning Tuesday, it hit support near 1.2700 (S1) and then recovered somewhat. Bearing in mind that the rate is still trading below the key resistance territory of 1.2850 (R3), but above the longer-term upside support line drawn from the low of the 7th of October, we consider the short-term outlook to be neutral. That said, we see the likelihood for the rate to trade higher heading into the Queen's Speech vote on Thursday and get closer to 1.2850 (R3), given that the Tory-DUP accord lifts some political uncertainty.
If Cable manages to break above the 1.2755 (R1) resistance soon, then we may see it targeting our next resistance of 1.2815 (R2).
Draghi says rates have to be low for growth to recover
Speaking in Portugal yesterday, ECB President Mario Draghi maintained a somewhat dovish tone. The ECB chief defended the Bank's massive stimulus program, indicating that interest rates have to be very low for economic growth to recover. This is no change in ECB rhetoric, which although it shifted to a less dovish bias at the latest policy meeting, it remained committed to keeping rates at current low levels. Thus, we keep our view untouched that the ECB is likely to continue to shift towards a more sanguine bias at its upcoming meetings, provided that incoming Eurozone data remain solid. Draghi will speak again today and tomorrow, but given that he already expressed his view, we don't expect any major reaction from the euro, unless he provides fresh signals on policy. Besides the ECB President, focus is likely to remain on Eurozone's preliminary CPI data for June, due out on Friday, which could prove critical to market expectations regarding the Bank's next move.
EUR/USD slid somewhat yesterday after it hit resistance at 1.1220 (R1), to hit support at 1.1170 (S1). The pair has been trading in a sideways mode since the 19th of May, between the support of 1.1120 (S2) and the resistance territory of 1.1300 (R2). Thus, we believe that the near-term path remains sideways. However, given that on the 20th of June the rate started to recover after it hit the lower bound of the aforementioned range, we believe that there is scope for some further recovery, perhaps towards the upper end of the range at 1.1300 (R2).
Today's highlights:
During the European day, we only get second-tier economic indicators. In Sweden, PPI data for May are due out while from the US, we get the S&P/Case-Shiller house price index for April, as well as the CB consumer confidence index for June.
Besides ECB's Draghi, today we will also hear from Fed Chair Janet Yellen, San Francisco Fed President John Williams, and Philadelphia Fed President Patrick Harker. Market participants may focus primarily on Chair Yellen, and specifically, on whether she will support another rate hike this year, amid slowing inflation.
GBP/USD
Support: 1.2700 (S1), 1.2635 (S2), 1.2600 (S3)
Resistance: 1.2755 (R1), 1.2815 (R2), 1.2850 (R3)
EUR/USD
Support: 1.1170 (S1), 1.1120 (S2), 1.1075 (S3)
Resistance: 1.1220 (R1), 1.1300 (R2), 1.1380 (R3)
Technical Outlook: EURUSD Rallies Above 20SMA On Draghi’s Comments
The Euro jumped from tight overnight range on comments from ECB's President Mario Draghi, who pointed at strengthening and broadening recovery in the Eurozone. Draghi also said that the EU economy still needs considerable monetary support from the central bank even as the economy recovers steadily and inflation picks up.
Fresh bullish acceleration eventually broke above 20SMA which caped upside attempts in past two days.
Today's close above 20SMA would be bullish signal and may re-attract 1.1300 target zone, below which repeated upside rejections occurred in early June.
Broken 20SMA now acts as initial support at 1.1203, followed by lower pivot at 1.1177 (10SMA), loss of which would generate stronger bearish signal.
Res: 1.1254, 1.1285, 1.1295, 1.1314
Sup: 1.1219, 1.1203, 1.1177, 1.1145