Sample Category Title
GBP/JPY Daily Outlook
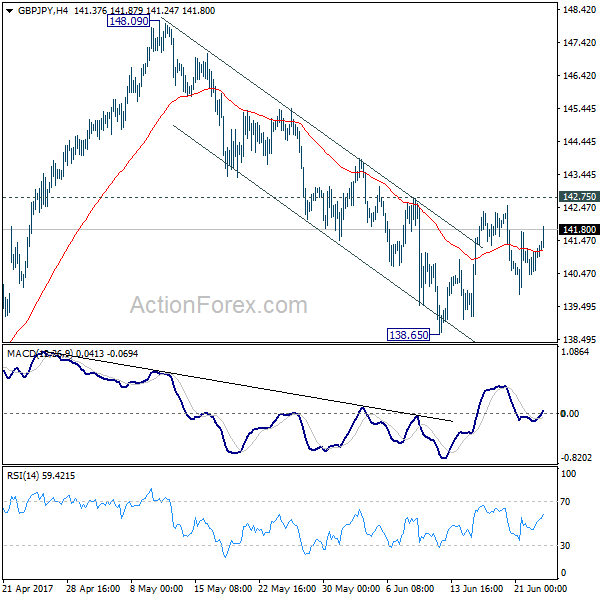
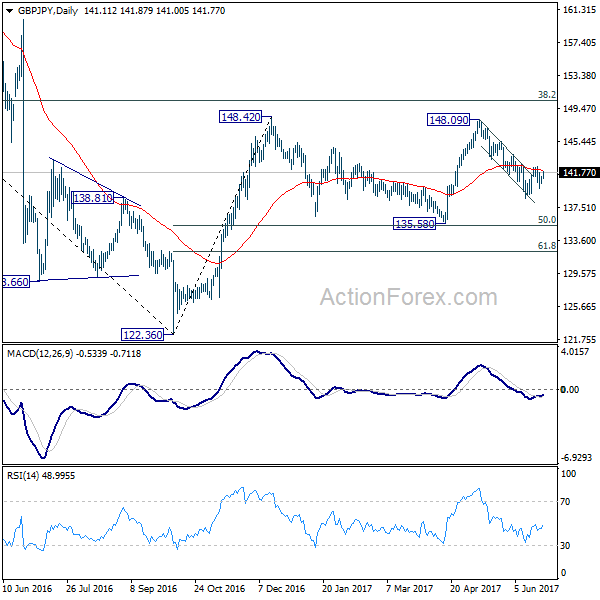
Daily Pivots: (S1) 141.04; (P) 141.46; (R1) 141.92; More....
GBP/JPY recovers today but stays below 142.75 resistance so far. Intraday bias remains neutral first. on the downside, below 138.65 will resume the decline from 148.09. But in that case, we'd look for bottoming signal around 135.58, which is close to 135.39 fibonacci level, to bring rebound. On the upside, break of 142.75 should confirm completion of the fall from 148.09 and turn bias back to the upside for this resistance.
In the bigger picture, while the fall from 148.09 is deeper than expected, we're not bearish in the cross yet. Price action from 148.42 is possibly developing into a sideway pattern with fall from 148.09 as the third leg. Deeper decline could be seen but we're looking for strong support from 135.58 and 50% retracement of 122.36 to 148.42 at 135.39 to contain downside. Rise from 122.36 is still mildly in favor to resume at a later stage. However, sustained break of 135.58/39 will confirm reversal and target a retest on 122.36 low.
Global Economic Optimism Continues
Global equities moved higher on Monday as optimism continued to improve on global economic growth.
However, USD remained somewhat subdued in early trading as the outlook for US inflation remains tenuous as restrictive bond yields continue to raise concerns about the Federal Reserve's strategy to tighten their economic policy. In general, markets think the pace of its tightening will be much slower than policymakers want.
The EUR had little impact following the news over the weekend that Italy began winding up 2 failed Venetian banks on Sunday in a deal that is likely to cost the country nearly €17 Billion. Earlier the German IFO posted a reading of 106.8 better than the consensus of 106.4 and the previous reading of 106.5, showing a continued optimistic view of Eurozone Business confidence. EURUSD traded around 1.1200 after the release and the 7-month high, set earlier this month at 1.1296, could be tested if EUR buying momentum, and typical end of month USD selling gather momentum.
Oil prices moved higher after having fallen for five weeks in a row over concerns OPEC-led production cuts have failed to ease a global crude glut stemming in part from increased U.S. oil production. The Baker Hughes report, issued last week, showed US energy firms added 11 new Oil Rigs in the week to June 23rd. This takes the total rig count to 785 which is the most since April 2014. WTI was trading around $43.60pb and Brent at $46.25pb. Markets believe that $40 will provide some support as US shale production will likely abate if it breeches this level.
USDJPY fell 0.2% to trade around 111.55. GBPUSD added to its 1% four-day gain as sterling moved higher trading around 1.2750. After 3 successive days of gains Gold fell back 0.3% trading around $1,247 in early trading.
US Durable goods will be released today at 13:30 BST and are expected to shoe a 0.6% decline which is likely to indicate that US consumers are only slightly rebounding and inflation is not likely to rise further which, in turn, adds more credence to the Federal Reserve holding off on any near-term rise in US interest rates.
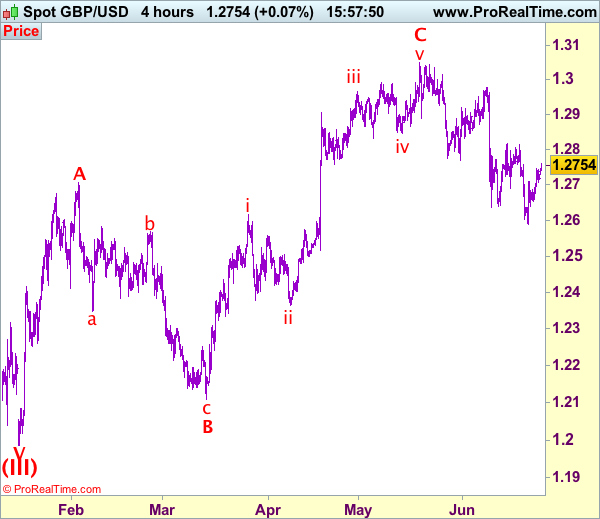
Trade Idea: GBP/USD – Buy at 1.2660
GBP/USD – 1.2738
Recent wave: Wave V of larger degree wave (III) has ended at 1.1986 and major correction has commenced from there for gain to 1.3000 and 1.3140-50
Trend: Near term down
New strategy :
Buy at 1.2660, Target: 1.2810, Stop: 1.2600
Position: -
Target: -
Stop:-
As sterling has maintained a firm undertone after staging a strong rebound from 1.2589 (last week’s low), suggesting low has been formed there and consolidation with mild upside bias is seen for gain towards resistance at 1.2818, however, a sustained breach above there is needed to add credence to this view and suggest recent decline from 1.3048 has ended at 1.2589, then headway to 1.2850-60 would follow.
Our preferred count on the daily chart is that cable's rebound from 1.3500 (wave (A) trough) is unfolding as a wave (B) with A ended at 1.7043, followed by triangle wave B and wave C as well as wave (B) has ended at 1.7192, the subsequent selloff is the larger degree wave (C) which is still unfolding with minor wave (III) of larger degree wave 3 ended at 1.1986, hence wave (IV) correction is in progress which could either be a triangle wave (IV) of a complex formation but upside should be limited to 1.3500 and price should falter well below 1.4000, bring another decline in wave (V) of 3 for weakness to 1.1500, then 1.1200.
On the downside, expect pullback to be limited to 1.2660-70 and support at 1.2640 should hold, bring another rebound later. Only a drop below 1.2640 would suggest the rebound from 1.2589 has ended, bring retest of this level, break of this support would revive bearishness and signal recent decline from 1.3048 top has resumed for retracement of early upmove to 1.2550, then towards previous support at 1.2515.
Daily Technical Analysis: EUR/JPY Flat Top Ascending Triangle Formation
The EUR/JPY has formed a flat top ascending triangle formation on H1 time frame, which suggests a possible continuation of bullish trend. Each triangle is a form of consolidation before the breakout, while the ascending triangle is a sign of uptrend. At this point we can see that the double top has been broken so we have 2 possible rejection points. First one is DT retest point 124.65. If the price retraces to the level we might see another bounce towards W H4/D H5 confluence 125.23. The break of 125.23 aims for 125.60. If the price make a pullback inside a triangle formation again than we might see a POC rejection 124.30-40 ( W L3, EMA89, ATR Pivot, D L3) towards above mentioned levels.
Connect with Nenad Kerkez T on Facebook for latest market updates.
W L3 - Weekly Camarilla Pivot (Weekly Interim Support)
W H3 - Weekly Camarilla Pivot (Weekly Interim Resistance)
W H4 - Weekly Camarilla Pivot (Strong Weekly Resistance)
M H4 - Monthly Camarilla Pivot (Very Strong Monthly Resistance)
M L3 – Monthly Camarilla Pivot (Monthly Support)
M L4 – Monthly H4 Camarilla (Very Strong Monthly Support)
POC - Point Of Confluence (The zone where we expect price to react aka entry zone)
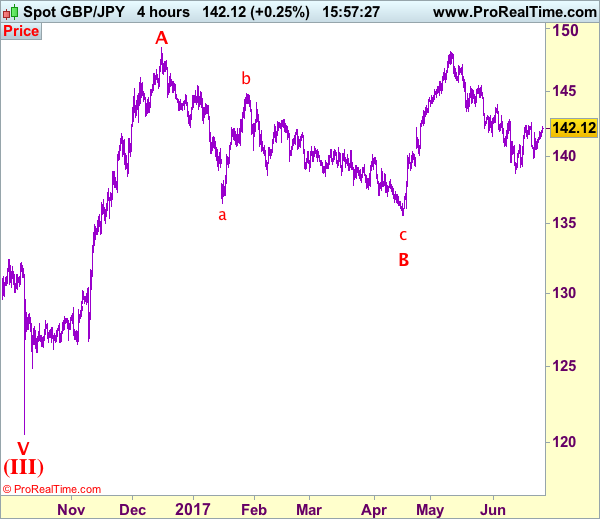
Trade Idea: GBP/JPY – Buy at 141.45
GBP/JPY - 142.20
Recent wave: Medium term low formed at 120.50 and (A)-(B)-(C) major correction has commenced with (A) leg ended at 148.45, hence wave (B) is unfolding for retreat to 131.00-10.
Trend: Near term down
New strategy :
Buy at 141.45, Target: 143.45, Stop: 140.85
Position: -
Target: -
Stop:-
As sterling has risen again after brief pullback to 141.35, suggesting a test of resistance at 142.50 would be seen, however, break there is needed to retain bullishness and signal the erratic rise from 138.70 is still in progress for test of indicated previous resistance at 142.75, above there would signal recent decline has ended and encourage for at least a strong retracement of recent selloff to 143.05-10, then 143.50 but price should falter below previous resistance at 143.95.
In view of this, we are looking to buy sterling on pullback as support at 141.35 should limit downside and bring another rise. Below 140.95 would risk weakness to 140.45-50 but only break there would signal the rebound from 139.85 has ended bring another test of this level first. Looking ahead, only break there would suggest the aforesaid erratic rise fro 138.70 is over, bring further fall to 139.15 support first.
Our preferred count is that larger degree wave V with circle is unfolding from 251.12 with wave (I) 219.34, (II): 241.38 and wave (III) is subdivided into 1: 192.60, 2: 215.89 (23 Jul 2008) and wave 3 ended at 118.87 earlier in 2009. The correction from there to 162.60 is wave 4 which itself is a double three and is labeled as first a-b-c ended at 151.53, followed by wave x at 139.03, 2nd a ended at 162.60, 2nd b at 146.75 and 2nd c leg of wave 4 ended at 163.00. Therefore, the decline from 163.00 to 116.85 is now treated as wave 5 which also marked the end of larger degree wave (III), hence wave (IV) major correction has commenced for retracement of the wave (III) from 241.38 and upside target at 183.95-00 (50% Fibonacci retracement of the wave (II) from 241.38) had been met, a drop below 160.00 would suggest wave (IV) has ended at 195.85, bring decline in wave (V) for initial weakness to 130 (already met) and 120.
EUR/USD Analysis: Squeezed In On Monday
As the title states, the common European currency is trading in a set range against the US Dollar on Monday morning. The pair was fluctuating between the support of the 38.20% Fibonacci retracement level at the 1.1188 level and the fresh first weekly resistance at the 1.1204 mark. Meanwhile, the pair is showing contradicting signals regarding its future direction. In a long term a decline of the Euro against the Buck is still expected. In regards to the short term, the pair is still trading in the borders of an ascending channel pattern. However, the upper trend line of the channel up pattern has recently been confirmed, which means that in the next 24 hours a decline of the pair might occur. The rate could fall down to the 1.1161 level. Although, there are various support levels, which could hinder the decline.
GBP/USD Analysis: Tests Monthly S1 At 1.2758
Despite being tied down by bearish technical indicators, GBP/USD managed to push through a descending trend-line and the 200-hour SMA. The combined support of the given SMA and the 23.6% Fibo did provide strong support for the Pound, restricting its move below the 1.2720 mark. During the first hours of this session, the pair has demonstrated reluctance to move above the monthly S1; however, indicators suggest that there is still some upside potential. The pair has been trading in a channel down for the last two weeks and has approached the upper channel boundary. Thus, it may be hindered or even reversed by the 38.2% Fibo at 1.2770. Meanwhile, the US is to release m/m durable goods orders at 1230 GMT that may provide downward pressure on the pair.
USD/JPY Analysis: Demonstrates Potential Up To 111.80
On Friday, a lack of strong market movers put USD/JPY in a small trading range in the 111.20/40 area. The pair was stopped several times by the 20– and 55-hour SMAs, restraining a move above the 111.30 mark. In this session, however, the US Dollar passed the both SMAs to test the upper channel boundary. It is likely that the American currency breaks the given line and appreciates against the Yen, as the sideways momentum demonstrates mitigated downside risks. By and large, upside potential may be realised up to the monthly PP at 111.80. The downside limit may be provided by a support cluster formed by the 55– and 200-day SMAs apparent on the daily chart circa 111.00. Meanwhile, the US is to release m/m durable goods orders at 1230 GMT that may provide upside pressure on the pair.
Gold Analysis: Continues In Set Pattern
The yellow metal lost ground on Monday morning. However, the commodity price remained in the ascending channel pattern, which is guiding the rebound from the support of a long term pattern. The Monday morning decline of the bullion was a bounce off from the channel up pattern's resistance line. It is most likely that during the day the yellow metal will find support either in the 55 and 200-hour SMAs, respectively, at 1,253.57 and 1,254.29 and/or in the monthly PP, which is located at the 1,253 mark. A rebound against the pivot point would be consistent with the channel up pattern. Afterwards the next target for the commodity would be the 1,264 mark, where the weekly R1 is located at. Moreover, it has to be noted that the monthly PP is also supported by the weekly pivot point at 1,252.57.
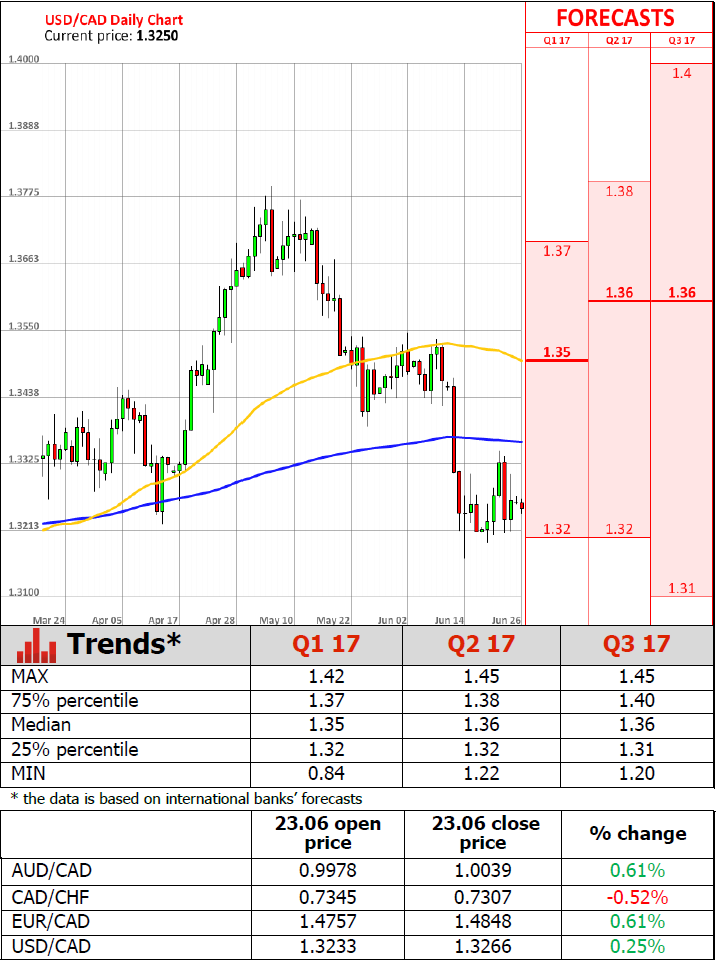
Canadian Consumer Inflation Slows More Than Expected In May
'Certainly very modest core inflation continues to rumble in the background as a pretty strong reason for the bank not to rush the proceedings. That story was just pounded home today.' - Doug Porter, Bank of Montreal
Canadian consumer prices rose less than expected last month, moving away from the Bank of Canada's inflationary target of 2%. Statistics Canada reported on Friday that its CPI advanced 0.1% month-over-month in May, following the prior month's increase of 0.4% and falling behind analysts' expectations for a 0.2% rise. On an annual basis, consumer inflation climbed 1.3%, the lowest since November 2016, in May, down from the preceding month's gain of 1.6%, whereas analysts anticipated an increase of 1.5%. In the meantime, core consumer prices climbed 0.1% in May, up from the previous month's 0.0%. Analysts suggested that due to weak inflation data the Central bank would likely leave it policy and interest rates unchanged at its next meeting in July. Nevertheless, a rate hike by the end of this year remained on the table. The Bank has been holding rates at a record low of 0.50% since 2015, when it was forced to lower rates due to the sharp oil price fall. Food prices dropped 0.1% in May, marking the eighth straight monthly decline, whereas gasoline prices rose 6.8%, following the prior month's climb of 15.9%.