

Sample Category Title
Trade Idea : USD/CHF – Stand aside
USD/CHF - 0.9691
Most recent candlesticks pattern : N/A
Trend : Near term up
Tenkan-Sen level : 0.9697
Kijun-Sen level : 0.9698
Ichimoku cloud top : 0.9726
Ichimoku cloud bottom : 0.9717
New strategy :
Stand aside
Position : -
Target : -
Stop : -
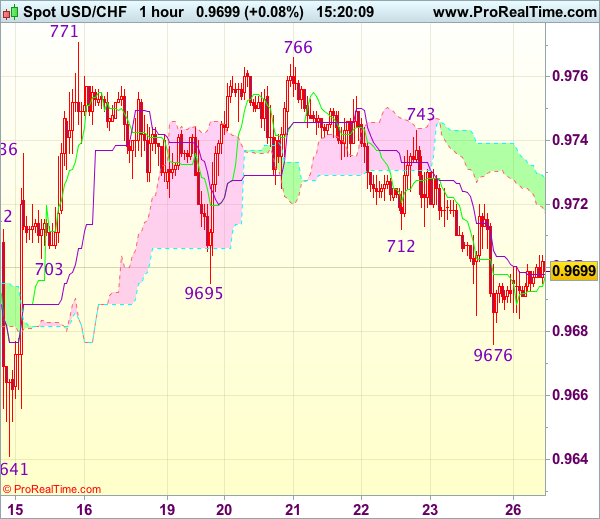
Last week’s selloff below previous support at 0.9695 signals the erratic fall from 0.9771 top is still in progress and near term downside risk remains for this move to bring retracement of recent rise, hence further weakness to 0.9660 would be seen, however, as broad outlook remains consolidative, still reckon downside would be limited to 0.9641 support, risk from there is seen for another rise to take place later.
On the upside, expect recovery to be limited to resistance at 0.9720 and price should falter below resistance at 0.9743, bring another decline later. Only a firm break above resistance at 0.9743 would revive bullishness and signal low is formed, bring test of 0.9766-71 resistance first. Once this resistance is penetrated, this would confirm recent rise from 0.9613 low has resumed for test of resistance at 0.9808, then towards another previous resistance at 0.9825.
Foreign Exchange Market Commentary: EUR/USD, USD/JPY, GBP/USD, GOLD, WTI CRUDE, DJIA, FTSE100, DAX
EUR/USD
The EUR/USD pair recovered ground on Friday, to close the week pretty much unchanged right below 1.1200. It's been the second consecutive weekly doji for the pair, with the absence of key macroeconomic drivers and rising uncertainty leaving speculative interest clueless on what's next. Fed's speakers were behind dollar's late decline as St. Louis Fed President James Bullard said that the Fed can afford pausing raising rates, and wait for Washington before making next move. Indeed, Bullard is a well-known dove, but Cleveland Fed President Loretta Mester, a hawk, said that there is no "immediate need" to tighten monetary policy, although she added that considers recent slowdown in inflation is temporary. Adding to dollar's weakness, were soft readings in new home sales up just by 2.9% in May amid rising prices, and preliminary June Markit PMIs, coming below market's expectations, and at multi-month lows.
The week ahead has plenty of data to offer, with the US offering Durable Goods Orders a GDP revision, and more relevant, core PCE inflation, among others. In the EU, attention will center in Germany, with the IFO survey and inflation revisions leading the list. There are no Central Banks meetings or big speakers scheduled, but these lasts can surprise the market any time.
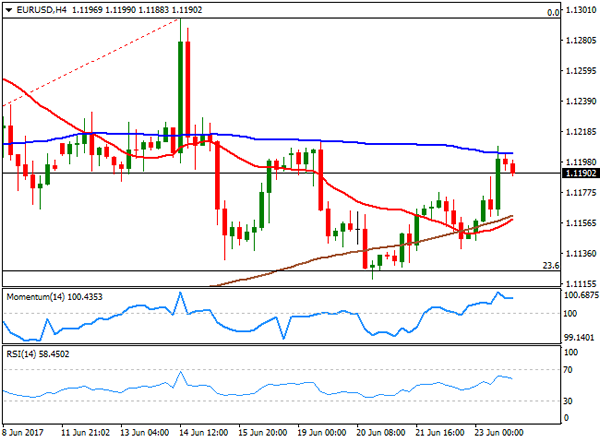
Technically, the pair has been confined to the lower half of its 5-week range of 1.1100/1.1300, building bearish pressure, but held ground, amid lack of dollar's demand. The daily chart shows that the pair found buying interest around the 23.6% retracement of its latest bullish run around 1.1125, with a previous relevant low having been set at 1.1109, making of the area a critical support to break to confirm additional declines ahead. In the same chart, the price was unable to advance beyond a horizontal 20 DMA, the immediate resistance, whilst technical indicators have managed to turn higher within neutral territory, lacking momentum. In the 4 hours chart, the 20 and 200 SMAs converge around 1.1160, reinforcing a static support area, whilst technical indicators eased modestly within positive territory. Overall, the downside potential seems limited, despite diminishing EUR's buying interest.
Support levels: 1.1160 1.1110 1.1075
Resistance levels: 1.1220 1.1260 1.1300
USD/JPY
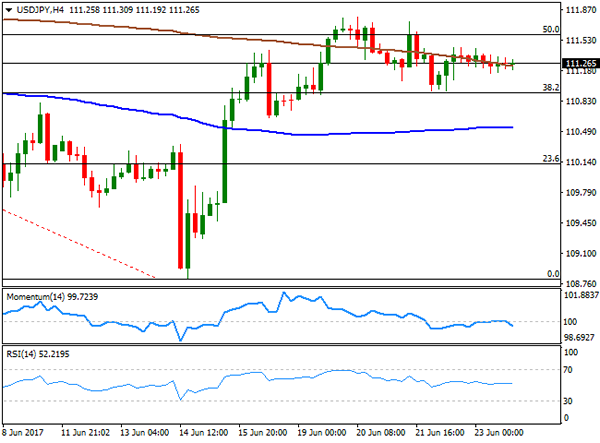
The USD/JPY pair closed the week higher at 111.26, although with a third consecutive doji on Friday, as investors struggled to find a driver. Soft US data released on Friday offset early Fed's speakers hawkish stance, while a worse-than-expected manufacturing index in Japan prevented the JPY from appreciating, as the Nikkei Flash Japan PMI fell to a seven-month low of 52.0 in June from 53.1 in May, also missing expectations of 53.4. Japan will release its May inflation data next Thursday, expected modesty higher. Despite the BOJ has said that it plans to maintain its accommodative policy, higher inflation may trigger speculation of retrieving easing sooner than expected. In the meantime, the daily chart shows that the price met selling interest on approaches to the 100 DMA, currently converging with the 50% retracement of the latest daily slide around 112.00, while technical indicators head nowhere, but remain within positive territory. Shorter term, the 4 hours chart presents a neutral-to-bearish stance, with the price stuck around a modestly bearish 200 SMA, and technical indicators heading marginally lower around their mid-lines. A critical support comes at 110.90, the 38.2% retracement of the mentioned rally, with a break below it favoring a bearish extension towards the 110.00 region.
Support levels: 110.90 110.50 110.10
Resistance levels: 111.60 112.00 112.45
GBP/USD
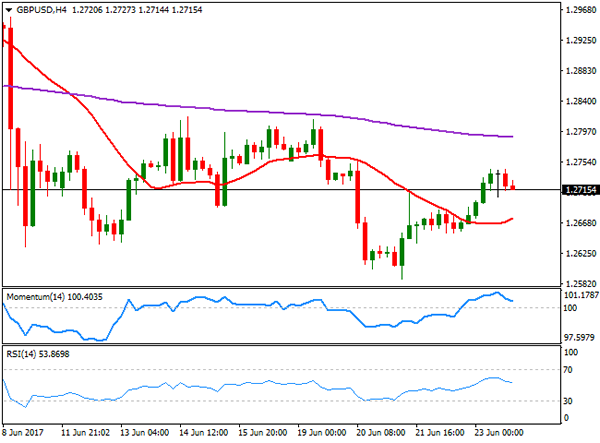
The GBP/USD pair closed up for a third consecutive day on Friday at 1.2715, still down for the week. Theresa May has been unable to form a government so far, raising concerns over her ability to retain the UK's leadership, with news indicating the DUP is not ready to support her sending the pair to a two months low of 1.2588 mid-week. The rally was reverted by BOE's Haldane, who said he could vote for a rate hike in the next meeting, after voting to keep them on hold the last one. That will mean that at least half of the MPC is ready to tighten amid rising inflation, against Governor's Carney call for patient. On Friday, the kingdom released its CBI Industrial Trends Survey, up to 16, its highest since 1988, indicating strength in the manufacturing sector and partially helping to neutralize political concerns. Technically, the risk remains towards the downside, given that in the daily chart, the price remains below a strongly bearish 20 SMA now at 1.2785, whilst the Momentum indicator remains flat within negative territory and the RSI indicator heads marginally higher around 43. In the 4 hours chart, the price is above a modestly bullish 20 SMA, while technical indicators retreat within positive territory, not enough to confirm a bearish move ahead.
Support levels: 1.2665 1.2635 1.2590
Resistance levels: 1.2750 1.2785 1.2830
GOLD
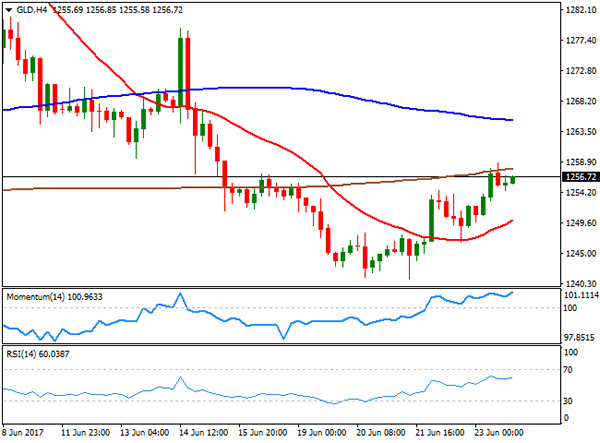
Spot gold trimmed all of its early losses and closed the week with modest gains at $1,256.72 a troy ounce amid lackluster dollar's performance, and uncertainty over the upcoming Fed's move. Despite softening inflation in the US, monetary policymakers have been sending mixed signals over next move, most supporting further hikes ahead, in spite of poor data. Markets are not yet convinced over another hike in the current macroeconomic environment, and weakening equities helped gold to bounce. In the daily chart, the price has settled above a flat 100 DMA, but still trades below a modestly bearish 20 DMA, this last at 1,265.01, whilst technical indicators have managed to bounce from near oversold levels, heading higher, but still well-below their mid-lines. In the 4 hours chart the commodity presents a bullish stance, with technical indicators resuming their advances within positive territory and the price firmly above a bullish 20 SMA. The 200 SMA caps the upside, providing an immediate resistance at 1,258.00.
Support levels: 1,252.40 1,241.95 1,230.90
Resistance levels: 1,258.00 1,265.10 1,273.90
WTI CRUDE OIL
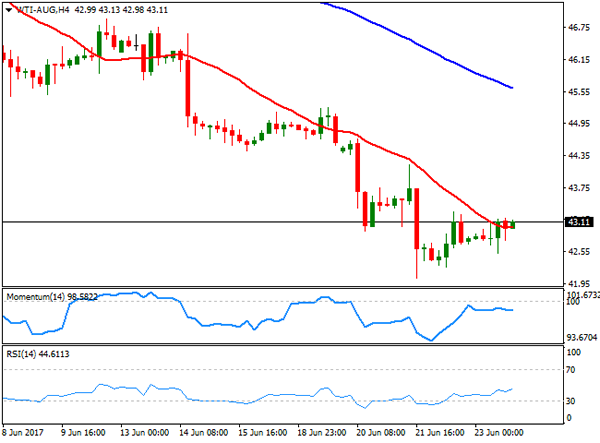
West Texas Intermediate crude oil futures closed in the red for a fifth consecutive week and at its lowest since November 2016, when the OPEC announced its output cut deal. WTI traded as low as 42.04 before bouncing modestly to settle at $43.11 a barrel on Friday. The commodity was weighed by rising concerns of a worldwide glut, on news production increased in different productive countries. Within the OPEC, Libya and Nigeria rose their output, both countries exempt from the cut, while in the US, the Baker Hughes report released on Friday showed that the number of active rigs drilling for oil rose by 11 to 758 this past week, marking a 23nd consecutive weekly advance. In the daily chart, the latest recovery looks merely corrective, given that the price remains far below all of its moving averages, with the 20 SMA heading sharply lower, now around 45.60, the RSI indicator aiming higher but still in oversold territory, and the Momentum also heading north, but well-below its mid-line. In the 4 hours chart, technical indicators have managed to correct oversold conditions, but lost upward strength and turned flat below their mid-lines, whilst the price is stuck around a bearish 20 SMA, in line with the longer term perspective.
Support levels: 42.70 42.10 41.65
Resistance levels: 43.35 43.80 44.50
DJIA
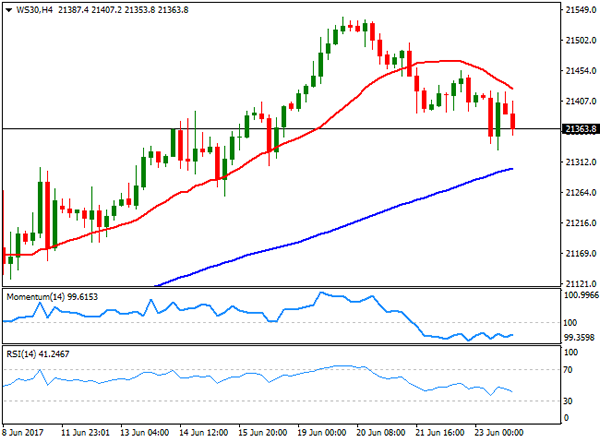
Wall Street closed mixed on Friday, with the DJIA down 2 points to 21,394.76, but the Nasdaq Composite up 0.46%, to 6,265.25, and the S&P also in the green, up by 4 points to 2,438.30. US indexes closed the week with small gains, with tech and energy-related equities on the rise. Back stocks, on the other hand, were undermined by a flattening yield curve. Within the Dow, Visa led advancers with a 1.73% gain, followed by Boeing that added 1.40%. Home Depot shed 2.68% being the worst performer, followed by Goldman Sachs that shed 1.17%. The daily chart for the DJIA shows that the index held above a still bullish 20 SMA, currently at 21,294, whilst technical indicators kept retreating within positive territory, although with limited downward momentum. In the 4 hours chart, the benchmark is below a bearish 20 SMA, whilst the Momentum indicator heads nowhere below its 100 level, as the RSI indicator heads lower around 41, all of which favors a downward extension on a break below the mentioned support.
Support levels: 21,389 21,351 21,303
Resistance levels: 21,449 21,495 21,542
FTSE100
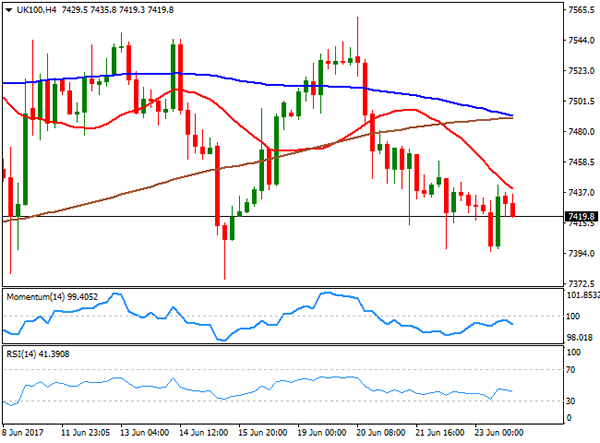
The FTSE 100 shed 15 points on Friday to end at 7,424.13, down for a third consecutive week. A stronger Pound weighed on the Footsie, alongside with oil prices, as despite bouncing modestly at the end of the week, the commodity settled at a multi-month low. The best performer was ITV, up 3.34% after receiving a rating upgrade from Morgan Stanley, from equal-weight to overweight, followed by Fresnillo that added 2.88%. Smurfit Kappa led decliners with a 2.48% loss, followed by Shire that shed 2.32%. In the daily chart, the index is still trading above a bullish 100 DMA, currently at 7,380, but the 20 DMA gains bearish strength above the current level, whilst technical indicators lack directional strength within bearish territory, leaning the scale towards the downside. In the 4 hours chart, the London benchmark presents a bearish stance, with the 20 SMA presenting a strong downward slope and capping advances around 7,440, and technical indicators having turned south after failing to overcome their mid-lines.
Support levels: 7,403 7,376 7,327
Resistance levels: 7,440 7,499 7,541
DAX
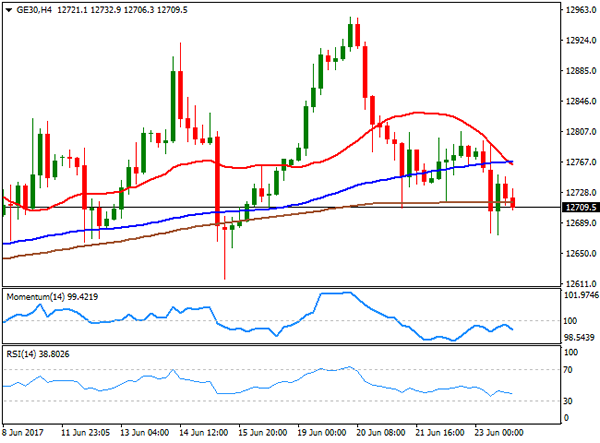
The German DAX closed the week lower, down on Friday by 60 points, to 12,733.41. Most major European indexes closed lower in the last day of the week, amid a decline in healthcare and utilities stocks. Within the German benchmark, only five components closed in the green, with Deutsche Lufthansa leading the winners' list with a 1.04% gain, followed by Vonovia that added 0.39%. RWE AG was the worst performer, down 2.49%, followed by E.ON that shed 1.29%. Banks and carmakers were also trading heavily across the region. In the daily chart, the index has settled right below a modestly bullish 20 SMA, whilst technical indicators turned lower within neutral territory, with the Momentum limited, but the RSI gaining downward traction around 48, this last anticipating some further slides ahead. In the 4 hours chart, the index closed below all of its moving averages, with the 20 SMA crossing below the 100 SMA far above the current level, and technical indicators having turned south within negative territory, also supporting additional declines ahead.
Support levels: 12,674 12,638 12,604
Resistance levels: 12,748 12,805 12,851
Trade Idea : GBP/USD – Stand aside
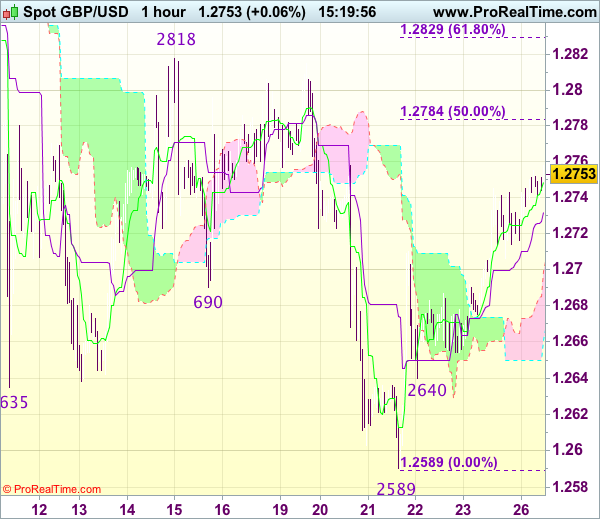
GBP/USD - 1.2755
Most recent candlesticks pattern : N/A
Trend : Near term down
Tenkan-Sen level : 1.2750
Kijun-Sen level : 1.2733
Ichimoku cloud top : 1.2699
Ichimoku cloud bottom : 1.2661
New strategy :
Stand aside
Position : -
Target : -
Stop : -
As cable has continued moving higher after last week’s strong rebound from 1.2589, suggesting near term upside risk remains for this move to bring retracement of recent decline to 1.2780-85 (50% Fibonacci retracement of 1.2978-1.2589), however, reckon upside would be limited to 1.2800 and price should falter below resistance at 1.2818, bring another selloff later.
In view of this, would not chase this move here and would be prudent to stand aside for now. Below 1.2705-10 would suggest an intra-day top is formed, bring weakness towards 1.2675-80 but break of latter level is needed to signal the rebound from 1.2589 has ended, bring retest of this level later.
Currencies: Dollar Still Awaiting A Trigger For A Directional Move
Sunrise Market Commentary
- Rates: Slow start ahead of key events, but Italian underperformance?
We start the week with a neutral bias as markets will focus on Yellen's speech (tomorrow) and German/US inflation readings (both on Friday). Italian BTP's could underperform following the Italian state's rescue of 2 regional lenders and as the center-right's gains in municipal elections could further tangle up the political landscape. - Currencies: Dollar still awaiting a trigger for a directional move
Last week, there was no clear guide for USD trading, leaving EUIR/USD and USD/JPY in tight ranges. This process might still continue at the start of this week. US data surprise or clear CB guidance is probably needed to unlocked this stalemate. Sterling feels conflicting influences from lingering political uncertainty, but hawkish BoE talk.
The Sunrise Headlines
- US stock markets ended flat (Dow Jones) to 0.5% higher (Nasdaq) in the final session of an uneventful week. Overnight, Asian stock markets record similar gains with China outperforming (up to +1%).
- Italian authorities said they were prepared to spend as much as €17B as part of the shutdown of two regional banks, in a deal that will transfer the lenders' best assets to Intesa for a nominal sum.
- Italy's centre-right opposition was poised for an emphatic victory in municipal races around the country, bolstering its hopes of a political resurgence and dealing a blow to Matteo Renzi's ruling centre-left Democratic party
- Fitch affirmed Belgium's AA- rating (stable outlook) saying that the high debt ratio balances against the substantial net creditor position, strong governance indicators, high income per capita and macroeconomic stability.
- The Bank for International Settlements warned in its annual report that rising protectionist sentiment and a retreat from global cooperation on economic matters would threaten the world economy.
- US President Trump made calls to fellow Republicans in the US Senate to mobilize support for their party's healthcare overhaul while acknowledging the legislation is on a "very, very narrow path" to passage.
- Today's eco calendar contains the German Ifo-indicator and US durable goods orders. The US Treasury holds a $26B 2-yr Note auction
Currencies: Dollar Still Awaiting A Trigger For A Directional Move
Dollar still waiting for a directional trigger
Dollar cross rates didn't show much spirit on Friday. USD/JPY kept a tight range near 111.30. EUR/USD moved slightly higher, from around 1.1150 to 1.1180. The short term (2y) interest rate differential between US/German narrowed from 200 bps on Monday to 196 bps on Friday. Reuters sources indicated that scarcity of German government bonds is a key ECB consideration for deciding on extending QE. It limits the possibility of a major extension. The rumours maybe underpinned the single currency, but it is a long shot.
This morning, Asian equities trade with moderate gains, as the Tech rally continues. A gradual rebound of the oil price is also slightly supportive. However, the direct impact of equities on USD trading is again small. USD/JPY opened soft, but reversed the initial dip and trades again in the 111.30 area. EUR/USD is trading little changed in the 1.1190 area.
Eco calendar heats up, Fed speakers take the stage
The June German IFO business sentiment is expected little changed. The weakening of the services PMI suggests some downside risks, even if the composition of both measures of sentiment is different. The US durable orders are expected to have dropped by 0.6% in May, following a drop in April. It follows strong readings in February/March. The more important orders excluding transportations are expected to have rebounded 0.4% M/M. The ECB holds its forum in Sintra on investment and growth. The subject contains lots of interesting items that touch monetary policy, but policy itself is not the subject. We expect few comments with direct on impact markets, but one never knows with such conference.
In a day-to day perspective, the data (Ifo and US durables) at the margin might be USD supportive, but it is highly unlikely that they will change the broader picture. Late in the session, the headlines from the ECB forum will filter trough. If there would be suggestions on policy normalisation on a more global scale, it could be slightly more supportive for the euro and the yen rather than for the dollar. However, all these considerations are highly hypothetical. So, we start the week with a neutral bias for EUR/USD trading. The positive risk sentiment might protect the downside of USD/JPY, but it didn't cause any meaningful gains of late.
Technical picture: USD still confined to tight ranges
Early May, EUR/USD failed to break below the 1.0821/1.0778 support (gap). Poor US data and US political upheaval propelled EUR/USD north of the 1.1023 range top. The pair tested the 1.1300 area going into the FOMC decision, but the test was rejected. The Trump top/correction top at 1.1300/1.1366 proved to be a solid resistance. USD sentiment will have to become really negative to clear this hurdle. EUR/USD 1.1110 is a first minor support. A return below 1.1023 would indicate that the upside momentum has eased.
The USD/JPY rally ran into resistance in early May. A mini sell-off mid-May made the short-term picture negative, driving the pair further down in the 108.13/114.37 range. The post-Fed USD rebound pushed the pair beyond a first minor resistance at 110.81. A break beyond the 112.13 correction top would improve the ST-picture. The day-to-day sentiment improved slightly of late, but we remain cautious to forecast a U-turn.
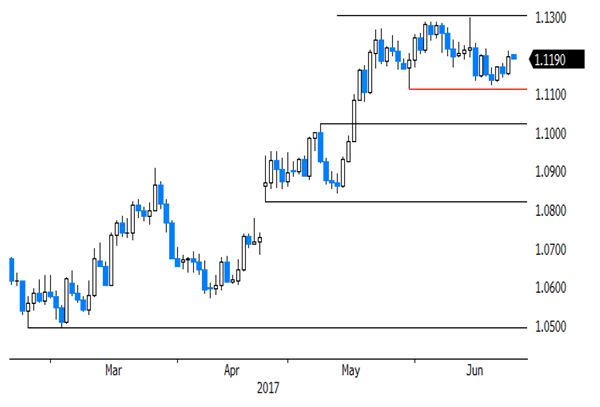
EUR/USD: test off 1.1300/66 resistance rejected, but correction remains modest. First support at 1.1110 holds
EUR/GBP
Sterling balanced by BoE speak and political uncertainty
On Friday, sterling initially profited from the hawkish farewell speech of resigning BoE Forbes. The recent sequence of events (BoE meeting – Carney comments – Haldane speech) triggered a significant rethinking in rate hike expectations. The probability of a 25 bps hike by the BoE this year rose from 6.5% on June 14 to 50% Friday. However, sterling gains remained modest as official Brexit-talks started on a bad note. EU Tusk said that PM May's opening offer on EU nationals living in the UK is below expectations. Sterling's fortunes changed throughout the day with EUR/GBP reversing the earlier decline to close the session in again in the 0.88 area.
Today, the eco calendar only contains the BBA loans for home purchases. The focus for sterling trading will be on Brexit negotiations and on PM May trying to find support for her minority government. The results of the exchange of views on the rights of EU citizens in the UK didn't go really smooth. On the other hand, the debate within the BoE might give sterling some downside protection, especially when UK eco data remain relatively strong. So, for now we expect EUR/GBP to hold its sideways consolidation pattern in the 0.88 area.
From a technical point of view, EUR/GBP extensively tested the 0.8854 area (2017 top), but a real break didn't occur. BoE comments caused some volatility recently. In the end, the 0.8854/66 resistance remains within reach. A break would open the way to the 0.90 area. A return below the 0.8655 correction low would indicate easing pressure on sterling. Such a break lower will be difficult. A EUR/GBP buy-on-dips approach remains favoured
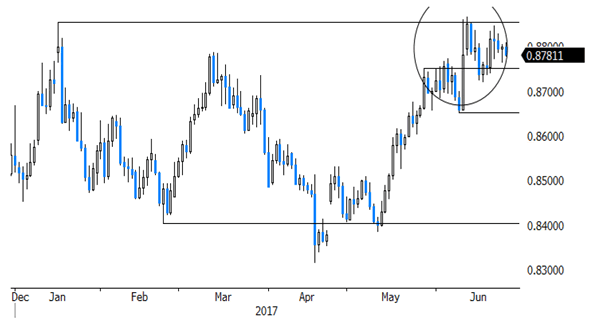
EUR/GBP: sterling rebounds temporary on BoE comments, but the 0.8854/66 resistance stays within reach.
Trade Idea : EUR/USD – Stand aside
EUR/USD - 1.1203
Most recent candlesticks pattern : N/A
Trend : Near term down
Tenkan-Sen level : 1.1195
Kijun-Sen level : 1.1185
Ichimoku cloud top : 1.1159
Ichimoku cloud bottom : 1.1153
New strategy :
Stand aside
Position : -
Target : -
Stop : -
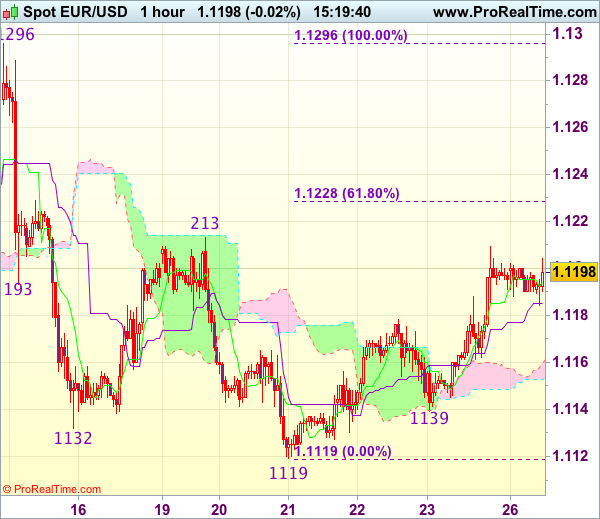
The single currency has maintained a firm undertone after last week’s rebound from 1.1119, suggesting near term upside risk remains for this rebound to extend gain to 1.1213 resistance, then towards 1.1228-30 ((61.8% Fibonacci retracement of 1.1296-1.1119), however, reckon upside would e limited to 1.1260-70 and price should falter well below resistance at 1.1296, bring retreat later.
In view of this, would not chase this rise here and would be prudent to stand aside for now. Below the Kijun-Sen (now art 1.1185) would bring weakness towards 1.1139 support but break there is needed to revive bearishness and signal top is formed, bring retest of 1.1119.
Trade Idea : USD/JPY – Buy at 110.65
USD/JPY - 111.48
Most recent candlesticks pattern : N/A
Trend : Near term up
Tenkan-Sen level : 111.36
Kijun-Sen level : 111.32
Ichimoku cloud top : 111.35
Ichimoku cloud bottom : 111.26
Original strategy :
Buy at 110.65, Target: 111.65, Stop: 110.30
Position : -
Target : -
Stop : -
New strategy :
Buy at 110.65, Target: 111.65, Stop: 110.30
Position : -
Target : -
Stop : -
Although the greenback has rebounded after finding support at 110.95 last week and gain towards resistance at 111.79 (last week’s high) cannot be ruled out, break there is needed to signal recent upmove has resumed and extend headway to 111.90-95 (50% projection of 108.82-111.42-110.65), however, upside should be limited to resistance at 112.13 and 112.25 (61.8% Fibonacci retracement of 114.37-108.82 and 61.8% projection) should hold. If said resistance at 111.79 continues to hold, then further consolidation would take place and another retreat to 110.95 cannot be ruled out, however, previous support at 110.65 would limit downside and bring another rise later.
In view of this, would not chase this rise here and we are looking to buy dollar on pullback as 110.65 support should limit downside. Below 110.30-35 (50% Fibonacci retracement of 108.82-111.79 and previous resistance turned support) would abort and signal a temporary top has been formed instead, risk weakness towards 109.95-00 (61.8% Fibonacci retracement).

Will The Range Bound Trading Continue In The Week Ahead?
Last week the financial markets experienced very low volatility in equities, fixed income, and currency exchanges. The S&P 500 moved withina 23 points trading range. Similarly, the U.S. 10-year Treasury bonds were stuck in a six basis points trading range, and FX markets were incredibly boring for many traders.
Although oil fell into a bear market, equities were slightly impacted. This is probably due to the lower weightage the energy sector represents now compared to 2014. However, if the slump in oil resumes, I think it will threaten other sectors, particularly the financials, as lower oil prices mean lower inflationary pressures and lower interest rates across developed economies, which will eventually lead to compressed profit margins for banks.
The Fed policymakers had been broadly hawkish last week, and most of them anticipate another rate hike in 2017 (most likely in December). However, fixed income markets are saying it's over for this year as they don’t see inflationary pressures coming anytime soon. It’s still too far from December, but oil prices will play a significant role on how interest rates go from here.
With valuations still high and the timetable for President Donald Trump’s fiscal policies being unpredictable, only robust earnings can support stocks. According to FactSet, the estimated earnings growth for S&P 500 is 6.6%, down from 8.7% forecast in March. Given the negative surprises in recent U.S. economic data, we might also see estimates dragged lower. Thus, bulls and bears will be cautious at this stage leading to the continuation of sideway movements in major U.S. indices.
In currency markets, the Cable will be under the spotlight. Queen Elizabeth gave approximately a one-week deadline for the vote in the House of Commons. Prime Minister Theresa May needs to strike a deal with the Democratic Unionist Party to prevent her government from falling apart. I believe there’s a high chance that she will get a deal, but if she failed to do so, GBPUSD would likely experience another fall towards 1.25, however, if she were to besuccessful, l expect to see a further recovery towards 1.29. There’s very little on U.K.’s data front, so politics will be the primary driver of the Pound.
Another interesting currency to trade is the Loonie. Despite falling oil prices, the Canadian dollar was the top performing currency past week on prospects of higher interest rates. Monetary policymakers shifted their tone to prepare markets for a rate hike. Inflation rate doesn’t support their argument as it declined to 1.3%, but with other economic data remaining robust, they will keep sending hawkish signals. Governor Poloz, will be joined by ECB’s Mario Draghi, BOJ’s Haruhiko Kuroda, and BoE’s Mark Carney on a panel discussion on Wednesday, which will likely shed some light on central bankers’ thoughts.
Brent Oil Has Climbed Slightly Higher
Market movers today
Today is a very quiet one in terms of data releases.
In the US, we are set to receive core capex goods orders for May. The new orders component has levelled off recently, in line with the general cooling of the manufacturing sector. We estimate a slight increase of 0.2% m/m in goods orders in May.
In the euro area, the German ifo expectation is due for release today. The ifo expectation increased from 105.2 in April to 106.5 in May, which is its highest level since February 2014. We expect this figure to decline to 106.1 in June, as the German ZEW and Sent ix have both declined in June, and the weakening business cycle indicators in the US and China could still weigh on the German business expectation.
Selected market news
On Friday in the euro area, PMI figures were due out . The euro area manufacturing PMI continued higher in June to 57.3 from 57.0 in May despite the weakness seen in the US and China. In our view, weaker global growth will continue to weigh on the euro area and we look for weaker headline manufacturing PMI in coming months. The service PMI came out weak at 54.7 in June from 56.3 in May, which is the lowest level since January 2017. The lower service PMI figure could reflect slower real wage growth, which has followed as inflation has picked up without nominal wage growth following suit . Looking ahead, we continue to expect this to be a headwind for consumers.
On Friday, we also got US PMI manufacturing and services for June. Manufacturing PMI fell unexpectedly to 52.1 in June (market consensus and our expectation was for a slight increase to 53) from 52.7 in May. Service PMI also came out lower than expected at 53 in June (consensus was at 53.5) from 53.6 in May.
It has been a calm session in global financial markets this morning. Asian stock markets have mainly been moving sideways, though slightly in the green and in fixed income markets, changes in the US 10-year government benchmark bond yield have been subdued since Friday. Brent oil has climbed slightly higher to around USD46/bbl at the time of writing.
What’s Next For The AUD?
Key Points:
- After a volatile week, the AUD's future is in question.
- Lack of much Australian news leaves the pair exposed to US risk events.
- Technical bias is somewhat mixed.
The AUDUSD had a rough week last week which brings into question whether or not the pair's recent rally can extend any further. Indeed, there are some early signs that the Aussie Dollar could be making a beeline for the 0.75 handle which may have the bears excited. As a result, it might be worth taking a closer look at what happened last week and what we can expect moving ahead.
The Aussie Dollar was under pressure from the get go last week, declining all the way to the 0.7539 level before things finally turned around. This bearish momentum stemmed from a number of robust US data releases that largely eclipsed the 2.2% uptick in the Aussie HPI figure and a flat MI Leading Index posting. In particular, the US Existing Home Sales result of 5.62M worked against the pair and sparked the biggest single day rout for the AUD this month. However, on Friday, the Aussie Dollar did bounce back somewhat as the US PMI data proved disappointing – subsequently causing the pair to close the week out only moderately lower at the 0.7567 handle.
As for what lies ahead, it is another quiet week on the Australian news front which will mean the US data is driving prices once gain. Of the figures due out, the GDP and Jobless Claims are likely to be the key results to watch for but some comments from Yellen could also be worth looking at as well. Most Fed members have remained rather hawkish in the wake of the recent hike which suggests that the top dog is likely to take a similar tone. If this is indeed the case, it could see selling pressure build from as early as Tuesday and this might see the AUD have yet another disappointing week.
On the technical front, the Aussie Dollar is actually relatively neutral and could go either way this week. On the one hand, the Parabolic SAR and the EMA bias are bullish – signalling that the bears may not be in complete control just yet. However, on the other hand, the pair is about to run into some fairly stiff resistance around the 0.7580 handle which may prove rather difficult for the bulls to break through in the absence of a fundamental upset. What's more, both RSI and stochastics are neutral which gives the AUD a significant degree of freedom moving forward but also indicates that it may begin to range. Importantly, resistance is present at the 0.7580, 0.7636, and 0.7679 levels whilst support will be seen at 0.7532, 0.7486, and 0.7435.
Ultimately, we can expect a fairly flat week for the AUD and the pair is likely to remain within the 0.7580 – 0.7532 range. Nevertheless, keep an eye on those fundamentals as they could disrupt the sideways movement if they come in significantly above or below expectations.
Euro Dollar Likely To Remain Flat In The Week Ahead
Key Points:
- Price action takes a largely sideways direction.
- U.S. GDP results loom and could fundamentally impact the pair.
- Watch for a break out from the consolidation pattern in the coming week.
The Euro remained relatively flat over the course of the week retaining its position within the consolidative structure to close around the 1.1191 mark. There was little on the fundamental front to change the volatility outlook but a slight sentiment swing against the greenback was evident with most of the U.S. economic data proving fractionally disappointing. Therefore, it remains to be seen if the Euro will continue to trend within the current consolidation pattern but let’s review last week’s major points with the intent of highlighting some looming risks.
The Euro entered the week with plenty of speculation that we might see an end to the low volatility period that has plagued the pair of late. However, that wasn’t to be and the pair continued to trend within the consolidative structure in a largely sideways pattern. Subsequently, the pair closed the week out largely where it started at 1.1191. However, we did see some signs of bullishness late in the week when the U.S. Manufacturing and Services PMI figures were released and showed declines to 52.1, and 53.0, respectively. This sent the Euro rising by around 40 pips but it soon ran out of lift and the move abated.
Looking ahead, the coming week has plenty of fundamental events looming that could cause volatility to return to the pair. In particular, the U.S. GDP figures are likely to be closely watched by the market given that there is some concern as to the current negative trend within the domestic economy. Subsequently, this result will need to be relatively robust to support the Fed’s current narrative around rate hikes. In addition, ECB Chair Mario Draghi is due to speak in the middle of the week and is likely to provide some illuminating comments on the current state of the Eurozone. This will be particularly interesting given that the central bank just cut the inflationary outlook for the coming few years. Ultimately, either of these statements might be enough to cause some volatility, and a breakout, for the Euro Dollar so monitor them carefully.
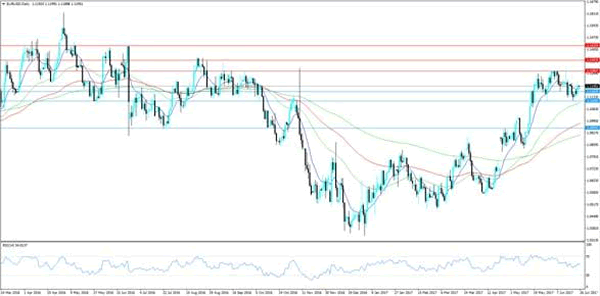
From a technical perspective, the Euro Dollar has stayed in consolidation below 1.1295 which suggests that our bias of neutral from last week remains in play. In addition, support at 1.1109 remains intact which suggests that a reversal is not yet on the cards. Ultimately, the pair will need to break out of the current structure, and develop a strong trend, before a directional bias can be highlighted. Support is currently in place for the pair at 1.1163, 1.1109, and 1.0954. Resistance exists on the upside at 1.1281, 1.1343, and 1.1425.
Ultimately, the Euro is likely to take a largely sideways direction in the week ahead until price action breaks out of the current consolidation phase. However, keep a close watch on the U.S. GDP figures as a strong result could see the 1.1109 support coming into focus.