
Sample Category Title
EUR/JPY Weekly Outlook
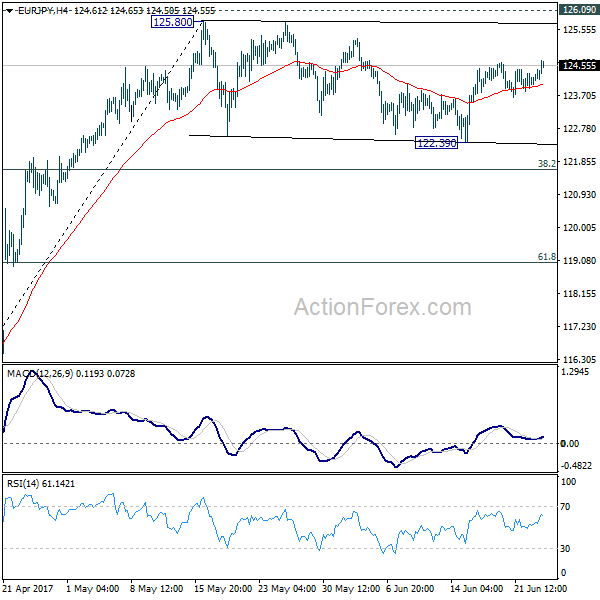
EUR/JPY's consolidation from 125.80 continued last week and outlook is unchanged. Initial bias is neutral this week first. In case of another fall, downside should be contained by 38.2% retracement of 114.84 to 125.80 at 121.61 to bring rebound and then rise resumption. On the upside, decisive break of 125.80/126.09 resistance zone will extend the whole rise from 109.03 to 100% projection of 109.03 to 124.08 from 114.84 at 129.89.
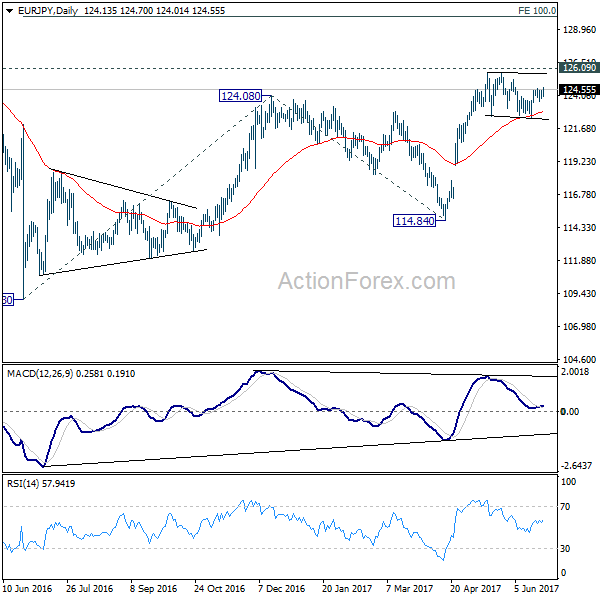
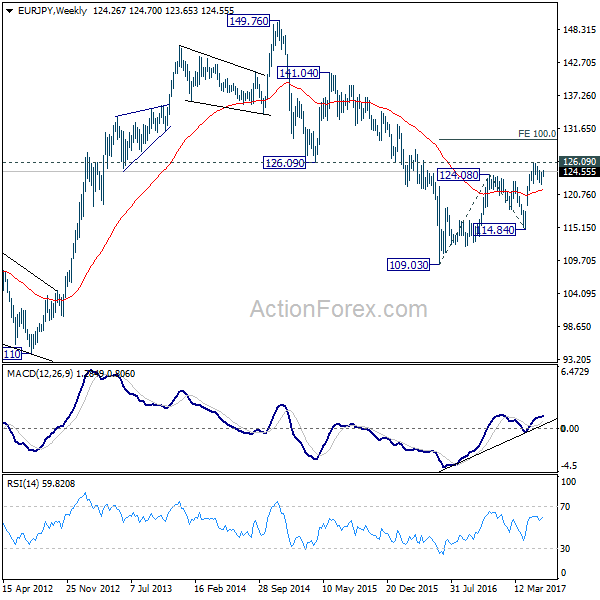
In the bigger picture, focus is staying on 126.09 support turned resistance. Decisive break there will confirm completion of the down trend from 149.76. And in such case, rise from 109.20 is at the same degree and should target 141.04 resistance and above. Meanwhile, rejection from 126.09 and break of 114.84 will extend the fall from 149.76 through 109.20 low.
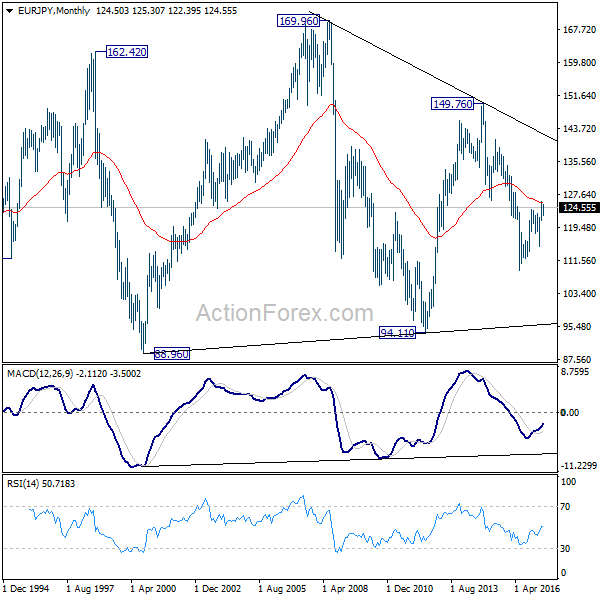
In the long term picture, medium term decline from 149.76 is seen as part of a long term sideway pattern from 88.96. We're not seeing any sign of an established long term trend yet. Hence, we'll be cautious on strong support at 94.11 in case of another fall. Also, there could be strong resistance at 149.76 in case of a medium term rise.
EUR/GBP Weekly Outlook
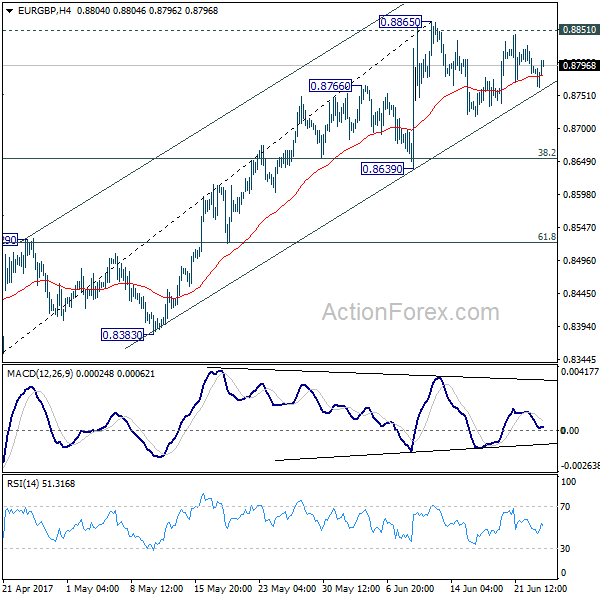
EUR/GBP stayed in consolidation below 0.8865 last week and outlook is unchanged. Initial bias remains neutral this week first. In case of another fall, downside should be contained by 0.8639 support to bring rebound. Further rise is expected and decisive of 0.8851 resistance will pave the way to retest 0.9304 high. However, break of 0.8639 support will now indicate near term topping and bring deeper pull back 0.8529 resistance turned support and below.
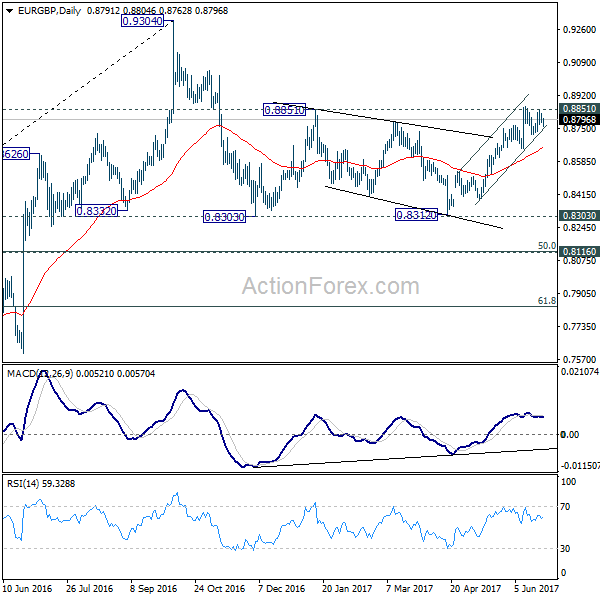
In the bigger picture, price actions from 0.9304 are viewed as a medium term corrective pattern. The leg from 0.9304 should have completed after testing 0.8332 structural support. But it's too early to say that larger rise from 0.6935 is resuming. Rejection from 0.9304 will extend the consolidation with another falling leg. Meanwhile, firm break of 0.9304 will target 0.9799 (2008 high). In case of another decline, we'd expect strong support from 0.8116 cluster support (50% retracement of 0.6935 to 0.9304 at 0.8120) to contain downside and bring rebound.
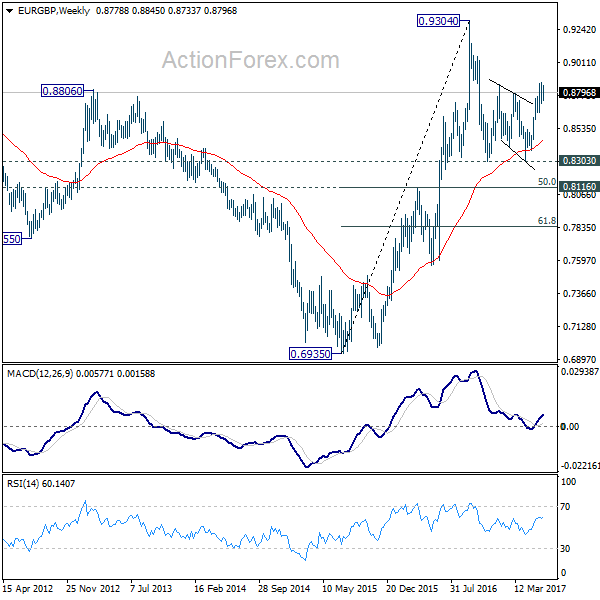
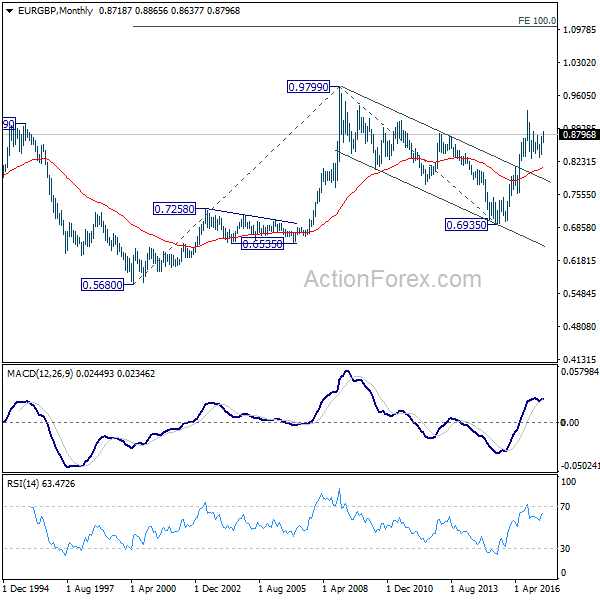
In the long term picture, firstly, price action from 0.9799 (2008 high) is seen as a long term corrective pattern and should have completed at 0.6935 (2015 low). Secondly, rise from 0.6935 is likely resuming up trend from 0.5680 (2000 low). Thirdly, this is supported by the impulsive structure of the rise from 0.6935 to 0.9304. Hence, after the correction from 0.9304 completes, we'd expect another medium term up trend to target 0.9799 high and above.
EUR/AUD Weekly Outlook
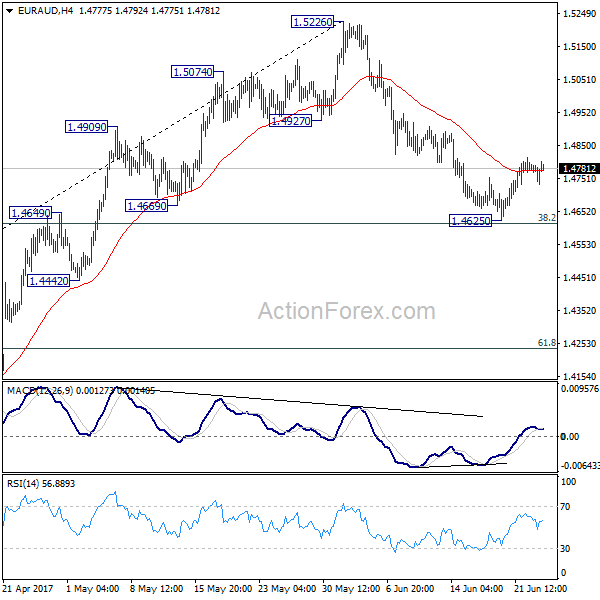
EUR/AUD dropped further to 1.4625 last week and breached 1.4669 support. But the cross quickly recovered. The development argues that pull back from 1.5226 might have completed after drawing support from 38.2% retracement of 1.3624 to 1.5226 at 1.4614. Initial bias is mildly on the upside for retesting 1.5226 high. However, sustained break of 1.4614 fibonacci level will pave the way to 61.8% retracement at 1.4236 and possibly below.
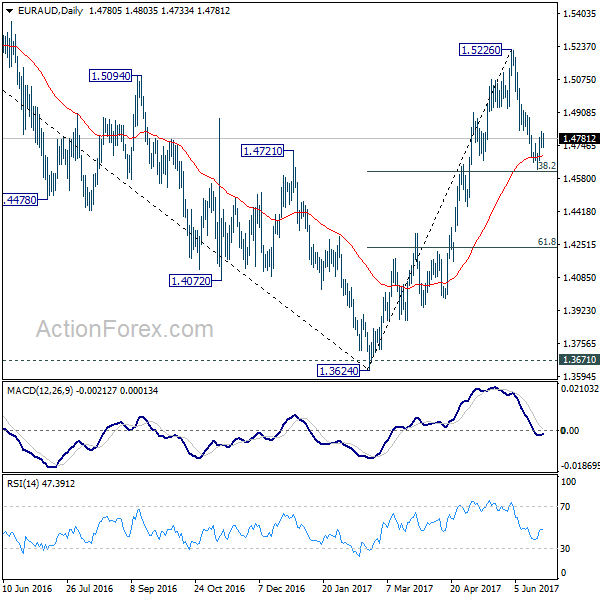
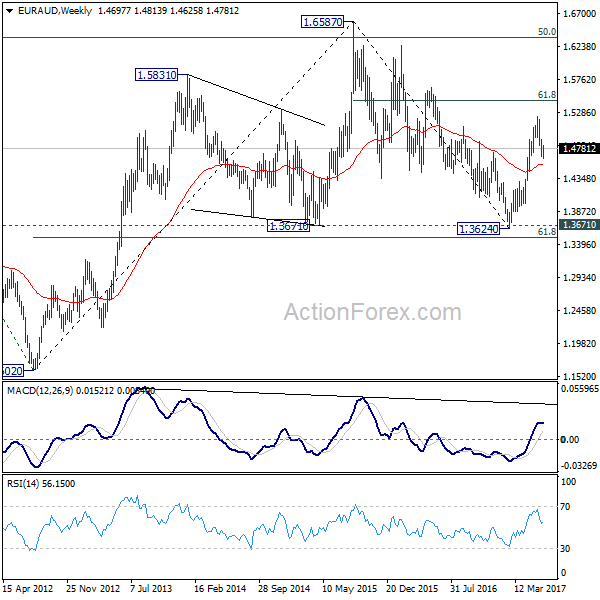
In the bigger picture, price actions from 1.6587 medium term top are viewed as a corrective pattern. Such correction should be completed at 1.3624 after defending 1.3671 key support. Rise from 1.3642 would extend to 61.8% retracement of 1.6587 to 1.3624 at 1.5455. Sustained break there will pave the way to retest 1.6587. However, sustained break of 1.4669 support will dampen this bullish view. We'll assess the outlook later after looking at the structure and depth of the pull back.
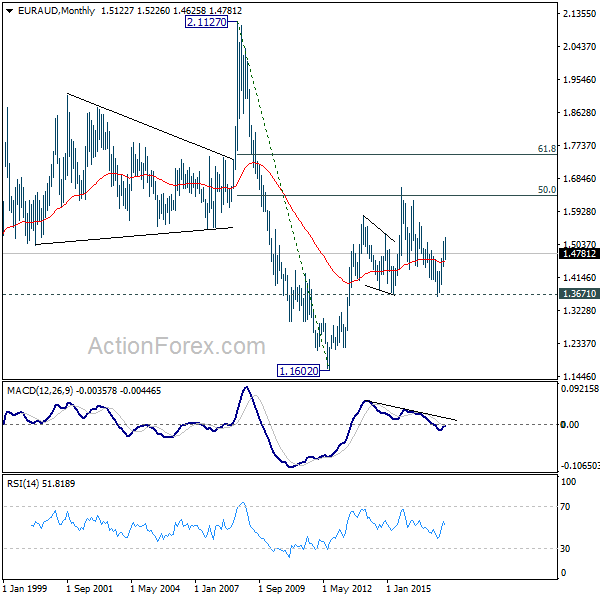
In the longer term picture, the rise from 1.1602 long term bottom isn't over yet. We'll keep monitoring the development but there is prospect of extending the rise to 61.8% retracement of 2.1127 to 1.1602 at 1.7488 and above. However, sustained trading below 1.3671 should confirm trend reversal and target 1.1602 long term bottom again.
EUR/CHF Weekly Outlook
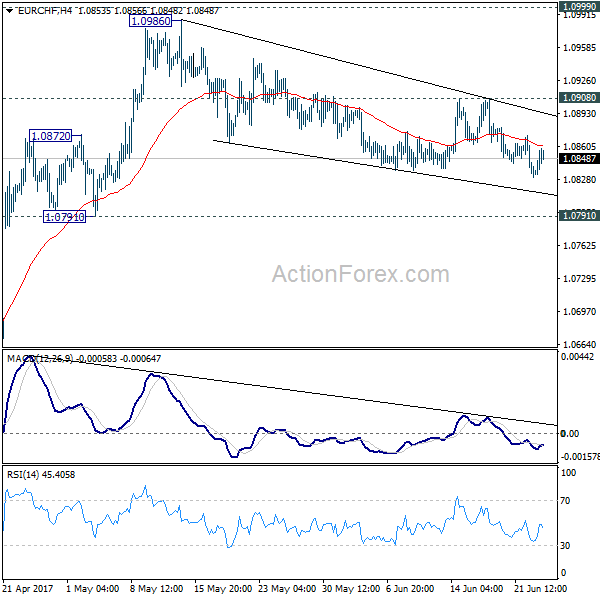
EUR/CHF's correction from 1.0986 resumed last week but dipping to 1.0830. Further decline could be seen initially this week. But we're still expecting strong support inside 1.0791/0872 support zone to contain downside and bring rebound. Break of 1.0908 resistance will argue that the correction is completed. In such case, intraday bias is turned back to the upside for retesting 1.0986/0999 resistance zone.
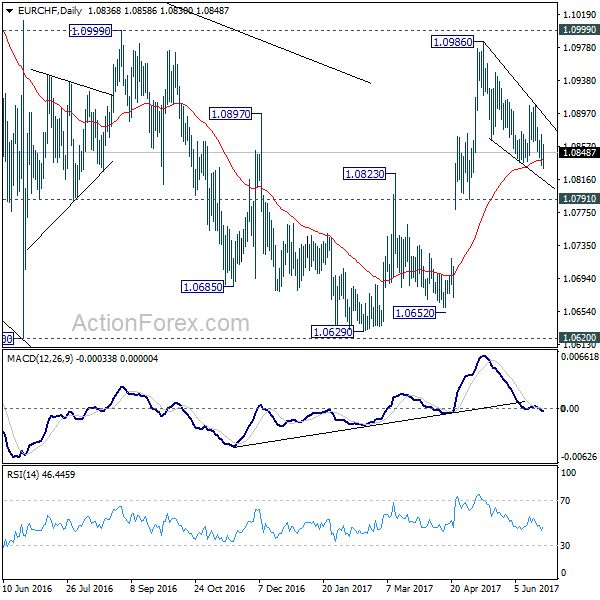
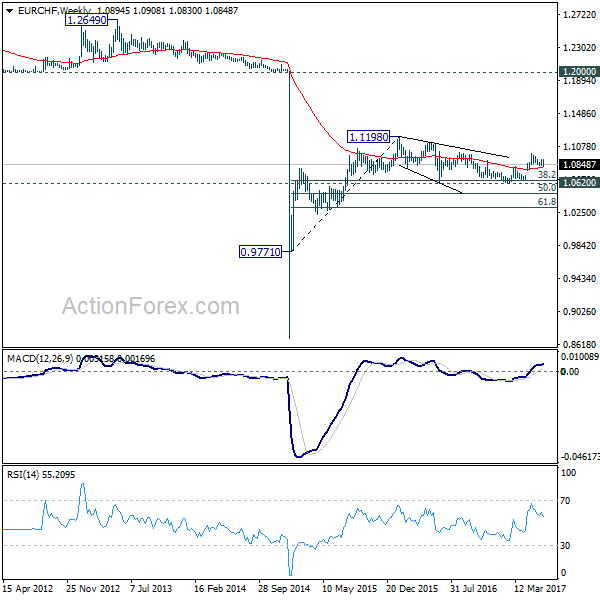
In the bigger picture, the price actions from 1.1198 are seen as a corrective move. Such correction could have completed after defending 38.2% retracement of 0.9771 to 1.1198 at 1.0653. Decisive break of 1.0999 resistance will target a test on 1.1198 high. For now, this will be the preferred case as long as 1.0791 support holds.
Divisions in Fed and BoE Boards Might Signal Changes in Monetary Policy Stances ahead
There wasn't a unified theme in the forex markets last week. Movements in the major currencies were driven by different factors. But a trend to note is that markets attentions were generally back to central banks, from politics. The divisions in Fed and BoE boards were very apparent and showed that the overall policy stances of both central banks could be shifting. Euro was mixed as it's awaiting economic data to push ECB officials to recede from being too dovish. Meanwhile, Canadian Dollar failed to extend the BoC inspired rally as rate hike bets cooled after tame inflation readings. The extended rout in oil price also added some weight to the Loonie and Aussie. New Zealand Dollar, on the other hand, ended as the second strongest one, next to Swiss Franc, on a mild RBNZ hawkish turn.
Fed officials views on inflation and rate path diverge
In US, markets were getting increasing doubtful on whether Fed will hike interest rate again in September. And the voices of doves were getting louder after three months of weak inflation reading. St. Louis Fed President James Bullard said on Friday "recent inflation data have surprised to the downside and call into question the idea that US inflation is reliably returning toward target." And his view is that inflation is not going to increase substantially "based on current estimates of the relationship between unemployment and inflation." He urged Fed to "wait and see how the economy develops before making any further adjustments to the policy rate."
Chicago Fed President Charles Evans said earlier in the week that the current environment of low inflation "supports very gradual rate hikes and slow preset reductions in our balance sheet". And, "it remains to be seen whether there will be two rate hikes this year, or three, or four or exactly when we start paring back reinvestments of maturing assets." He added that "I don't see why we would not be served to allow more time to wait." Evans also urged Fed to "assure the public that we recognize the new low-inflation environment and that we are not overly conservative central bankers who see our inflation target as a ceiling."
On the other hand, there are Fed officials who aren't concerned with the inflation undershoot. Cleveland Fed President Loretta Mester said that "inflation is on this gradual upwards path that we've been projecting for a while." And she added that "we got a couple of weak reports but fundamentally it doesn't look like demand is falling out." She sees the current "gradual reduction of accommodation" makes senses to her.
New York Fed President William Dudley didn't sound much concerned with low inflation neither. Instead, he noted that the US is "pretty close to full employment. And if labor market continues to tighten further "wages will gradually pick up". And with that "inflation will gradually get back to 2%". Regarding the economy, Dudley also expressed that he is "confident" that the expansion has "quite a long way to go".
30 year yield tumbled
Overall, the growing voice of doves is limiting Dollar's strength for rebound. 10 year yield was held in range below key near term resistance at 2.229 and maintained bearish outlook. Additional pressure was seen in 30 yield yield as oil rout continued. TYX dropped sharply to close at 2.714 last week and took out 2.781 fibonacci support firmly. 55 week EMA was also decisively taken out. The development argues that rebound from 2.102 low has completed at 3.201 after failing to push through 3.255 cluster resistance, 61.8% retracement of 3.976 to 2.102 at 3.260. There is prospect of further fall to 61.8% retracement of 2.102 to 3.201 at 2.521 and below.
Dollar index staying bearish
Dollar index recovered last week and breached 97.77 near term resistance but failed to stay above there. While a short term bottom is in place at 96.32, there is no confirmation of trend reversal yet. The index is held well below 98.85 support turned resistance and 55 day EMA at 98.18. Some more consolidations could be seen but at this point, a downside breakout remains in favor. Sustained break of 61.8% retracement of 91.91 to 103.82 at 96.46 will push DXY further lower to key cluster level at 91.91, 38.2% retracement of 72.69 (2011 low) to 103.82 (2016 high) at 91.93), before getting enough support for sustainable rebound.
Divisions also seen in BoE MPC
Similar division is seen in BoE. On the one hand, BoE Governor Mark Carney said in his Mansion House speech that "now is not yet the time to begin that adjustment" of monetary policies. He added that "different members of the MPC will understandably have different views about the outlook and therefore on the potential timing of any Bank Rate increase. But all expect that any changes would be limited in scope and gradual in pace." For him, he would like to see "the extent to which weaker consumption growth is offset by other components of demand, whether wages begin to firm, and more generally, how the economy reacts to the prospect of tighter financial conditions and the reality of Brexit negotiations."
On the other hand, BoE chief economist Andy Haldane said that partial removal of monetary stimulus would be "prudent relatively soon". And he noted that "risks associated with tightening too early, on the one hand, and too late, on the other, has swung materially towards the latter in the past six to nine months." He pointed out that "the risks of tightening too early have shrunk as growth and, to lesser extent, inflation have shown greater resilience than expected. And if policy tightened too late, this could result in a much steeper path of rate rises later on." Haldane's comments was taken seriously by the markets as firstly, he's the chief economist. Secondly, he's perceived by many as the most dovish MPC member. Thirdly, while Kristin Forbes will be released by Silvana Tenreyro, there are potentially still three MPC member, including Haldane, Ian McCafferty and Michael Saunders, that could vote for rate hike ahead.
But overall, the Pound ended the week broadly lower except versus Aussie and Loonie. It's still weighed by political uncertainties in UK as well as all the unknowns regarding Brexit. To recap, UK and EU representatives met in Brussels last week for the first formal Brexit negotiation. Agreement was made that talks until October should focus on the three issues of financial settlement, citizens rights and Northern Ireland. Further talks will be held in the weeks of July 17, August 28, September 18 and October 9. UK's Brexit Minister David Davis said he was "encouraged" by the first talks that "laid solid foundations for future discussions and an ambitious but achievable timetable". On the other hand, EU's chief negotiation Michel Barnier said that little was achieved other than setting a timetable and a structure for negotiations.
FTSE steady but stays vulnerable for reversal
FTSE 100 ended the week mildly lower and continued to test 55 day EMA. Our view on FTSE's outlook remains unchanged. Upside momentum has been diminishing clearly with bearish divergence condition in daily MACD and the terminal triangle like structure. The index is starting to be vulnerable for a trend reversal and sustained break of 55 day EMA would now put 7096.83 key support level in focus. And we'd like to point out again that the impact of Pound depreciation on corporate earnings have been fading. And the correlation of Sterling and FTSE could be turning positive. Thus, the next selloff in FTSE might be accompanied by similar selloff in the Pound. We'll keep an eye on such development.
Loonie weighed down by oil rout
Elsewhere, Canadian Dollar struggled to find the needed fuel for extending it's BoC inspired rally. The Loonie was boosted earlier this month by the hawkish turn of BoC Governor Stephen Poloz. There was a chance to extend recent rise after last week's strong retail sales report. But tamer than expected May inflation reading quickly knocked down the rally attempt. On the background, extended sell off in oil price was also weighing down the Canadian Dollar. WTI crude oil's dive through 38.2% retracement of 26.05 to 55.24 at 44.09 is opening up the case for deeper fall through 40 handle to 61.8% retracement at 37.20. USD/CAD could extend the near term consolidation from 1.3164 if weakness in oil price persists.
Aussie turning weak quietly
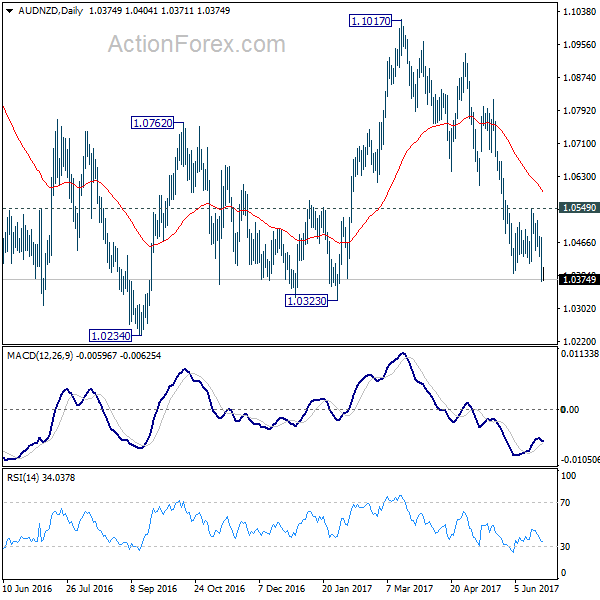
Aussie also turned a bit weaker last week without any apparent reason. Selloff in AUD/NZD after RBNZ could be a factor dragging Aussie down. Weakness in iron ore price and softening Chinese demand is seen as another factor. But the overall outlook of Aussie in the currency markets is a bit mixed. On the one hand, AUD/NZD's near term down trend has just resumed and is on course for 1.0323 support first and then 1.0234. EUR/AUD is also trying to draw support from 1.4614 fibonacci level and 55 day EMA to rebound. On the other hand, AUD/USD is held above 0.7523 support so far and maintains near term bullishness. Development in Aussie ahead is worth a watch.
Trading strategy: Hold USD/CAD short, EUR/GBP Long, Eye on Aussie
Regarding trading strategy, we're holding on to USD/CAD short (sold at 1.3510, stop at 1.3400). There is no clear sign of reversal yet. Price actions from 1.3164 low are corrective and suggests further fall ahead. Hence, we'll just hold on to the position unchanged. We're still expecting medium term decline through 1.2460 low. But for near term, it's getting more likely that there would be support above 1.2968 (61.8% retracement of 1.2460 to 1.3793 at 1.2969). Hence, we'll look to take profit on next decline and sell again later. Stay tuned.
Also, we're holding on to EUR/GBP long (bought at 0.8740, stop at 0.8640). Consolidative price actions from 0.8865 is affirming out bullish view for extension of rise from 0.8312. We'll stay long in the cross and expect further rally to retest 0.9304 high. And, we'll look at the momentum of the next rise to determine the chance of a break of 0.9304 in medium term.
Meanwhile, we'll start to look at Aussie short opportunities but keep our hands off first.
GBP/USD Weekly Outlook
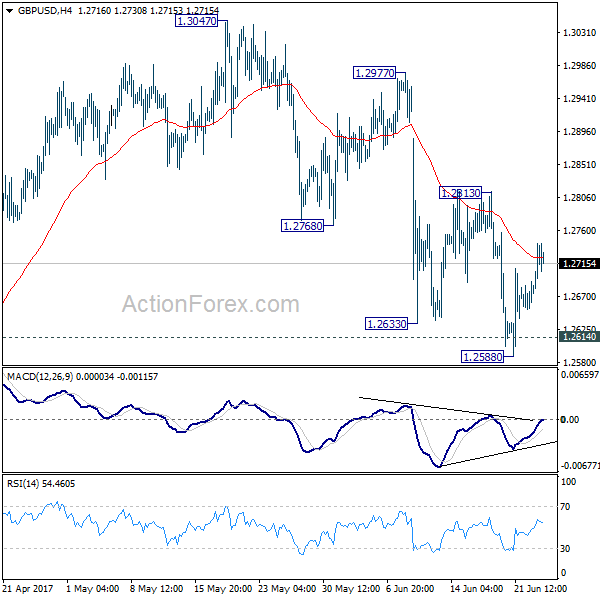
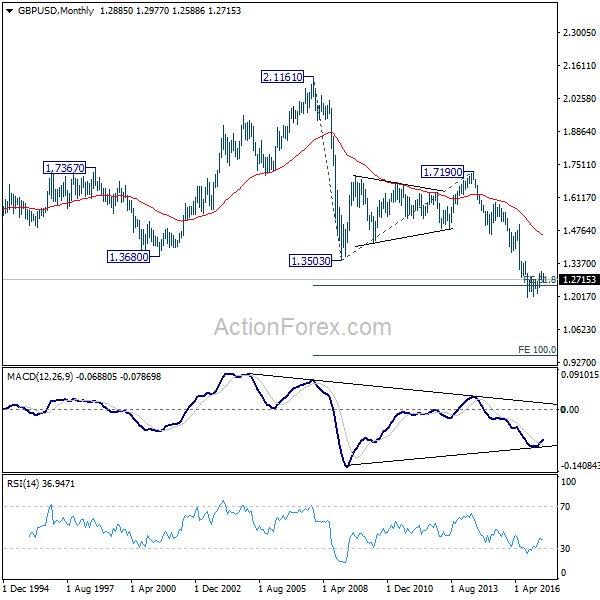
GBP/USD dropped to 1.2588 last week and breached 1.2614 key support level but recovered. Upside of rebound was limited below 1.2813 resistance and outlook is unchanged. Initial bias remains neutral this week first. At this point, we still favor the case that consolidation pattern from 1.1946 has completed at 1.3047 already. Sustained break of 1.2614 should confirm our bearish view and target a test on 1.1946 low next. However, break of 1.2813 resistance will dampen our view and turn bias back to the upside for 1.3047 and above.
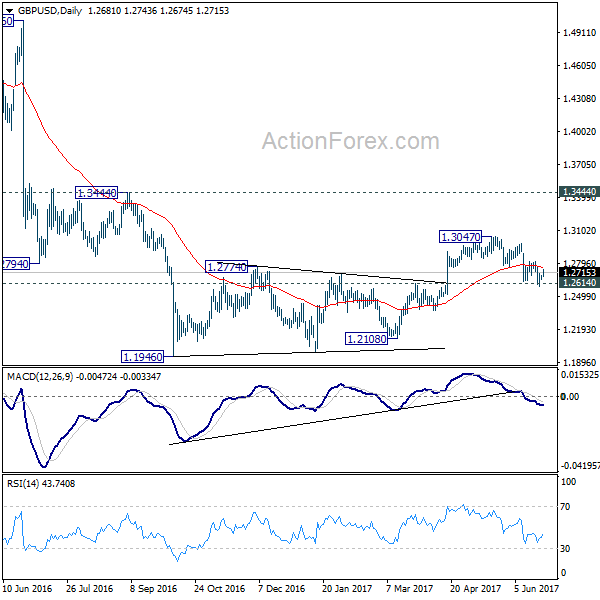
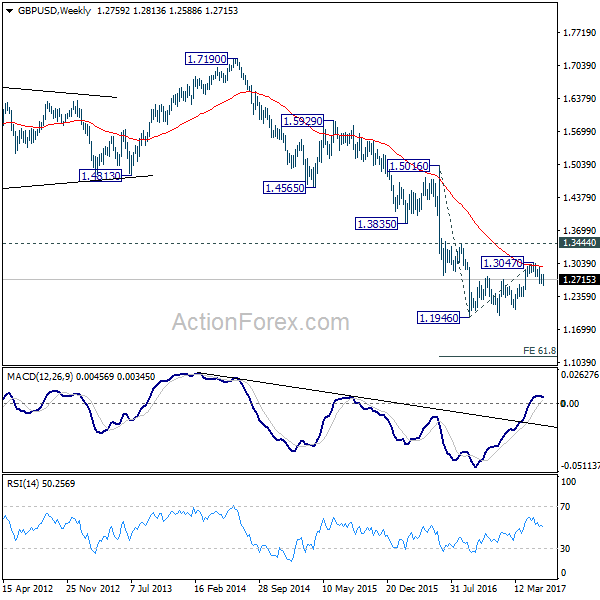
In the bigger picture, fall from 1.7190 is seen as part of the down trend from 2.1161. Price actions from 1.1946 medium term low are seen as a consolidation pattern, which could have completed at 1.3047 after hitting 55 week EMA. Break of 1.1946 low will target 61.8% projection of 1.5016 to 1.1946 from 1.3047 at 1.1150 next. In case the consolidation from 1.1946 extends, outlook will stay remain bearish as long as 1.3444 resistance holds.
In the longer term picture, no change in the view that down trend from 2.1161 is still in progress. On resumption, such decline would extend deeper to 100% projection of 2.1161 to 1.3503 from 1.7190 at 0.9532.
Eco Data 6/30/17
[php_everywhere] [/php_everywhere]
Eco Data 6/29/17
[php_everywhere] [/php_everywhere]
Eco Data 6/28/17
[php_everywhere] [/php_everywhere]
Eco Data 6/27/17
[php_everywhere] [/php_everywhere]
Eco Data 6/26/17
[php_everywhere] [/php_everywhere]