
Sample Category Title
Aussie Dollar Trading On A Stronger Footing This Morning
AussFor the 24 hours to 23:00 GMT, the AUD rose 0.29% against the USD and closed at 0.7570 on Friday.
LME Copper prices rose 0.7% or $38.0/MT to $5774.0/MT. Aluminium prices declined 0.2% or $4.0/MT to $1868.0/MT.
In the Asian session, at GMT0300, the pair is trading at 0.7581, with the AUD trading 0.15% higher against the USD from Friday’s close.
The pair is expected to find support at 0.7556, and a fall through could take it to the next support level of 0.7532. The pair is expected to find its first resistance at 0.7594, and a rise through could take it to the next resistance level of 0.7608.
With no economic releases in Australia today, trading trend in the Aussie Dollar is expected to be determined by global macroeconomic factors.
The currency pair is trading above its 20 Hr and 50 Hr moving averages.e Dollar trading on a stronger footing this morning

Euro-Zone’s Manufacturing Sector Activity Accelerated In June, While Services Sector Growth Cooled In The Same Month
For the 24 hours to 23:00 GMT, the EUR rose 0.34% against the USD and closed at 1.1196 on Friday, after the Euro-zone's flash Markit manufacturing PMI unexpectedly rose to a level of 57.3 in June, expanding at its fastest pace in more than six years, thus suggesting that robust manufacturing sector will help drive growth in the region's economy. Market participants had expected the PMI to drop to a level of 56.8, following a level of 57.0 in the previous month. On the other hand, the region's preliminary Markit services PMI dropped more-than-expected to a five-month low level of 54.7 in June, after registering a reading of 56.3 in the previous month, while investors had envisaged it to ease to a level of 56.1.
Separately, activity in Germany's manufacturing sector eased less-than-expected to a level of 59.3 in June, compared to market expectations of a fall to a level of 59.0. In the previous month, the PMI had recorded a level of 59.5. Further, the nation's services sector expanded at its weakest pace in 5 months in June, after the PMI surprisingly eased to a level of 53.7, defying market consensus for the PMI to remain steady at a level of 55.4 registered in the prior month.
The greenback ended lower against its major peers on Friday, after weaker-than-expected US manufacturing and services sector data pointed to a slowdown in the world's largest economy.
Data showed that the US preliminary Markit manufacturing PMI unexpectedly eased to a level of 52.1 in June, hitting its lowest level in nine months and confounding market consensus for an advance to a level of 53.0. In the previous month, the PMI had recorded a reading of 52.7. Moreover, the nation's services sector growth eased to a 3-month low level of 53.0 in June, higher than market expectations of a drop to a level of 53.5. In the preceding month, the PMI had recorded a reading of 53.6. On the contrary, the nation's new home sales rebounded less-than-anticipated by 2.9% on a monthly basis in May, compared to a revised fall of 7.9% in the preceding month.
Meanwhile, St. Louis Federal Reserve (Fed) President, James Bullard, stated that the Fed should wait on further rate hikes until inflation was moving towards the central bank's target.
In the Asian session, at GMT0300, the pair is trading at 1.1194, with the EUR trading slightly lower against the USD from Friday's close.
The pair is expected to find support at 1.1163, and a fall through could take it to the next support level of 1.1132. The pair is expected to find its first resistance at 1.1217, and a rise through could take it to the next resistance level of 1.1240.
Going ahead, investors will keep a close watch on Germany's Ifo expectations and business climate indices, both for June, slated to release in a few hours. Moreover, the US flash durable goods orders for May, due to release later in the day, will be on investors' radar.
The currency pair is showing convergence with its 20 Hr moving average and trading above its 50 Hr moving average

Pound Trading Higher, Ahead Of UK’s BBA Mortgage Applications Data
For the 24 hours to 23:00 GMT, the GBP rose 0.23% against the USD and closed at 1.2727 on Friday, after the British Prime Minister, Theresa May, offered European Union (EU) citizens the right to stay in the UK in exchange for Britons to stay in the EU, thus raising the likelihood for a softer Brexit.
In the Asian session, at GMT0300, the pair is trading at 1.2751, with the GBP trading 0.19% higher against the USD from Friday's close.
The pair is expected to find support at 1.2710, and a fall through could take it to the next support level of 1.2670. The pair is expected to find its first resistance at 1.2773, and a rise through could take it to the next resistance level of 1.2796.
Going ahead, traders would look forward to Britain's BBA mortgage applications data for May, slated to release in a few hours.
The currency pair is trading above its 20 Hr and 50 Hr moving averages.

Bank Of Japan (BoJ) Must Communicate Clearly On Policy Thinking: BoJ Summary Of Opinions
For the 24 hours to 23:00 GMT, the USD slightly declined against the JPY and closed at 111.26 on Friday.
In the Asian session, at GMT0300, the pair is trading at 111.29, with the USD trading a tad higher against the JPY from Friday’s close.
Earlier today, the Bank of Japan (BoJ) summary of opinions report from its June meeting showed that policymakers broadly agreed to stick to the central bank’s current policy stance in order to hit the 2.0% inflation target. Also, some officials urged on the central bank to clearly communicate about its thinking on monetary policy.
The pair is expected to find support at 111.17, and a fall through could take it to the next support level of 111.05. The pair is expected to find its first resistance at 111.39, and a rise through could take it to the next resistance level of 111.49.
The currency pair is showing convergence with its 20 Hr and 50 Hr moving averages.

Switzerland’s Economic Growth Will Likely Slowdown In 2017: KOF Institute
For the 24 hours to 23:00 GMT, the USD declined 0.18% against the CHF and closed at 0.9694 on Friday.
The KOF Economic Institute, in its Summer Forecast, reduced Switzerland's economic growth forecast to 1.3% for 2017, down from 1.5% projected in March.
In the Asian session, at GMT0300, the pair is trading at 0.9695, with the USD trading marginally higher against the CHF from Friday's close.
The pair is expected to find support at 0.9674, and a fall through could take it to the next support level of 0.9653. The pair is expected to find its first resistance at 0.9718, and a rise through could take it to the next resistance level of 0.9741.
The currency pair is showing convergence with its 20 Hr moving average and trading below its 50 Hr moving average.

Canada’s Annual Inflation Came In Weaker-Than-Expected In May
For the 24 hours to 23:00 GMT, the USD rose 0.32% against the CAD and closed at 1.3266 on Friday.
The Canadian Dollar weakened against the US Dollar, after data indicated that Canada's consumer price index (CPI) climbed less-than-anticipated by 1.3% on an annual basis in May, compared to market expectations for a rise of 1.5%, thus diminishing the odds of an interest rate hike next month. In the previous month, the CPI had advanced 1.6%.
In the Asian session, at GMT0300, the pair is trading at 1.3264, with the USD trading marginally lower against the CAD from Friday's close.
The pair is expected to find support at 1.3214, and a fall through could take it to the next support level of 1.3164. The pair is expected to find its first resistance at 1.3311, and a rise through could take it to the next resistance level of 1.3358.
The currency pair is showing convergence with its 20 Hr and 50 Hr moving averages.

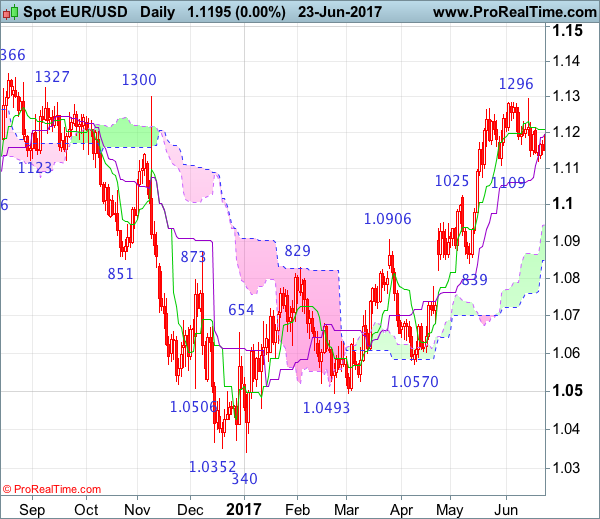
EUR/USD Candlesticks and Ichimoku Analysis
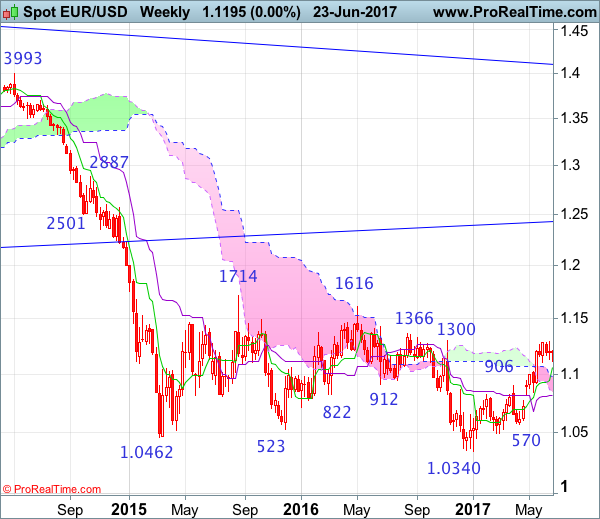
Weekly
• Last Candlesticks pattern: Shooting star
• Time of formation: 03 May 2016
• Trend bias: Down
Daily
• Last Candlesticks pattern: Shooting star
• Time of formation: 3 May 2016
• Trend bias: Sideways
EUR/USD – 1.1191
As the single currency retreated after rising to 1.1296 earlier this month, a shooting star was formed on the daily and 1-2 weeks of consolidation below this level would be seen and although initial downside risk is seen for pullback to 1.1110-20, reckon downside would be limited to 1.1020-25 and bring another rise later, above said resistance at 1.1296 would extend recent upmove from 1.0340 low to previous resistance at 1.1327, however, overbought condition should limit upside to previous chart resistance at 1.1366 and reckon 1.1440-50 would hold from here.
On the downside, whilst initial pullback to previous support at 1.1109 is likely, reckon downside would be limited to 1.1025 (previous resistance now support) and bring another rise later. Below 1.0950-60 would defer and suggest a temporary top has been formed at 1.1296 and bring correction of recent rise to 1.0900, however, still reckon downside would be limited and price should stay well above support at 1.0839.
Recommendation: Buy at 1.1025 for 1.1225 with stop below 1.0925
On the weekly chart, euro traded in relatively narrow range after meeting resistance at 1.1296, retaining our view that consolidation below this level would be seen and pullback to 1.1109 support cannot be ruled out, however, a weekly close below the Tenkan-Sen (now at 1.1068) is needed to suggest a temporary top is formed there, bring retracement of recent rise to the upper Kumo (now at 1.0984), then towards 1.0920-25, however, reckon downside would be limited to 1.0850-60 and previous support at 1.0839 would hold from here, bring rebound later.
On the upside, above said resistance at 1.1296-00 would signal the rise from 1.0340 low is still in progress and bring a test of previous resistance at 1.1366 but a break of this level is needed to signal early downtrend has ended at 1.0340, bring further subsequent rise to 1.1428, then towards 1.1500, having said that, price should falter well below another previous chart resistance at 1.1616.
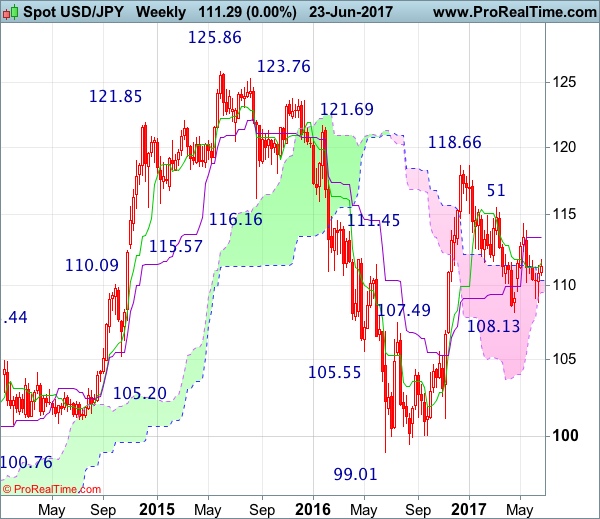
USD/JPY Candlesticks and Ichimoku Analysis
Weekly
• Last Candlesticks pattern: Marubozu
• Time of formation: 14 Nov 2016
• Trend bias: Down
Daily
• Last Candlesticks pattern: Shooting star
• Time of formation: 15 Feb 2017
• Trend bias: Down
USD/JPY – 111.31
As dollar staged a strong rebound after falling marginally to 108.82, suggesting low has possibly been formed there and consolidation with mild upside bias is seen for gain to 111.80, then towards 112.25-30 (61.8% Fibonacci retracement of 114.39-108.82), however, reckon upside would be limited to 112.90-00 and bring retreat later this week or early next month.
On the downside, whilst pullback to the Kijun-Sen (now at 110.48) is likely, reckon downside would be limited to 110.00-10 and bring another rebound later. Only below said support at 108.82 would abort and signal the fall from 114.39 is still in progress and may extend weakness towards recent low at 108.13 which is likely to hold from here due to oversold condition, risk from there is seen for another rebound later.
Recommendation : Sell at 112.25 for 110.25 with stop above 113.25 or buy at 110.00 for 112.00 with stop below 109.00.

On the weekly chart, Dollar’s rebound after finding good support at 108.82 formed a white candlestick with a long lower shadow, suggesting low has possibly been formed there and consolidation with upside bias is seen for gain to 111.80, then towards 112.25-30 (61.8% Fibonacci retracement of 114.39-108.82), however, reckon upside would be limited to 112.90-00 and price should falter below the Kijun-Sen (now at 113.37), bring another decline later.
On the downside, expect pullback to be limited to 110.00-10 and bring another rise later. Below 109.85-90 would bring weakness to 109.25-30 but break there is needed to revive bearishness and signal the rebound from 108.82 has ended, bring retest of this level, break there would extend weakness to previous chart support at 108.13. Looking ahead, a drop below this level would signal the fall from 118.66 top has resumed and extend decline towards previous resistance at 107.49.
Daily Technical Analysis: EUR/USD Bullish Momentum Faces Resistance Fibonacci Levels
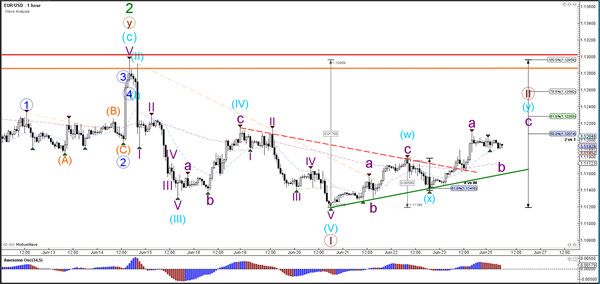
Currency pair EUR/USD
The EUR/USD broke above the resistance trend line (dotted red) which is a continuation of the wave 2 (brown) retracement. A break above the 100% level at 1.13 invalidates both waves 2 (brown/green) but bearish breakout below the bottom at 1.11 makes a potential wave 3 more likely.
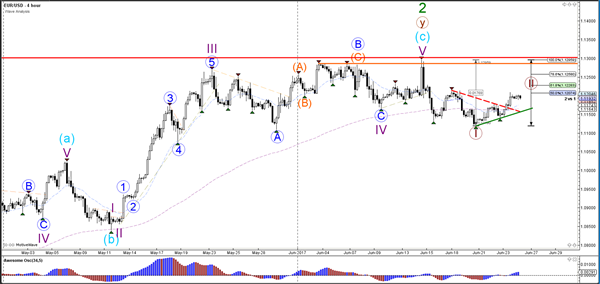
The EUR/USD stopped at the 50% Fibonacci level of wave 2 (brown) but could retrace deeper and higher if indeed an ABC (purple) zigzag occurs.
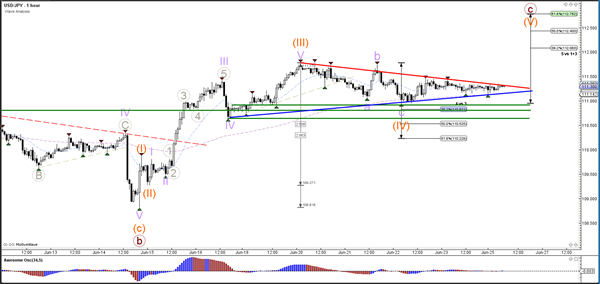
Currency pair USD/JPY
The USD/JPY is building a retracement which is most likely part of a wave 4 (orange) pullback. A break below the 61.8% of wave 4 vs 3 makes this wave 4 unlikely.
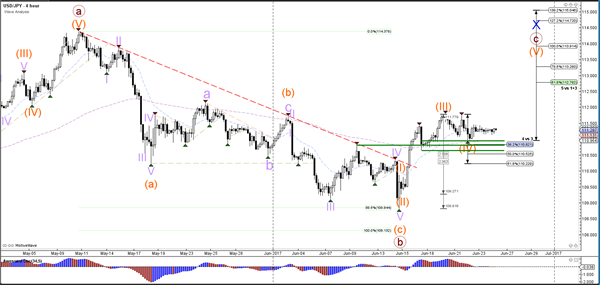
The USD/JPY break above resistance (red) could start wave 5 (orange).
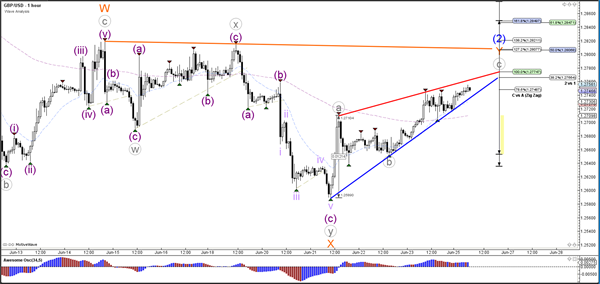
Currency pair GBP/USD
The GBP/USD is building an ABC (grey) zigzag within wave 2 (blue).
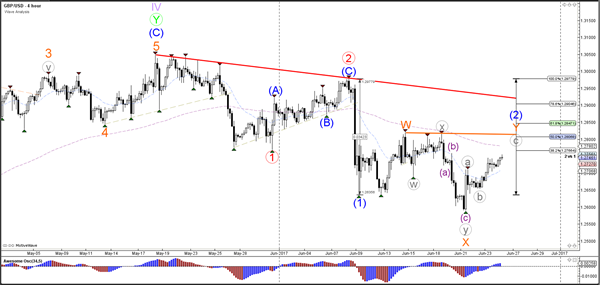
The GBP/USD is moving towards the Fibonacci targets and retracement levels of wave 2 v 1 and wave C vs A.
Weekly Technical Outlook And Review: EUR/USD, GBP/USD, AUD/USD, USD/JPY, USD/CAD, USD/CHF, DOW 30, GOLD
A note on lower timeframe confirming price action...
Waiting for lower timeframe confirmation is our main tool to confirm strength within higher timeframe zones, and has really been the key to our trading success. It takes a little time to understand the subtle nuances, however, as each trade is never the same, but once you master the rhythm so to speak, you will be saved from countless unnecessary losing trades. The following is a list of what we look for:
- A break/retest of supply or demand dependent on which way you're trading.
- A trendline break/retest.
- Buying/selling tails ... essentially we look for a cluster of very obvious spikes off of lower timeframe support and resistance levels within the higher timeframe zone.
- Candlestick patterns. We tend to only stick with pin bars and engulfing bars as these have proven to be the most effective.
We typically search for lower-timeframe confirmation between the M15 and H1 timeframes, since most of our higher-timeframe areas begin with the H4. Stops are usually placed 1-3 pips beyond confirming structures.
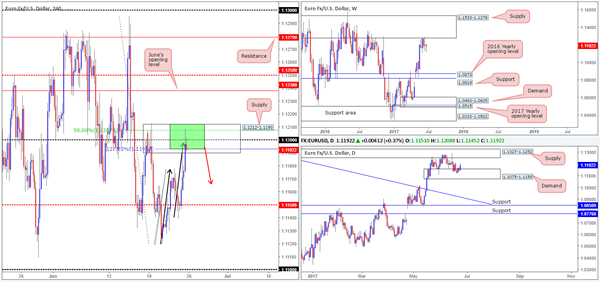
EUR/USD
Weekly gain/loss: – 3 pips
Weekly closing price: 1.1192
Over the past five weeks, we have seen the weekly candles cling to the underside of a major weekly supply at 1.1533-1.1278. Overlooking this zone is not something we'd advise considering that it has been in play since May 2015, and held price lower on several occasions since then. Should the bears eventually gain traction here, the next port of call will likely be the 2016 yearly opening level penciled in at 1.0873.
A closer look at price action on the daily timeframe shows the past five weeks of trading has been confined between a demand area coming in at 1.1075-1.1158 and a supply zone pegged at 1.1327-1.1253 (glued to the underside of the said weekly supply base).
A quick recap of Friday's trading on the H4 chart reveals that the bulls went on the offensive from the mid-level support at 1.1150, and ended the week shaking hands with the 1.12 neighborhood. The move, as you can see, also completed a H4 AB=CD (see black arrows) 127.2% ext. at 1.1193 taken from the low 1.1119, and connected with a 50.0% retracement value at 1.1207 drawn from the high 1.1295.
Our suggestions: Given that all of the above noted H4 structures are lodged within the walls of a H4 supply zone carved from 1.1212-1.1190, and considering the position of price on the weekly chart (see above), our team believes a downside move may take place from here today. The closing candle, at least for us, is enough confirmation to sell. Therefore, depending on the open, we will short, with stops placed above H4 supply at 1.1214 and look to initially target 1.1150.
Data points to consider: German IFO business climate at 9am, ECB President Draghi speaks at 6.30pm. US durable goods orders at 1.30pm GMT+1.
Levels to watch/live orders:
- Buys: Flat (stop loss: N/A).
- Sells: Looking to short at current price with stops placed at 1.1214.
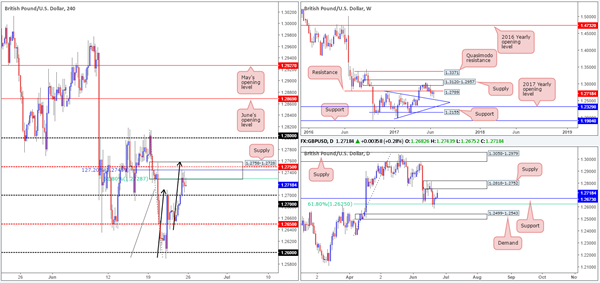
GBP/USD:
Weekly gain/loss: – 57 pips
Weekly closing price: 1.2718
While it's clear to see that weekly action remains capped beneath weekly resistance at 1.2789, last week's buying tail is concerning. Should the bears regain consciousness, nonetheless, it's possible that price will cross swords with the weekly trendline support extended from the high 1.2774.
Wednesday's reaction from the 61.8% daily Fib support at 1.2625 taken from the low 1.2365 extended its bounce on Friday and came within striking distance of daily supply seen at 1.2818-1.2752. Bearing in mind that this area encapsulates the said weekly resistance level, this will be a key zone to keep an eye on this week we believe. An area of concern should the bears kick it up a gear, however, is the nearby support level coming in at 1.2673.
As expected, H4 price blew through the 1.27 handle on Friday. Consequent to this, a truckload of stop-loss orders were likely triggered, leaving the unit free to challenge the supply registered at 1.2758-1.2728. For those who read Friday's report you may recall that this area was of interest to our desk given the following confluence: a H4 mid-level resistance level at 1.2750, a 61.8% H4 Fib resistance at 1.2728 taken from the high 1.2814, a H4 AB=CD 127.2% ext. at 1.2745 taken from the low 1.2589 and also the fact that the area is glued to the underside of the aforementioned daily supply zone!
Our suggestions: Taking a short position at current prices is tempting considering the confluence surrounding the said H4 supply. This would, however, entail you selling into the nearby 1.27 handle, which, of course, could throw a spanner in the works and halt selling.
As a result, we have to take the side of caution here and will therefore wait for H4 price to close below 1.27. Only then will we be comfortable shorting this market and targeting the H4 mid-level support at 1.2650 as an initial take-profit zone.
Data points to consider: US durable goods orders at 1.30pm GMT+1.
Levels to watch/live orders:
- Buys: Flat (stop loss: N/A).
- Sells: Watch for H4 price to close beyond 1.27 and then look to trade any retest seen thereafter ([waiting for a H4 bearish candle to form following the retest is advised prior to pulling the trigger] stop loss: ideally beyond the candle's wick).
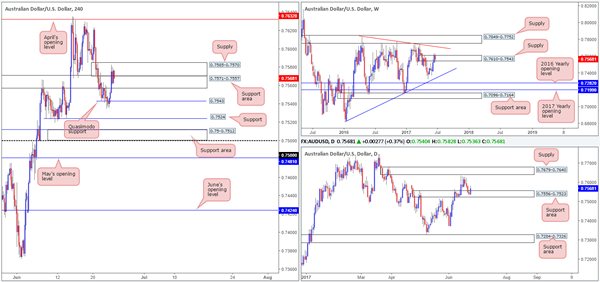
AUD/USD:
Weekly gain/loss: – 48 pips
Weekly closing price: 0.7568
Breaking a three-week bullish phase, weekly price recently slammed on the brakes and reversed following a marginal close above supply pegged at 0.7610-0.7543. Therefore, we believe this area is very likely the victim of a fakeout, and thus could encourage further selling to take shape this week.
On the daily timeframe, nevertheless, we can see that price recently stamped in a bullish candle from a support area located at 0.7556-0.7523. This move wiped out all of Thursday's and most of Wednesday's losses, and could, if it continues on its path north, bring the pair up to supply at 0.7679-0.7640.
Looking over to the H4 candles, price appears to have ended the week in a rather problematic spot, as far as structure is concerned. Trade closed above the resistance area seen at 0.7571-0.7557, which is now acting as a support area, but also failed to break above the nearby supply which sits just on top of this zone at 0.7585-0.7570. Essentially a decision needs to be made here.
Our suggestions: On account of the above, this is what we have logged so far:
If H4 price punches north and closes above the current supply, then the candles may look to approach April's opening level at 0.7632, which happens to be located a few pips beneath the noted daily supply.
Assuming that the current H4 support area gives way, there's not much room for price to stretch its legs. Close by is a H4 Quasimodo support at 0.7543, followed by support at 0.7524.
Neither a long nor short seems attractive at this time. Taking a long on the break of the current H4 supply could end in tears since you'd effectively be buying into potentially weekly sellers. By the same token, a short beyond the current H4 support area would entail you selling into possible daily buyers from demand, alongside having little leg room down to 0.7543.
Data points to consider: US durable goods orders at 1.30pm GMT+1.
Levels to watch/live orders:
- Buys: Flat (stop loss: N/A).
- Sells: Flat (stop loss: N/A).
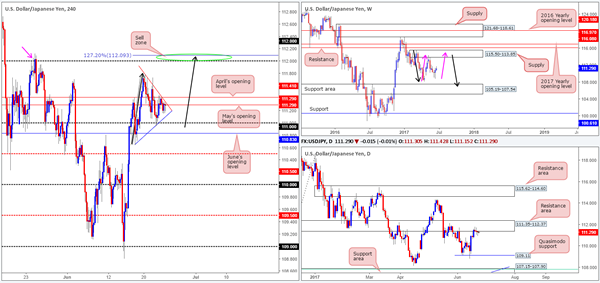
USD/JPY:
Weekly gain/loss: + 43 pips
Weekly closing price: 111.29
With weekly price recently finding a floor of support around the 110.30 mark, we see two possible scenarios on the weekly timeframe at the moment:
To the downside, a weekly AB=CD correction (see black arrows) that terminates within a weekly support area marked at 105.19-107.54 (stretches all the way back to early 2014) may form in the coming weeks.
To the upside, nonetheless, we also have a potential weekly AB=CD correction (see pink arrows) that completes within supply pegged at 115.50-113.85 that capped upside beautifully in early May.
Since Tuesday last week, the daily candles have been clinging to the underside of a daily resistance area penciled in at 111.35-112.37. This zone has been active since late January, so it is certainly not a base one should ignore. Providing that this area remains in position, the next downside target from here can be seen at 109.11: a Quasimodo support level.
A brief look at recent dealings on the H4 timeframe has seen price chalk up a bullish pennant formation (110.64/111.78). This pattern is typically considered to be a continuation pattern and therefore could see the unit breakout to the upside today. With little active supply seen until the 112 handle, which also merges with a left shoulder i.e. a H4 Quasimodo pattern at 112.05 (see the pink arrow), this is likely where price will head in the event of a breakout north. Also of particular interest is the fact that 112 is sited within the upper edge of the aforementioned daily resistance area, and also merges closely with a potential H4 AB=CD (black arrows) 127.2% ext. at 112.09 taken from the low 110.64.
Our suggestions: On the basis that H4 price does indeed breakout to the north today/early this week, 112 will be a level our team will look to short. Seeing as our desk is conservative, stops will be positioned beyond the current daily resistance area at 112.39. This will give the trade room to breathe should it come to fruition, and give price the best chance of correcting back down to at least 111.41: April's opening level (initial take-profit target).
Data points to consider: US durable goods orders at 1.30pm GMT+1.
Levels to watch/live orders:
- Buys: Flat (stop loss: N/A).
- Sells: 112 (stop loss: 112.39).
USD/CAD
Weekly gain/loss: + 56 pips
Weekly closing price: 1.3268
Weekly demand at 1.3223-1.3395 remains under pressure. Weekly bulls did, however, attempt to advance but failed to cover much ground. In the event that the bears remain dominant here, odds are that the weekly demand base pegged below at 1.3006-1.3115, which happens to intersect with a weekly trendline support extended from the high 1.1278, will see some action.
On the other side of the coin, daily flow continues to be bolstered by a support level penciled in at 1.3212. A decisive push below the said support line could lead to a move being seen down to demand at 1.3050-1.3103 (housed within the weekly demand mentioned above at 1.3006-1.3115).
Since the 14th of June, the H4 candles have been in correction mode, forming a nice-looking ascending channel formation (1.3165/1.3308). The week ended with price modestly fading the 1.3312/1.33 green zone (comprised of March/April's opening levels at 1.3312/10 and the psychological band 1.33), following an aggressive move to the upside in response to lower-than-expected Canadian inflation figures. From our perspective, it's difficult to believe that this channel will continue its upwardly path. Not only do we have daily resistance at 1.3272 now in play, but let's also not forget that the current weekly demand is hanging on by a thin thread at the moment.
Our suggestions: Ultimately, to confirm bearish intent, we would want to see H4 price close below both the channel support and the 1.32 handle. This – coupled with a retest and a reasonably sized H4 bearish candle (preferably a full-bodied candle) would, in our opinion, be enough to consider selling this pair, targeting the top edge of the weekly demand at 1.3115. Regarding longs, we would advise treading carefully given the higher-timeframe picture right now.
Data points to consider: US durable goods orders at 1.30pm GMT+1.

Levels to watch/live orders:
- Buys: Flat (Stop loss: N/A).
- Sells: Watch for H4 price to engulf 1.32 and then look to trade any retest seen thereafter ([waiting for a reasonably sized H4 bear candle – preferably a full-bodied candle – to form following the retest is advised] stop loss: ideally beyond the candle's wick).
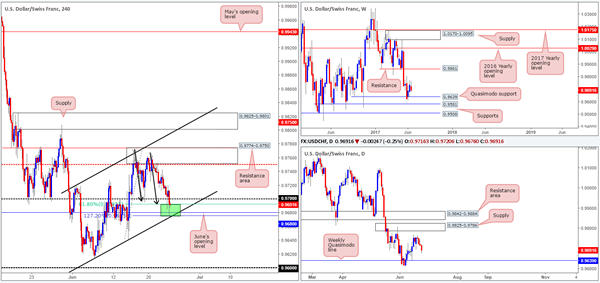
USD/CHF:
Weekly gain/loss: – 46 pips
Weekly closing price: 0.9691
Although weekly price remains buoyed above the weekly Quasimodo support level at 0.9639, the bears made an appearance last week, and thus could force the unit back down to the said weekly Quasimodo.
The view from the daily timeframe shows price trading between the aforementioned weekly Quasimodo support level and a daily supply base coming in at 0.9825-0.9786. Of particular interest here is the daily supply has managed to hold price lower once already on the 30th May, so it is certainly not a zone one should overlook, even though weekly price is trading nearby a support!
Looking at Friday's movement on the H4 chart, the 0.97 handle was challenged and eventually consumed during the later hours of the US segment. Fortunately for the bulls, however, June's opening level at 0.9680 held steady and produced a small end-of-day correction going into the closing bell. Bolstering this monthly level we have the following structures:
A H4 channel support line taken from the low 0.9613.
A H4 AB=CD (black arrows) 127.2% ext. at 0.9675 drawn from the high 0.9770.
A 61.8% Fib support at 0.9692 taken from the low 0.9640.
Our suggestions: Entering into a long position at current price is tempting. Be that as it may, there are two cautionary points to consider:
By entering into a long position, you will effectively be buying into the 0.97 handle.
While H4 confluence is strong at current price, the higher-timeframe structures show little support.
Our team will not be looking to trade long from current price UNTILL we have witnessed a decisive close above the 0.97 handle. Our impression is that a move above 0.97 will show buyer intent, and at least drag the H4 candles back up to the H4 sell zone we talked about last week at 0.9774/0.9750. Ideally though, we'd be eyeing the H4 supply above here at 0.9825-0.9801 as a final take-profit area should we manage to secure a long position, as it sits within the upper edge of the daily supply mentioned above.
Data points to consider: US durable goods orders at 1.30pm GMT+1.
Levels to watch/live orders:
- Buys: Watch for H4 price to engulf 0.97 and then look to trade any retest seen thereafter ([waiting for a reasonably sized H4 bull candle to form – preferably a full-bodied candle – following the retest is advised] stop loss: ideally beyond the candle's tail).
- Sells: Flat (stop loss: N/A).
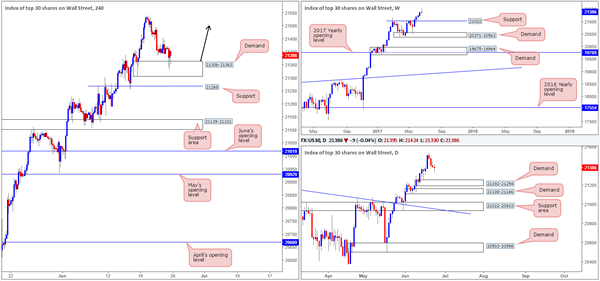
DOW 30
Weekly gain/loss: + 9 points
Weekly closing price: 21386
Despite the index closing higher for a fifth consecutive week, the unit printed a rather aggressive weekly selling wick. Given the strength of the underlying trend at this time, selling on the basis of this candle formation may not be the best path to take. Let's bump down to the lower timeframes and see what else we can find.
On the daily timeframe, Friday's action chalked up a reasonably clear indecision candle. The next downside target from here can be seen at a demand zone drawn from 21192-21254.
Looking over to the H4 candles, the demand base at 21306-21363, as expected, held firm. For those who follow our analysis on a regular basis, you may recall that our desk is currently long from 21164. 50% of that position was quickly liquidated at 21234, with the remaining 50% left in the market to run since we intend on trailing this trend long term. The stop-loss order is currently positioned below the said H4 demand at 21298, as we believe this to be the safest area for the time being. Ultimately, we want this zone to continue holding firm and eventually punch to fresh record highs.
Our suggestions: Should H4 price remain afloat above the current demand, and print a full or near-full-bodied bullish candle, our desk has noted that they would consider adding to the current position and trailing accordingly.
Data points to consider: US durable goods orders at 1.30pm GMT+1.
Levels to watch/live orders:
- Buys: 21164 ([live] stop loss: 21298). 21306-21363 ([waiting for a reasonably sized H4 bull candle – preferably a full-bodied candle – to form before pulling the trigger is advised] stop loss: ideally beyond the candle's tail).
- Sells: Flat (stop loss: N/A).
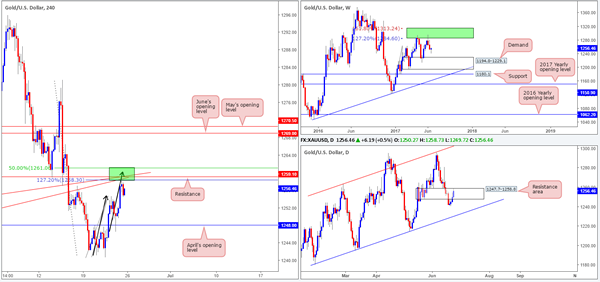
GOLD
Weekly gain/loss: + $2.7
Weekly closing price: 1256.4
Following two weeks of dominant selling, the metal recovered last week and formed a nice-looking weekly buying tail. From the weekly timeframe alone, this, for us, would not be considered a buy signal. The reason being simply comes down to where the candle formation took shape: mid-range between an area comprised of two weekly Fibonacci extensions 161.8/127.2% at 1313.7/1285.2 taken from the low 1188.1 (green zone) and a weekly demand at 1194.8-1229.1.
From the daily scale, bullion is seen trading within the upper boundary of a resistance area coming in at 1247.7-1258.8. With that being said, there has been little bearish intent shown from here as of yet. Should the bears perk up then the next area on the radar for our team would be the channel support extended from the low 1180.4 (intersects with the said weekly demand).
In Friday's report, we noted that the metal shows a possible H4 AB=CD bearish correction at hand. As you can see, the bounce from April's opening level at 1248.0 extended north on Friday and shook hands with the AB=CD ext. point at 1258.3.
Not only was the AB=CD completion interesting, we also highlighted the nearby merging H4 resistance at 1259.1, two H4 trendline resistances taken from lows of 1245.9/1252.9 and a H4 50.0% retracement value at 1261.0. In addition to this, we mentioned that the H4 resistance level at 1259.1 is planted just above a daily resistance area pegged at 1247.7-1258.8.
Our suggestions: As can be seen from the H4 chart, the unit has already responded to the H4 sell zone marked in green at 1261.0/1258.3, but printed an indecision candle, which is not something we were willing to sell.
Should price retest the sell zone sometime today, and form a reasonably sized H4 bear candle (preferably a full-bodied candle), we would look to short and target April's opening level first and foremost. Waiting for additional candle confirmation will help avoid an unnecessary loss and also help sidestep any fakeout that may be seen given that the said H4 sell zone is relatively small.
Levels to watch/live orders:
- Buys: Flat (stop loss: N/A).
- Sells: 1259.1 region ([waiting for a reasonably sized H4 bear candle – preferably a full-bodied candle – to form before pulling the trigger is advised] stop loss: ideally beyond the candle's wick).