

Sample Category Title
EUR/JPY Candlesticks and Ichimoku Analysis
Weekly
• Last Candlesticks pattern: Hammer
• Time of formation: 19 Sep 2016
• Trend bias: Down
Daily
• Last Candlesticks pattern: Doji
• Time of formation: 28 Mar 2017
• Trend bias: Near term up
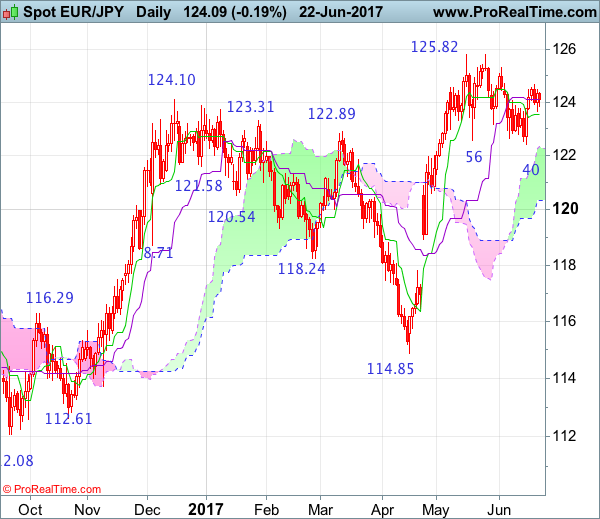
EUR/JPY – 124.28
Although the single currency fell briefly to 122.40 late last week, the subsequent rebound suggests consolidation above this level would be seen and gain to 125.31 resistance cannot be ruled out, however, break there is needed to signal the pullback from recent high of 125.82 has ended, bring retest of this level later. Having said that, only a break of previous chart resistance at 125.82 would confirm recent upmove has resumed and extend subsequent headway to 126.50-60, then 127.00-10.
On the downside, whilst initial pullback to the Tenkan-Sen (now at 123.53) cannot be ruled out, reckon 123.00-10 would hold and bring another rise later to aforesaid upside targets. Only below said support at 122.40 would risk correction of recent upmove to 122.00-10, however, still reckon downside would be limited to 121.60-65 (38.2% Fibonacci retracement of 114.85-125.82) and bring another upmove later. Below indicated previous support at 120.60 would abort and signal a temporary top has been formed, bring retracement of recent entire rise to 120.30-35 (50% Fibonacci retracement) and then 120.00 but reckon downside would be limited to 119.40-50 and price should stay above indicated support at 118.92.
Recommendation: Buy at 123.55 for 125.55 with stop below 122.55.
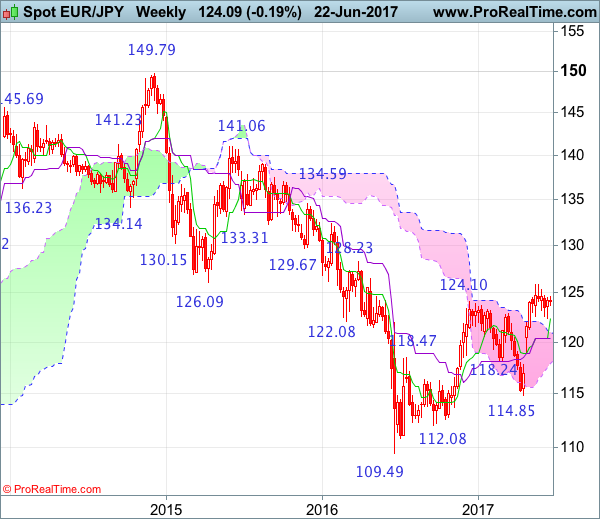
On the weekly chart, the single currency has remained confined within near term narrow range and further sideways trading would be seen, however, reckon last week’s lo at 122.40 would limit downside and bring another rise, above 125.31 resistance would signal the pullback from 125.82 has ended, bring retest of this recent high break there would extend the erratic rise from 109.49 low to 126.45-50, then towards 127.40-50 but reckon another previous resistance at 128.23 would limit upside and 129.60-65 (50% Fibonacci retracement of 149.79-109.49) should hold, price should falter below psychological resistance at 130.00, bring retreat later.
On the downside, although initial pullback to 123.50-55 cannot be ruled out, 122.37-40 (current level of the Tenkan-Sen and said support) should hold and bring another rise later. Below 122.37-40 would defer and risk weakness to 121.60-65, however, reckon downside would be limited to 121.00 and the Kijun-Sen (now at 120.34) should remain intact, bring another upmove later. A weekly close below the Kijun-Sen would defer and risk correction to 120.00, however, euro needs to penetrate indicated support at 118.92 to shift risk to the downside for further fall to 118.00 but downside should be limited to previous resistance at 117.82 and bring rebound later.
USD/CAD Candlesticks and Ichimoku Analysis
Weekly
• Last Candlesticks pattern: Shooting doji
• Time of formation: 02 May 2016
• Trend bias: Up
Daily
• Last Candlesticks pattern: Bearish engulfing
• Time of formation: 5 May 2017
• Trend bias: Up
USD/CAD – 1.3222
Although the greenback extended recent decline and dropped quite sharply to 1.3165 last week, the subsequent rebound suggests consolidation above this level would be seen and corrective bounce to 1.3380-85 cannot be ruled out, however, reckon the Kijun-Sen (now at 1.3418) would limit upside and bring another decline later to 1.3200-10 but break of 1.3191 support is needed to signal the rebound from 1.3165 has ended, bring retest of this level. Looking ahead, break of 1.3165 would confirm recent fall from 1.3794 top has resumed and extend weakness to 1.3100-10, however, only break of support at 1.3056 would retain bearishness and add credence to our view that recent entire rise from 1.2461 has ended at 1.3794 earlier, bring further fall to 1.3009 support but price should stay above 1.2969 (previous chart support).
On the upside, whilst initial recovery to 1.3380-85 cannot be ruled out, reckon upside would be limited to the Kijun-Sen (now at 1.3418) and bring another decline later. A daily close above previous support at 1.3425-30 would defer and suggest a temporary low is formed instead, risk retracement of recent decline to 1.3475-80 (50% Fibonacci retracement of 1.3794-1.3164), then towards resistance at 1.3542 but price should falter below 1.3555 (61.8% Fibonacci retracement), bring retreat later.
Recommendation: Sell again at 1.3410 for 1.3210 with stop above 1.3510.

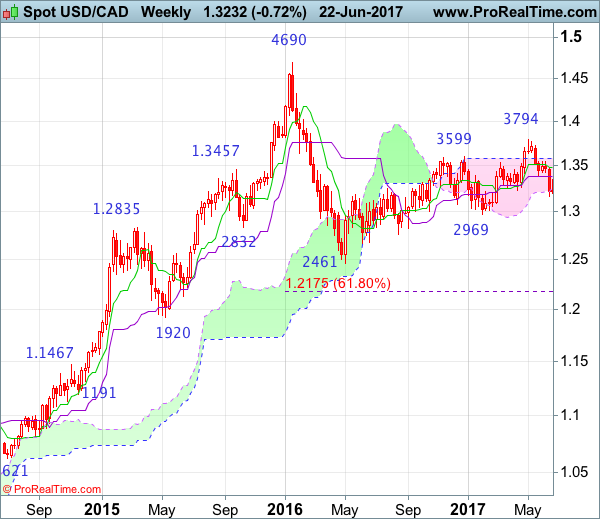
On the weekly chart, last week’s selloff formed a long black candlestick, adding credence to our view that top has been formed at 1.3794 earlier, although the greenback found support at 1.3165 and recovered, reckon upside would be limited to 1.3410-20 and bring another decline, below said support at 1.3165 would extend the fall from 1.3794 top to 1.3080-85 and later towards 1.3000-10, however, near term oversold condition should limit downside to previous chart support at 1.2969, bring rebound later.
On the upside, although initial recovery to 1.3410-20 cannot be ruled out, reckon upside would be limited to last week’s high at 1.3471 and bring another decline later. Only a weekly close above the Tenkan-Sen (now at 1.3480) would defer and suggest first leg of decline from 1.3794 top has ended, risk a stronger rebound towards 1.3547 resistance but still reckon upside would be limited to 1.3600-10, bring another decline. Above 1.3635-40 would defer and risk a stronger rebound to 1.3690-00 but still reckon upside would be limited and price should falter well below said resistance at 1.3794, bring another decline.
Forex Technical Analysis: EUR/USD, USD/JPY, GBP/USD
EUR/USD
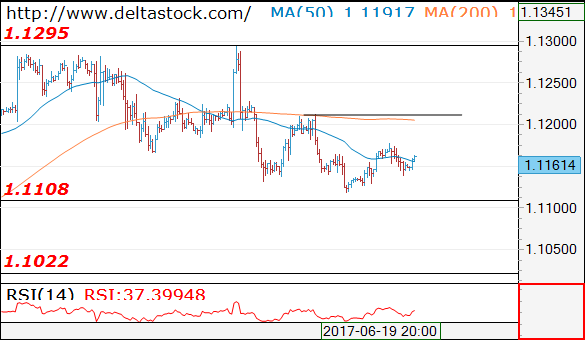
Current level - 1.1161
Despite the positive intraday bias, the overall outlook remains bearish below 1.1210, for a break through 1.1108, towards 1.1020.
| Resistance | Support | ||
| intraday | intraweek | intraday | intraweek |
| 1.1180 | 1.1360 | 1.1108 | 1.1020 |
| 1.1210 | 1.1610 | 1.1020 | 1.0838 |
USD/JPY
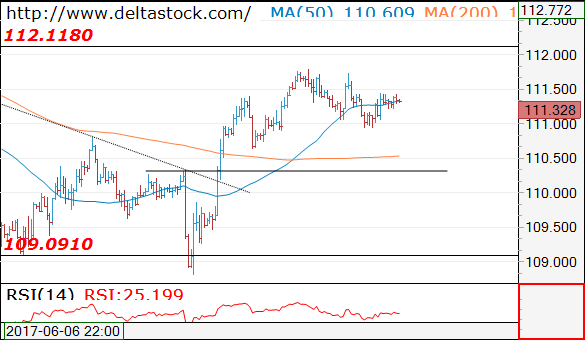
Current level - 111.32
The consolidation pattern is still underway, with a risk of a dip to 110.30 before advancing beyond 111.80, towards 113.00 area.
| Resistance | Support | ||
| intraday | intraweek | intraday | intraweek |
| 111.80 | 112.10 | 110.30 | 109.08 |
| 112.10 | 114.30 | 110.30 | 108.12 |
GBP/USD
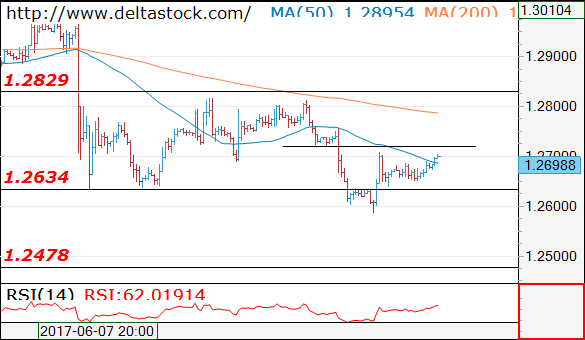
Current level - 1.2698
The intraday bias is positive above 1.2635 support, for a test of 1.2720 minor resistance. A break through the latter will signal a test of 1.2830 major hurdle.
| Resistance | Support | ||
| intraday | intraweek | intraday | intraweek |
| 1.2720 | 1.2970 | 1.2634 | 1.2480 |
| 1.2825 | 1.3050 | 1.2580 | 1.2480 |
Trade Idea : USD/CHF – Hold long entered at 0.9705
USD/CHF - 0.9706
Most recent candlesticks pattern : N/A
Trend : Near term up
Tenkan-Sen level : 0.9712
Kijun-Sen level : 0.9723
Ichimoku cloud top : 0.9743
Ichimoku cloud bottom : 0.9731
Original strategy :
Bought at 0.9705, Target: 0.9805, Stop: 0.9690
Position : - Long at 0.9705
Target : - 0.9805
Stop : - 0.9690
New strategy :
Hold long entered at 0.9705, Target: 0.9805, Stop: 0.9690
Position : - Long at 0.9705
Target : - 0.9805
Stop : - 0.9690
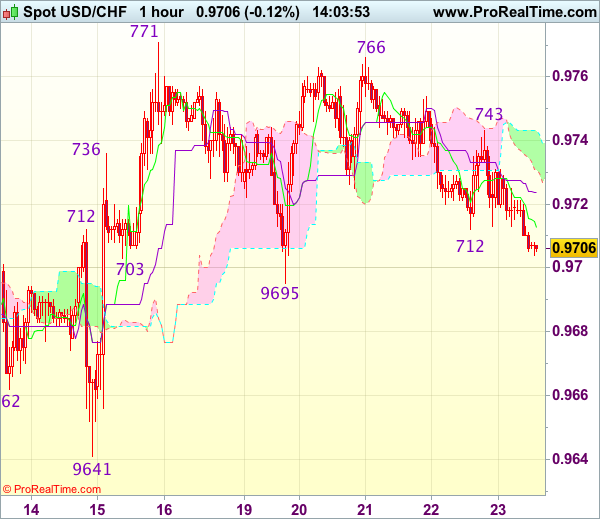
As the greenback has traded lower after meeting resistance at 0.9743, suggesting near term downside risk remains, however, as long as support at 0.9695 holds, bullishness remains for recent upmove to resume after initial sideways trading, break of said resistance at 0.9771 would confirm recent rise from 0.9613 low has resumed for test of resistance at 0.9808 but reckon previous resistance at 0.9825 would hold from here.
In view of this, we are holding on to our long position entered at 0.9705. Below said support at 0.9695 would defer and risk weakness towards said support at 0.9641 but only break there would abort and revive bearishness, this would also suggest the rebound from 0.9613 has ended instead, bring retest of this level later.
Trade Idea : GBP/USD – Hold short entered at 1.2695
GBP/USD - 1.2702
Most recent candlesticks pattern : N/A
Trend : Near term down
Tenkan-Sen level : 1.2671
Kijun-Sen level : 1.2672
Ichimoku cloud top : 1.2702
Ichimoku cloud bottom : 1.2650
Original strategy :
Sold at 1.2695, Target: 1.2595, Stop: 1.2710
Position : - Short at 1.2695
Target : - 1.2595
Stop : - 1.2710
New strategy :
Hold short entered at 1.2695, Target: 1.2595, Stop: 1.2710
Position : - Short at 1.2695
Target : - 1.2595
Stop : - 1.2710
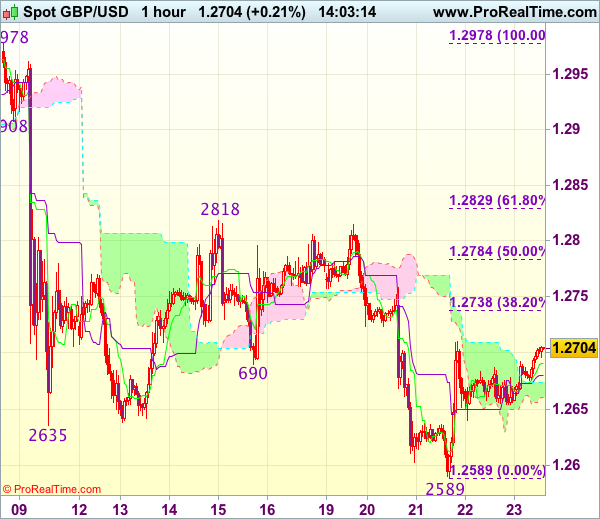
Although cable has rebounded again and upside risk remains, as long as 1.2710 holds, mild downside bias remains for another decline, below 1.2635-40 would bring another fall towards said support but break there is needed to retain bearishness and signal recent decline has resumed for weakness towards 1.2550, however, oversold condition should limit downside to 1.2520-25.
In view of this, we are holding on to our short position entered at 1.2695. Only above 1.2720-25 would abort and suggest low has been formed instead, bring a stronger rebound to 1.2755-60 and possibly 1.2780 but price should falter below indicated strong resistance at 1.2818.
Trade Idea : EUR/USD – Sell at 1.1200
EUR/USD - 1.1167
Most recent candlesticks pattern : N/A
Trend : Near term down
Tenkan-Sen level : 1.1158
Kijun-Sen level : 1.1159
Ichimoku cloud top : 1.1158
Ichimoku cloud bottom : 1.1146
Original strategy :
Sell at 1.1200, Target: 1.1100, Stop: 1.1235
Position : -
Target : -
Stop : -
New strategy :
Sell at 1.1200, Target: 1.1100, Stop: 1.1235
Position : -
Target : -
Stop : -
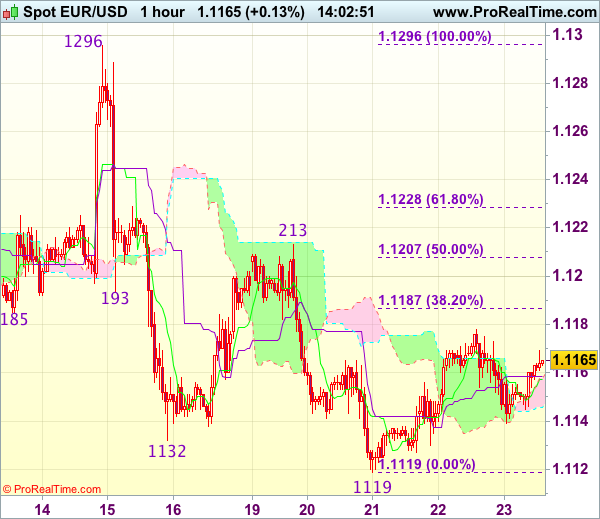
The single currency found support just below 1.1140 and has recovered, retaining our view that further consolidation above this week’s low at 1.1119 would be seen and near term upside risk remains for retracement to 1.1185-90 (38.2% Fibonacci retracement of 1.1296-1.1119), however, upside should be limited and price should falter below 1.1207-13 (50% Fibonacci retracement and previous resistance), bring another decline later, below 1.1135-40 would suggest the rebound from 1.1119 has ended, bring retest of this level, below there would confirm recent decline has resumed for further weakness to previous support at 1.1109, then towards 1.1075-80.
In view of this, we are looking to sell euro on recovery as 1.1195-00 should limit upside. Only above 1.1213 resistance would defer and risk a stronger rebound to 1.1230-35 but upside should be limited to 1.1260-70, bring another decline later.
Trade Idea : USD/JPY – Buy at 110.65
USD/JPY - 111.23
Most recent candlesticks pattern : N/A
Trend : Near term up
Tenkan-Sen level : 111.33
Kijun-Sen level : 111.21
Ichimoku cloud top : 111.37
Ichimoku cloud bottom : 111.27
Original strategy :
Buy at 110.65, Target: 111.65, Stop: 110.30
Position : -
Target : -
Stop : -
New strategy :
Buy at 110.65, Target: 111.65, Stop: 110.30
Position : -
Target : -
Stop : -
Although the greenback found support just below 111.00 level, near term downside risk remains for the erratic fall from this week’s high of 111.79 to bring retracement of recent rise and weakness to 110.90-95 cannot be ruled out, however, reckon previous support at 110.65 would limit downside and bring another rise later, above 111.45-50 would bring retest of 111.79 but break there is needed to confirm the rise from 108.82 low has resumed and extend headway to 111.90-95 (50% projection of 108.82-111.42-110.65), however, upside should be limited to resistance at 112.13 and 112.25 (61.8% Fibonacci retracement of 114.37-108.82 and 61.8% projection) should hold.
In view of this, would not chase this rise here and we are looking to buy dollar on pullback as 110.65 support should limit downside. Below 110.30-35 (50% Fibonacci retracement of 108.82-111.79 and previous resistance turned support) would abort and signal a temporary top has been formed instead, risk weakness towards 109.95-00 (61.8% Fibonacci retracement).

Market Update – Asian Session: Japan Prelim PMI Slides To 6-Month Low
Asia Mid-Session Market Update: Japan Prelim PMI slides to 6-month low; North Korea carries out another rocket engine test
US Session Highlights
(US) INITIAL JOBLESS CLAIMS: 241K V 240KE; CONTINUING CLAIMS: 1.944M V 1.93ME
(US) APR FHFA HOUSE PRICE INDEX M/M: 0.7% V 0.5%E
Stocks opened to the upside this morning, with the Dow gaining 50 points, before retracing late afternoon. Other major markets followed suit, with both the Dow and the S&P wiping out all their gains and closing slightly down on the day. The Nasdaq managed to post a small gain, and the Russell kept 0.4% of it gains for the day. In the S&P, the Health Care sector gained 1.1%, helping to pare losses from Consumer Staples and Financials, which lost 0.6% each.
US markets on close: Dow -0.1%, S&P500 -0.1%, Nasdaq flat
Best Sector in S&P500: Health Care
Worst Sector in S&P500: Consumer Staples
Biggest gainers: ORCL +8.6%; SPLS +6.2%; KMX +4.6%
Biggest losers: ACN -4.0%; DPS -3.6%; WLTW -2.4%
At the close: VIX 10.5 (-0.3pts); Treasuries: 2-yr 1.35% (flat), 10-yr 2.15% (-1bps), 30-yr 2.72% (flat)
US movers afterhours
SGH Reports Q3 $0.62 v $0.62e, Rev $207M v $205Me; Guides Q4 $0.62-0.66 v $0.61e, Rev $205-215M v $213Me, gross margin 21-23%; +2.1% afterhours
BBBY Reports Q1 $0.58 adj v $0.66e, Rev $2.74B v $2.80Be; Affirms FY17 EPS to decline low single digits to 10%, implies low end $4.12 v $4.29e; -7.4% afterhours
Politics
(NZ) Latest Roy Morgan survey shows ruling National Party support rise 3.5pts to 46.5% following FY17/18 budget - NZ press
(VE) Venezuela opposition to block streets nationwide on Friday
Key economic data
(JP) JAPAN JUNE PRELIMINARY PMI MANUFACTURING: 52.0 V 53.1 PRIOR; 9th straight month of expansion; 6-month low
Speakers and Press
China
(CN) PBoC: China banks are confident about June-end liquidity - Chinese press
(CN) China Banking Regulator (CBRC): China banks' NPL ratio fell 16bps y/y to 1.99% in May
(CN) China said to cut retail gasoline price by CNY250/ton starting June 24th - press
Australia/New Zealand
(NZ) Quotable Value (QV): Average cost of building a home in New Zealand rose 3.5% y/y in May - NZ press
Korea
(KR) US officials: North Korea has carried out another rocket engine test, likely for small stage of 3-stage ICBM type rocket engine - press
Asian Equity Indices/Futures (00:30ET)
Nikkei +0.2%, Hang Seng +0.1%, Shanghai Composite -0.7%, ASX200 +0.0%, Kospi +0.1%
Equity Futures: S&P500 +0.1%; Nasdaq +0.1%, Dax +0.1%, FTSE100 flat
FX ranges/Commodities/Fixed Income (00:30ET)
EUR 1.1160-1.1170; JPY 110.95-111.45; AUD 0.7540-0.7560; NZD 0.7200-0.7270
Aug Gold +0.7% at 1,254/oz; Aug Crude Oil +0.1% at $42.55/brl; July Copper -0.1% at $2.59/lb
iShares Silver Trust ETF daily holdings rise to 10,571 tonnes from 10,504 tonnes prior
(CN) PBOC SETS YUAN MID POINT AT 6.8238 V 6.8197 PRIOR; Weakest Yuan fix since May 31st and 4th straight weaker setting
(CN) PBoC: To skip today's open market operation (OMO)
(CN) China Finance Ministry sells 3-month bonds at 3.376%
(AU) Australia Finance Ministry (AOFM) sells A$600M in 1.75% 2020 bonds; avg yield 1.843%; bid-to-cover 5.29x
Asia equities notable movers
Australia
CSR (CSR) +2.0%; Guides FY17/18 earnings to rise y/y; Chairman to stand down at the 2018 AGM
Infigen (IFN) -4.9%; Cuts FY17 EBITDA to A$136-138M from A$147M prior forecast
Japan
Takata (7312) +45.5%; Toyota, Honda and Nissan will continue to financially support Takata after it files for bankruptcy protection - Nikkei
Don Quixote (7532) +0.2%; FY16/17 Rev said to rise 10% to ~¥830B; Op profit seen around ¥46.5B, above ¥45.5B prior forecast - Nikkei
Toshiba (6502) -4.2%; Reportedly to request securities report filing deadline extension - Japan press
Hong Kong
Lonking Holdings Limited (3339) +3.0%; Issues positive H1 profit alert
China Electric (85) -2.4%; Guides H1 profit -90% to -80% y/y due to prior one off gain
Bauhaus International Holdings (483) +31.3%; Reports FY17 (HK$) Net 64.9M v 52.9M y/y; Rev 1.31B v 1.51B y/y; SSS -10%
Aussie Dollar Trading Higher In The Morning Session
For the 24 hours to 23:00 GMT, the AUD marginally declined against the USD and closed at 0.7541.
LME Copper prices rose 1.5% or $86.0/MT to $5736.0/MT. Aluminium prices rose 0.4% or $6.5/MT to $1872.0/MT.
In the Asian session, at GMT0300, the pair is trading at 0.7546, with the AUD trading 0.07% higher against the USD from yesterday’s close.
The pair is expected to find support at 0.7534, and a fall through could take it to the next support level of 0.7521. The pair is expected to find its first resistance at 0.7560, and a rise through could take it to the next resistance level of 0.7573.
Next week, traders would focus on Australia’s HIA new home sales and private sector credit data.
The currency pair is trading between its 20 Hr and 50 Hr moving averages.

Euro-Zone’s Consumer Confidence Zoomed To A 16-Year High Level In June
For the 24 hours to 23:00 GMT, the EUR declined 0.15% against the USD and closed at 1.1165.
On the data front, the Euro-zone's flash consumer confidence index improved more-than-expected to a level of -1.3 in June, notching its highest level since April 2001, buoyed by improved economic outlook after recent data signalled that the region's economy has gathered pace. Markets were expecting the index to climb to a level of -3.0, compared to a reading of -3.3 in the prior month.
Meanwhile, the European Central Bank (ECB), in its latest economic bulletin report, noted that the common currency region remains on course for stronger growth this quarter. Further, the central bank added that underlying inflation continues to remain subdued and has yet to show a convincing upward trend.
Macroeconomic data indicated that the number of Americans filing for fresh jobless claims advanced to a level of 241.0K in the week ended 17 June, slightly more than market consensus for a rise to a level of 240.0K. In the prior week, initial jobless claims had registered a revised reading of 238.0K. On the contrary, the nation's housing price index climbed 0.7% on a monthly basis in April, compared to a revised similar rise in the prior month, while market participants had envisaged for a gain of 0.5%. Also, the nation's leading indicator increased 0.3% on a monthly basis in May, at par with market expectations. In the prior month, leading indicator had registered a revised rise of 0.2%.
In the Asian session, at GMT0300, the pair is trading at 1.1158, with the EUR trading 0.09% higher against the USD from yesterday's close.
The pair is expected to find support at 1.1139, and a fall through could take it to the next support level of 1.1119. The pair is expected to find its first resistance at 1.1178, and a rise through could take it to the next resistance level of 1.1197.
Ahead in the day, investors will keep a close watch on the flash Markit manufacturing and services PMIs data for June across the Euro-zone, to gauge strength in the region's economy. Moreover, in the US, the preliminary Markit manufacturing and services PMIs for June along with new home sales data for May, slated to release later in the day, will be on investors' radar.
The currency pair is showing convergence with its 20 Hr and 50 Hr moving averages.
