
Sample Category Title
Trade Idea: GBP/USD – Stand aside
GBP/USD – 1.2735
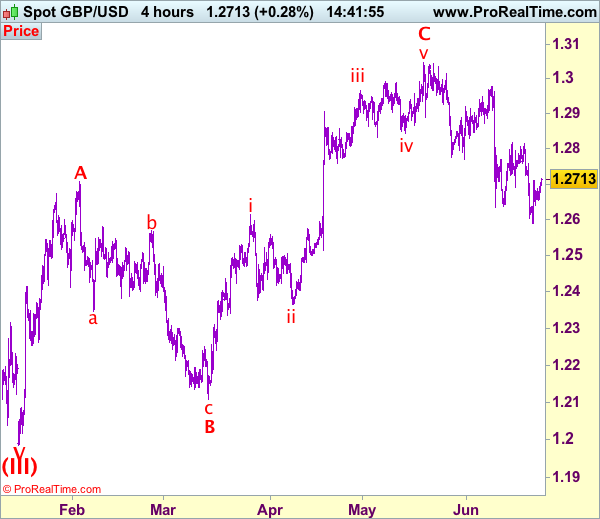
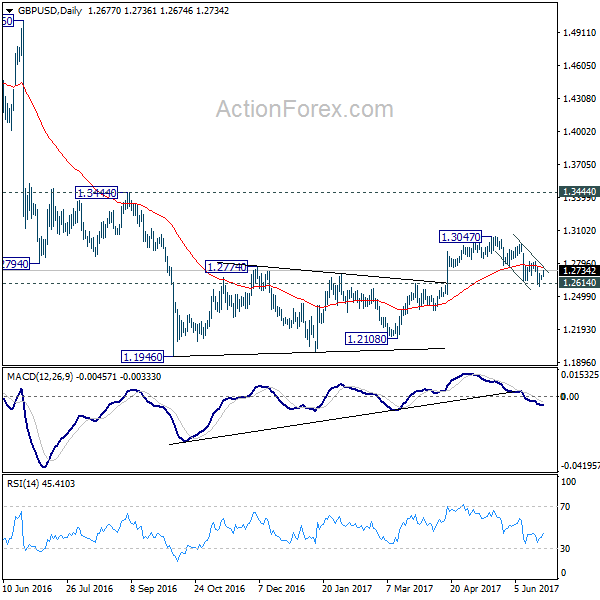
Recent wave: Wave V of larger degree wave (III) has ended at 1.1986 and major correction has commenced from there for gain to 1.3000 and 1.3140-50
Trend: Near term down
Original strategy :
Sold at 1.2675, stopped at 1.2735
Position: - Short at 1.2675
Target: -
Stop: - 1.2735
New strategy :
Stand aside
Position: -
Target: -
Stop:-
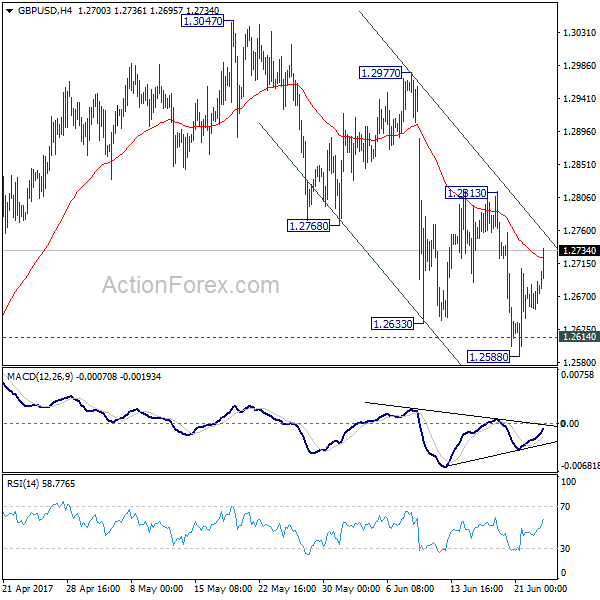
As sterling has surged again today, dampening our near term bearishness and suggesting a temporary low has been formed at 1.2589 earlier this week, hence upside risk remains for this rebound from there to bring retracement of recent decline, above 1.2758 would encourage for further gain to 1.2800, then test of resistance at 1.2818 but break there is needed to provide confirmation that recent decline from 1.3048 has ended at 1.2589, then headway to 1.2850-60 would follow.
Our preferred count on the daily chart is that cable's rebound from 1.3500 (wave (A) trough) is unfolding as a wave (B) with A ended at 1.7043, followed by triangle wave B and wave C as well as wave (B) has ended at 1.7192, the subsequent selloff is the larger degree wave (C) which is still unfolding with minor wave (III) of larger degree wave 3 ended at 1.1986, hence wave (IV) correction is in progress which could either be a triangle wave (IV) of a complex formation but upside should be limited to 1.3500 and price should falter well below 1.4000, bring another decline in wave (V) of 3 for weakness to 1.1500, then 1.1200.
On the downside, expect pullback to be limited to 1.2675-80 and support at 1.2640 should hold, bring another rebound later. Only a drop below 1.2640 would suggest the rebound from 1.2589 has ended, bring retest of this level, break of this support would revive bearishness and signal recent decline from 1.3048 top has resumed for retracement of early upmove to 1.2550, then towards previous support at 1.2515.
USD/CHF Daily Outlook
Daily Pivots: (S1) 0.9705; (P) 0.9723; (R1) 0.9735; More.....
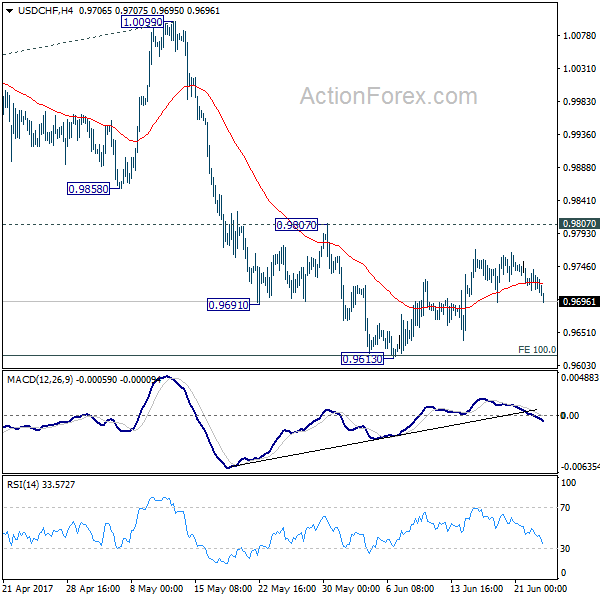
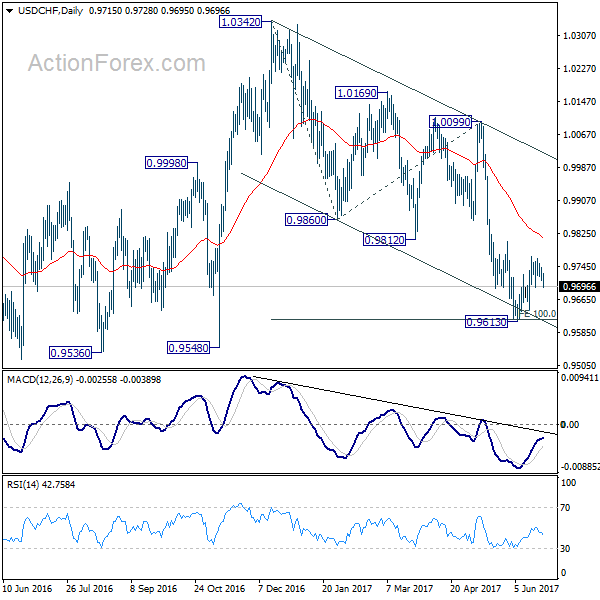
USD/CHF's consolidation from 0.9613 is still in progress and intraday bias stays neutral at this point. With 0.9087 resistance intact, near term outlook stays bearish. Break of 0.9613 will extend the whole decline from 1.0342 to 0.9548 support and below. We'd start to look for bottoming signal again as it approaches 0.9443 key support level. However, considering bullish convergence condition in 4 hour MACD, break of 0.9807 will indicate near term reversal and turn outlook bullish for 1.0099 resistance next.
In the bigger picture, USD/CHF is still bounded in medium term range of 0.9443/1.0342 for the moment. Consolidative trading would likely continue and medium term outlook remains neutral. Break of 1.0342 key resistance is needed to confirm underlying bullish momentum in the pair. Meanwhile, downside attempts should be contained by 0.9443 key support level. However, sustained break of 0.9443 will carry larger bearish implication and target 0.9 handle.
GBP/USD Daily Outlook
Daily Pivots: (S1) 1.2660; (P) 1.2675; (R1) 1.2697; More...
GBP/USD's rebound continues today but it's staying below 1.2813 minor resistance. Intraday bias stays neutral first. At this point, we're still favoring the bearish case that consolidation pattern from 1.1946 has completed at 1.3047 already. Sustained break of 1.2614 resistance turned support should confirm our bearish view and target a test on 1.1946 low next. However, break of 1.2813 resistance will dampen our view and turn bias back to the upside for 1.3047 and above.
In the bigger picture, fall from 1.7190 is seen as part of the down trend from 2.1161. Price actions from 1.1946 medium term low are seen as a consolidation pattern, which could have completed after hitting 55 week EMA. Break of 1.1946 low will target 61.8% projection of 1.5016 to 1.1946 from 1.3047 at 1.1150 next. In case the consolidation from 1.1946 extends, outlook will stay remain bearish as long as 1.3444 resistance holds.
Trade Idea: GBP/JPY – Stand aside
GBP/JPY - 141.45
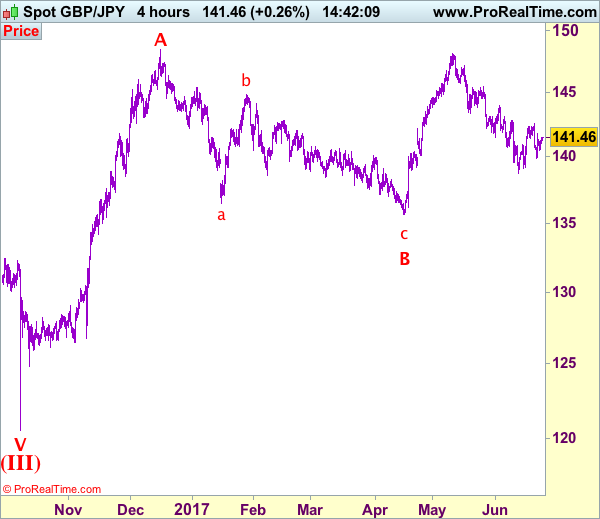
Recent wave: Medium term low formed at 120.50 and (A)-(B)-(C) major correction has commenced with (A) leg ended at 148.45, hence wave (B) is unfolding for retreat to 131.00-10.
Trend: Near term down
New strategy :
Stand aside
Position: -
Target: -
Stop:-
Although sterling found support at 139.85 earlier this week and has rebounded, a break above 141.75-80 is needed to revive bullishness and signal the retreat from 142.50 has ended, bring another test of this level. Once this resistance is penetrated, this would signal the erratic rise from 138.70 is still in progress or test of indicated previous resistance at 142.75, above there would signal recent decline has ended and encourage for at least a strong retracement of recent selloff to 143.05-10.
On the downside, below 140.45-50 would bring test of said support at 139.85, break there would suggest the rebound from 138.70 has ended there and downside risk remains for weakness towards support at 139.15, however, break there is needed to add credence to this view and signal recent decline has resumed for retest of 138.70, then towards 138.00-10 later which is likely to hold from here due to near term oversold condition.
Our preferred count is that larger degree wave V with circle is unfolding from 251.12 with wave (I) 219.34, (II): 241.38 and wave (III) is subdivided into 1: 192.60, 2: 215.89 (23 Jul 2008) and wave 3 ended at 118.87 earlier in 2009. The correction from there to 162.60 is wave 4 which itself is a double three and is labeled as first a-b-c ended at 151.53, followed by wave x at 139.03, 2nd a ended at 162.60, 2nd b at 146.75 and 2nd c leg of wave 4 ended at 163.00. Therefore, the decline from 163.00 to 116.85 is now treated as wave 5 which also marked the end of larger degree wave (III), hence wave (IV) major correction has commenced for retracement of the wave (III) from 241.38 and upside target at 183.95-00 (50% Fibonacci retracement of the wave (II) from 241.38) had been met, a drop below 160.00 would suggest wave (IV) has ended at 195.85, bring decline in wave (V) for initial weakness to 130 (already met) and 120.
Markit PMI Manufacturing And Services For June Is Due Out
Market movers today
In the US, the Markit PMI manufacturing and services for June is due out . Manufacturing PMI has cooled off since it peaked at 55 in January. The current level of manufacturing PMI points to GDP growth around 1.6% and even though this does not sound impressive, we believe that this level is representative of the underlying economic strength. Thus, we do not look for any significant changes to the PMI manufacturing. We expect PMI services to have increased to 54.2 and continue to believe that the moderate growth will be driven primarily by the service sector.
Also in the US, Fed governors Bullard (non-voter, dove), Mester (non-voter, hawkish) and Powell (voter, neutral) are due to speak today.
In the euro area, PMI figures are due out . Manufacturing PMI rose from 56.7 in April to 57.0 in May while the service PMI declined from 56.4 in April to 56.3 in May, leaving composite PMI unchanged. Seemingly, the weak manufacturing PMIs observed in recent months in the US and China did not drag euro area PMIs down in May, but could still weigh on the June figures. We expect PMIs to remain somewhat unchanged in June, as activity in the euro area is still strong, although risks seem tilted to the downside. New orders are currently at a six-year high and the order-inventory balance, which is usually a good leading indicator, has started to diverge and could drag manufacturing PMI down in June. Additionally, the weakness in the external environment already mentioned could drag on export orders.
Selected market news
After a week of significant turmoil in financial markets on the back of the plunge in oil prices, Asian equity markets are seeing a relatively quiet session this morning. Oil prices are also stabilising with the Brent oil price now having recovered over the past two days to USD45.4 per barrel. One supporting factor may be the relatively soft comment from Fed governor James Bullard, who said that while the rate hike yesterday was ‘not such a big problem' , the projection to raise the federal funds rate to 3% over the next 2.5 years is ‘unnecessarily aggressive'. Bullard is known to be a dove, so the soft comments may not be so surprising, but nevertheless point to some disagreement within the Fed's policy committee about the out look for monetary policy in the US.
In relation to the Brexit negotiations, Theresa May made an offer yesterday at the EU summit to allow the three million or so EU citizens living in Britain lawfully at the point at which the UK leaves the bloc in March 2019 to stay, and also not to require any families with EU citizens to be split up. This proposal clearly signals a softer stance by the UK administration, which has been on the defensive following the poor election result on 8 June.
Trade Idea: EUR/JPY – Hold long entered at 123.80
EUR/JPY - 124.31
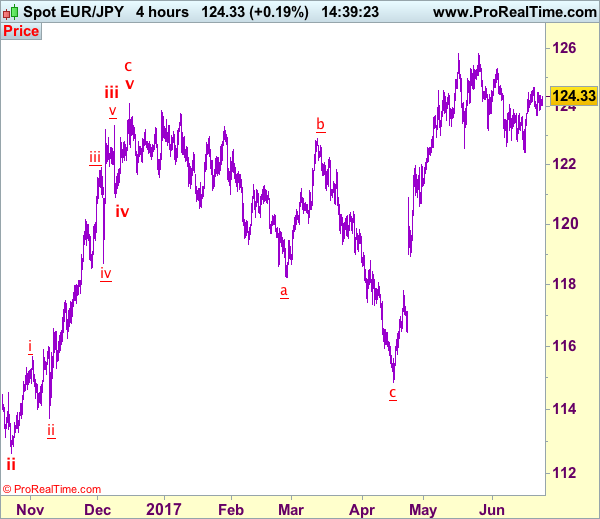
Recent wave: wave v of (C) ended at 94.12 and major correction in wave A has ended at 149.79
Trend: Near term up
Original strategy:
Bought art 123.80, Target: 125.30, Stop: 123.20
Position: - Long at 123.80
Target: - 125.30
Stop: - 123.20
New strategy :
Hold long entered at 123.80, Target: 125.30, Stop: 123.60
Position: - Long at 123.80
Target: - 125.30
Stop:- 123.60
As the single currency found support at 123.84 and has rebounded, retaining our bullishness and consolidation with upside bias remains for test of indicated resistance at 124.65, above there would signal recent upmove from 122.40 (last week’s low) has resumed and may extend further gain to 125.00 but break of resistance at 125.31 is needed to confirm correction from 125.82 has ended at 122.40, bring subsequent rise towards this level which is likely to hold on first testing.
In view of this, we are holding on to our long position entered at 123.80. Below support at 123.66 would risk weakness to 123.20-25, break there would defer and suggest first leg of rebound from 122.40 has ended instead, risk further weakness to 122.90-00 but price should stay well above said support at 122.40, bring another rebound later.
Our latest preferred count is that wave (ii) is ABC-X-ABC which ended at 123.33 and wave (iii) is unfolding with wave iii ended at 100.77, followed by wave iv at 111.57 and wave v as well as the wave (iii) has ended at 97.04, followed by wave (iv) at 111.43 and wave (v) has ended at 94.12 which is also the end of the larger degree v, this also implied the major wave (C) has also ended there, hence major correction has commenced from there with (A) leg unfolding in its lower degree wave c which has possibly ended at 145.69. Under this count, A-B-C wave (B) has commenced with A leg ended at 136.23, wave B at 143.79 and wave C has possibly ended at 149.79.
Our larger degree count is that the decline from 139.26 is wave (C) and is sub-divided into a diagonal triangle i-ii-iii-iv-v with wave i - 105.44, wave ii- 123.33, wave iii - 97.03, wave iv - 111.43, followed by the final wave v as well as the end of wave (C) at 94.12, this also mark the bottom of larger degree wave B. Under this count, major rise in wave C has commenced as an impulsive wave with minor wave III ended at 145.69, wave V is still in progress for further gain to 150.00. Having said that, this so-called wave V could well be the first leg of larger degree 5-waver wave C and this wave C should bring at least a retest of wave A top at 169.97 (July 2008).
Trade Idea: AUD/USD – Hold long entered at 0.7595
AUD/USD – 0.7563
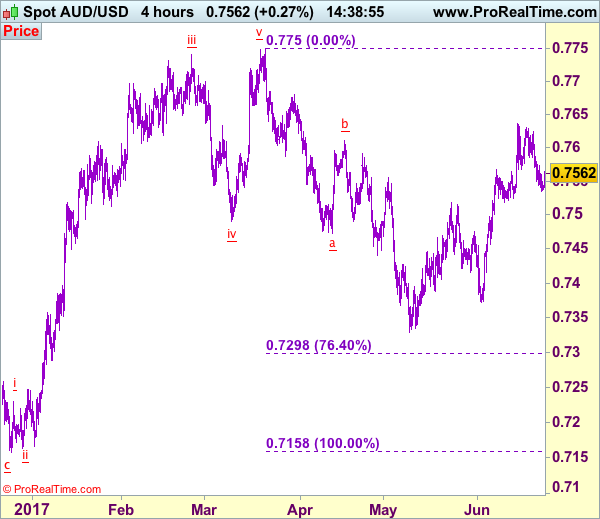
Recent wave: Wave 5 ended at 1.1081 and major correction has commenced for fall to 0.7000 and then towards 0.6500-10
Trend: Near term up
Original strategy :
Bought at 0.7595, Target: 0.7745, Stop: 0.7535
Position: - Long at 0.7595
Target: - 0.7745
Stop: - 0.7535
New strategy :
Hold long entered at 0.7595, Target: 0.7745, Stop: 0.7535
Position: - Long at 0.7595
Target: - 0.7745
Stop:- 0.7535
Although aussie retreated after faltering below recent high at 0.7636 (this month’s high), as long as 0.7535 holds, prospect of another rise remains, above 0.7600 would bring test of indicated resistance at 0.7636, break there would confirm recent upmove has resumed and extend the rise from 0.7329 towards previous resistance at 0.7680 but loss of momentum should limit upside to chart resistance at 0.7750 and price should falter below 0.7785-90.
In view of this, we are holding on to our long position entered at 0.7595. Below 0.7535 would defer and suggest top is possibly formed, bring correction to 0.7515-20, break there would provide confirmation, then correction to 0.7490-95 and possibly towards support at 0.7457 would be seen later.
On the 4-hour chart, the move from 0.8066 is the wave 5 with i: 0.8860, ii: 0.8315, wave iii is an extended move ended at 1.0183, iv: 0.9706 and wave v has ended at 1.1081 (also the top of entire wave 5). The subsequent selloff is the major correction which is unfolding as ABC-X-ABC and 2nd A leg has ended at 0.8848, followed by a-b-c wave B which ended at 0.9758, hence, 2nd C wave is now in progress and indicated downside target at 0.7000 and 0.6950 had been met, so further fall to 0.6710-20 cannot be ruled out.
Currencies: Dollar In Limbo And No Signs Of Change Anytime Soon
Sunrise Market Commentary
- Rates: Stronger EMU PMI finally relevant for markets
Risks for EMU PMI's are on the upside of expectations which is a negative for the Bund. As the ECB's normalization process slowly takes off, EMU eco data will gain importance for markets. Bunds can underperform US Treasuries. We also continue to monitor oil prices given this month's sharp sell-off. - Currencies: Dollar in limbo and no signs of change anytime soon
For the third consecutive session, dollar trading was confined to a very tight range. Asian trading suggest that the stalemate may be prolonged, but the EMU business sentiment report might bring at least a bit more suspense. However, even if our upside risk is confirmed and the euro profits, it is unlikely key technical levels will be broken.
The Sunrise Headlines
- Asian equities are ending the week mixed. Chinese stocks started with losses a day after word of a probe into potential systemic risk posed by large enterprises in China. Dow Jones, Nasdaq and S&P closed around zero change.
- After weeks of speculation ignited by his own tweets, US President Donald Trump said that he does not have recordings of his conversations with James Comey, the FBI director he fired.
- Republican internal struggle continues in the US. Four republican senators said not to support the new Senate reform bill that ends the obligation to have health insurance, cut Medicaid for the poor, and repeal taxes on the rich.
- Fed member Bullard, a non-voter in 2017, said the projection to raise rate to 3% over 2.5 years was unnecessarily aggressive. He added that the central bank should start shrinking the asset portfolio sooner rather than later.
- The biggest US banks cleared a Fed stress test of their ability to withstand economic shocks. Next week, the Fed will release findings from its Comprehensive Capital Analysis & Review.
- UK PM May's proposal to safeguard residency rights of EU-citizens currently living in the UK met a tepid reception. The EU-partners' main objection is that questions on EU-citizen rights would be handled in British courts.
- The main events on the eco-calendar today are the June PMI figures for the eurozone and the US. This evening, Fed members Bullard, Mester and Powell speak and the summit of EU leaders comes to a close.
Currencies: Dollar In Limbo And No Signs Of Change Anytime Soon
Dollar remains in limbo
Days come and days go, but the dollar cannot find direction. The decline of the oil price and the potentially negative impact on interest rates weighed marginally on the dollar yesterday morning. However, the decline of oil halted and even reversed modestly in the afternoon, allowing the dollar to gradually eke out small gains. The eco data were ignored.
Overnight, listless trading in Asian equity markets following the unchanged closure of WS yesterday. Brent crude is modestly higher in an unconvincingly sluggish rebound after steep price falls. The US T-Note barely budged. In this context, the lethargic FX trading of the majors continued. EUR/USD trades insignificantly higher at 1.1162. USD/JPY is unchanged at 111.34.
Eco calendar heats up, Fed speakers take the stage
The eco calendar is more interesting for the first time this week. Markets expect a marginal decline of the EMU PMI business sentiment, but at high levels suggesting the upside momentum is still intact. An upward surprise is possible after yesterday's unexpectedly strong EMU consumer confidence. French INSEE business confidence was marginally stronger in June versus May. US manufacturing and services PMI are expected mixed. The former a tad stronger and the latter a bit weaker than in May. However, at levels well below the EMU ones. US New Home sales fell sharply in May and we side with consensus in expecting a moderate rebound. After the European close, Fed governors Bullard (dove), Mester (hawk) and Powell (moderate who speaks on clearing) will give speeches. The WSJ reports already today that Bullard finds the Fed's rate path unnecessarily aggressive, but he backs the speedy start of the Fed's balance sheet tapering, to create policy for eventual “rainy” days
Given the eco calendar, stronger EMU PMI's could help EUR/USD higher, but we think that after May's sharp rise of the euro, the consolidation period is not over. Therefore, any EUR favourable upward surprise would give only a modest, technical insignificant boost for EUR/USD. The downside of the pair is limited too until the USD gets better eco news, signs that trump's pro-growth agenda get again traction or interest rate support. We don't see this happening in the next few days. The sluggish oil recovery is, if anything, slightly dollar negative. We maintain a neutral stance on EUR/USD today
Technical picture still negative for EUR/USD
Early May, EUR/USD failed to break below the 1.0821/1.0778 support (gap). Poor US data and US political upheaval propelled EUR/USD north of the 1.1023 range top. The pair tested the 1.1300 area going into the FOMC decision, but the test was rejected. So the Trump top/correction top at 1.1300/1.1366 proved to be a solid resistance. USD sentiment will have to become really negative to clear this hurdle. EUR/USD 1.1110 is a first minor support (tested yesterday but no break). A return below 1.1023 would indicate that the upside momentum has eased.
The USD/JPY rally ran into resistance in early May. A mini sell-off mid-May made the short-term picture negative, driving the pair further down in the 108.13/114.37 range. The post-Fed USD rebound pushed the pair beyond a first minor resistance at 110.81. A break beyond the 112.13 correction top would improve the ST-picture. The day-to-day sentiment improved slightly of late, but we remain cautious to forecast a U-turn.
EUR/USD: test off 1.1300/66 resistance rejected, but correction remains modest. First support at 1.1110 holds
EUR/GBP
EUR/GBP drops below the 0.88 pivot
After Wednesday's soft BoE Haldane comments inspired swings, sterling shifted yesterday in wait-and see modus. The CBI trends orders were again stronger than expected, but with no lasting impact on sterling trading. In late afternoon, EUR/GBP followed EUR/USD lower and sterling even outperformed the dollar maybe due to MPC Forbes. The Outgoing MPC member made her case for policy tightening one last time. EUR/GBP dropped below 0.88 to close at 0.8794 (from 0.8813 on Wednesday). Following a steep rise since mid-May, EUR/GBP looks ready for a pause or even a correction, but that may only be a temporary respite. A technical relevant break lower (see below) is needed for us to become more sterling optimistic. Cable held an extremely tight range before closing at about 1.2682 (from 1.2671).
Today, the UK calendar is empty. Strong EMU business sentiment might be a euro positive, but recent price action suggest the euro rally has become tired and thus the upside should be limited. Weaker EMU data could push EUR/GBP lower, but sterling gains should be corrective in nature. From a technical point of view, EUR/GBP extensively tested the 0.8854 area (2017 top), but a real break didn't occur. BoE comments caused some intraday volatility recently. In the end, the 0.8854/66 resistance remains within reach. A break would open the way to the 0.90 area. A return below the 0.8655 correction low would indicate easing pressure on sterling. Such a break lower will be difficult. A EUR/GBP buy-on-dips approach remains favoured
EUR/GBP: sterling rebounds temporary on BoE comments but the 0.8854/66 resistance stays within reach.
EUR/USD Daily Outlook
Daily Pivots: (S1) 1.1134; (P) 1.1156 (R1) 1.1172; More....
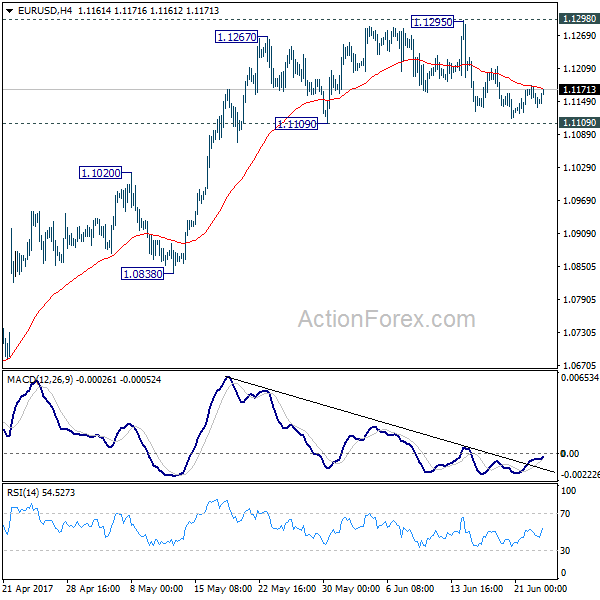
EUR/USD is still staying in range of 1.1109/1298 and intraday bias remains neutral. There is no confirmation of near term reversal yet. And focus remains on 1.1298 key resistance. Decisive break of 1.1298 key resistance will carry larger bullish implication and extend the whole rise from 1.0339 to 1.1615 resistance next. On the downside, firm break of 1.1109 support will indicate short term topping and rejection from 1.1298. In such case, intraday bias will be turned to the downside for 1.0838 support.
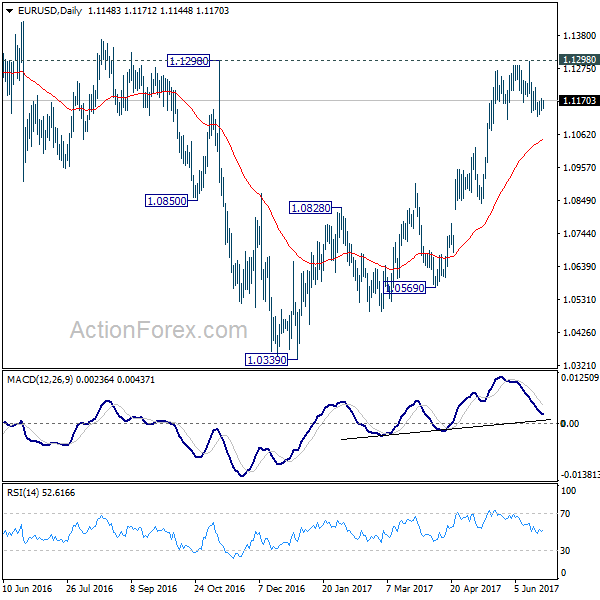
In the bigger picture, the case for medium term reversal continues to build up with EUR/USD staying far above 55 week EMA (now at 1.0932). Also, bullish convergence condition is seen in weekly MACD. Focus will now be on 1.1298 key resistance. Rejection from there will maintain medium term bearishness and would extend the whole down trend from 1.6039 (2008 high). However, firm break of 1.1298 will indicate reversal. In such case, further rally would be seen back to 1.2042 support turned resistance next.
Focus Turns Back to Economic Data, Eurozone PMI and Canada CPI Watched
Dollar trades broadly lower today and markets' focuses turn back to economic data. Eurozone PMIs will be closely watched in European session. EUR/USD dipped to we low as 1.1118 earlier this week but is holding above 1.1109 near term support. While some point to topping in EUR/USD after failing 1.1298 key resistance. There is no confirmation of rejection and trend reversal yet. Thus, the pair is staying bullish and upside surprises in today's Eurozone data will put focus back to 1.1298. Canadian CPI will be another key focus. USD/CAD dropped sharply overnight as the Canadian dollar was boosted by strong retail sales. It's likely that near term consolidation from 1.3164 has already completed at 1.3346. And strong consumer inflation data should give the fuel for USD/CAD to power through 1.3164 support. Also, from US, PMIs and new home sales will be featured.
In Japan, PMI manufacturing dropped to 52.0 in June, down from 53.1 and missed expectation of 53.4. Looking at some details, new orders dropped to 51.3, down from 53.4, and hit the lowest level since November. New export orders also dropped to 52.5, down from 53.0. Markit noted that "slower growth was signaled in June, with both orders and output rising at the weakest rates since late last year amid reports of a slight softening in market conditions." Nonetheless, "demand is holding up well, and the sector continues to operate within a solid growth range."
Much volatility is seen in Chinese equities market this week. The CSI 300 index hit 18 month high earlier this week on news of MSCI's decision to include 222 A-share large cap stocks into its global benchmark equity index. It's seen by economists as a pivotal moment and the decision is said to have broad support from institutional investors. However, Chinese equities were then shot down by news that the China Banking Regulatory Commission asked some banks to provide information on overseas loans made to some major Chinese conglomerates. The news is seen by some as a deeper worry on overseas acquisition and a prelude to tightening overseas loan issuance.
Outgoing BoE MPC member Kristin Forbes warned again that "lift-off of UK interest rates should not be delayed any longer." And she repeated the argument that "Sterling's depreciation has fundamentally shifted underlying inflation dynamics in a way that makes it more pressing to begin this voyage soon." Also, "the UK economy appears to be solid enough on key economic criteria, and even 'overstimulated' by others, such that a moderate reduction in the substantial amount of monetary stimulus ... makes sense."
EUR/USD Daily Outlook
Daily Pivots: (S1) 1.1134; (P) 1.1156 (R1) 1.1172; More....
EUR/USD is still staying in range of 1.1109/1298 and intraday bias remains neutral. There is no confirmation of near term reversal yet. And focus remains on 1.1298 key resistance. Decisive break of 1.1298 key resistance will carry larger bullish implication and extend the whole rise from 1.0339 to 1.1615 resistance next. On the downside, firm break of 1.1109 support will indicate short term topping and rejection from 1.1298. In such case, intraday bias will be turned to the downside for 1.0838 support.
In the bigger picture, the case for medium term reversal continues to build up with EUR/USD staying far above 55 week EMA (now at 1.0932). Also, bullish convergence condition is seen in weekly MACD. Focus will now be on 1.1298 key resistance. Rejection from there will maintain medium term bearishness and would extend the whole down trend from 1.6039 (2008 high). However, firm break of 1.1298 will indicate reversal. In such case, further rally would be seen back to 1.2042 support turned resistance next.
Economic Indicators Update
| GMT | Ccy | Events | Actual | Forecast | Previous | Revised |
|---|---|---|---|---|---|---|
| 0:30 | JPY | Manufacturing PMI Jun P | 52 | 53.4 | 53.1 | |
| 7:00 | EUR | France Manufacturing PMI Jun P | 54 | 53.8 | ||
| 7:00 | EUR | France Services PMI Jun P | 57 | 57.2 | ||
| 7:30 | EUR | Germany Manufacturing PMI Jun P | 59 | 59.5 | ||
| 7:30 | EUR | Germany Services PMI Jun P | 55.4 | 55.4 | ||
| 8:00 | EUR | Eurozone Manufacturing PMI Jun P | 56.8 | 57 | ||
| 8:00 | EUR | Eurozone Services PMI Jun P | 56.1 | 56.3 | ||
| 12:30 | CAD | CPI M/M May | 0.30% | 0.40% | ||
| 12:30 | CAD | CPI Y/Y May | 1.50% | 1.60% | ||
| 12:30 | CAD | CPI Core - Common Y/Y May | 1.40% | 1.30% | ||
| 12:30 | CAD | CPI Core - Median Y/Y May | 1.60% | |||
| 12:30 | CAD | CPI Core - Trim Y/Y May | 1.30% | |||
| 13:45 | USD | US Manufacturing PMI Jun P | 52.9 | 52.7 | ||
| 13:45 | USD | US Services PMI Jun P | 53.9 | 53.6 | ||
| 14:00 | USD | New Home Sales May | 593K | 569K |