Sample Category Title
Technical Outlook: GBPUSD – Strong Bullish Acceleration Above 1.2700 Pivot May Extend Towards Key 1.2800/20 Resistance Zone
Cable surged above 1.2700 barrier (daily Tenkan-sen) in early Friday, driven higher by profit-taking and weaker dollar which came under pressure after US weekly jobless claims jumped above expectations on Thursday.
Sterling was in a bumpy ride during previous sessions on political uncertainty in the UK as well as conflicting comments from top BOE officials regarding possible change in the monetary policy this year.
Fresh strength emerged after repeated failure to close below pivotal 1.2625 support (Fibo 61.8% of 1.2365/1.3047 ascend) and is looking for sustained break above 1.2700/11 (Tenkan-sen / 10SMA) to resume recovery rally.
The notion is supported by RSI / slow stochastic bullish divergence, formed on daily chart.
Recovery rally also needs sustained above 1.2728 (Fibo 38.2% of 1.2955/1.2588 downleg) for confirmation and extension higher for possible retest of key barriers at 1.2800/20 zone (20SMA / last week’s multiple upside rejections / daily Kijun-sen).
Broken Tenkan-sen and session low at 1.2700/1.2674 mark solid supports which are required to hold and keep fresh bulls in play.
Res: 1.2757, 1.2771, 1.2800, 1.2815
Sup: 1.2700, 1.2674, 1.2653, 1.2625
GBP/JPY Daily Outlook
Daily Pivots: (S1) 140.68; (P) 140.96; (R1) 141.45; More....
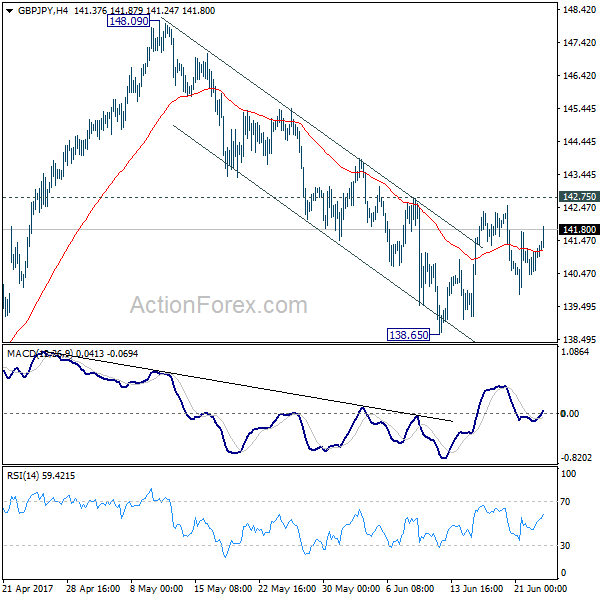
GBP/JPY is staying in range of 138.65/142.75 and intraday bias remains neutral. On the downside, break of 138.65 will resume the decline from 148.09. In that case, we'd look for bottoming signal around 135.58, which is close to 135.39 fibonacci level, to bring rebound. On the upside, break of 142.75 should confirm completion of the fall from 148.09 and turn bias back to the upside for this resistance.
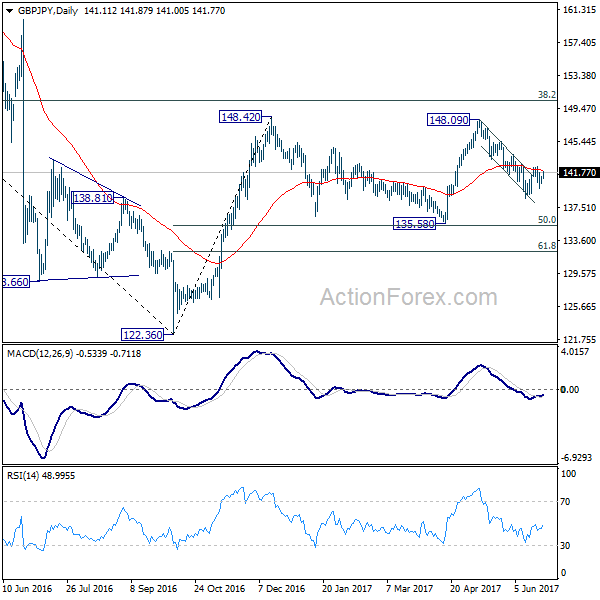
In the bigger picture, while the fall from 148.09 is deeper than expected, we're not bearish in the cross yet. Price action from 148.42 is possibly developing into a sideway pattern with fall from 148.09 as the third leg. Deeper decline could be seen but we're looking for strong support from 135.58 and 50% retracement of 122.36 to 148.42 at 135.39 to contain downside. Rise from 122.36 is still mildly in favor to resume at a later stage. However, sustained break of 135.58/39 will confirm reversal and target a retest on 122.36 low.
EUR/JPY Daily Outlook
Daily Pivots: (S1) 123.83; (P) 124.13; (R1) 124.41; More...
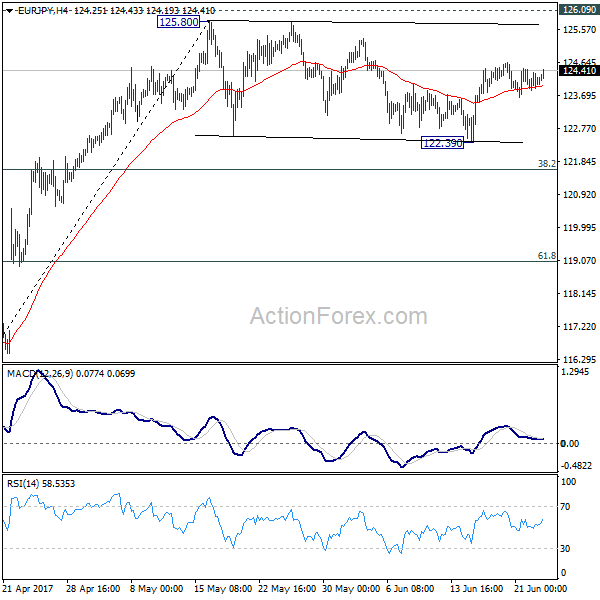
Intraday bias in EUR/JPY remains neutral as the consolidation from 125.80 is still extending. In case of another fall, downside should be contained by 38.2% retracement of 114.84 to 125.80 at 121.61 to bring rebound and then rise resumption. On the upside, decisive break of 126.09 resistance will extend the whole rebound from 109.03 to 100% projection of 109.03 to 124.08 from 114.84 at 129.89.
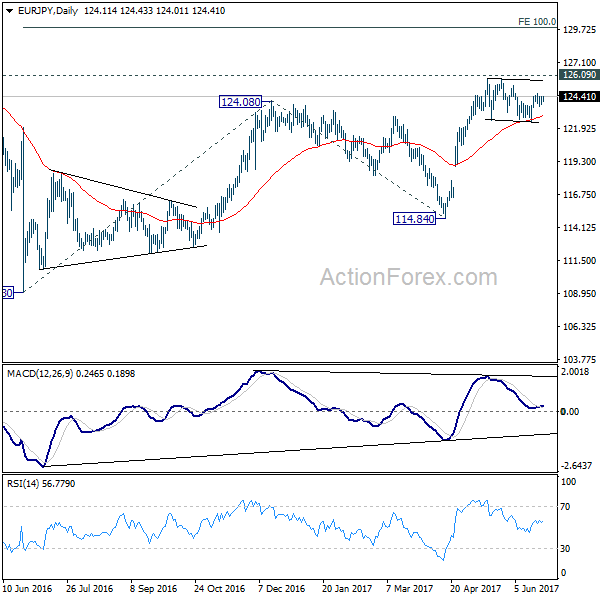
In the bigger picture, focus is staying on 126.09 support turned resistance. Decisive break there will confirm completion of the down trend from 149.76. And in such case, rise from 109.20 is at the same degree and should target 141.04 resistance and above. Meanwhile, rejection from 126.09 and break of 114.84 will extend the fall from 149.76 through 109.20 low.
EUR/GBP Daily Outlook
Daily Pivots: (S1) 0.8775; (P) 0.8801; (R1) 0.8818; More...
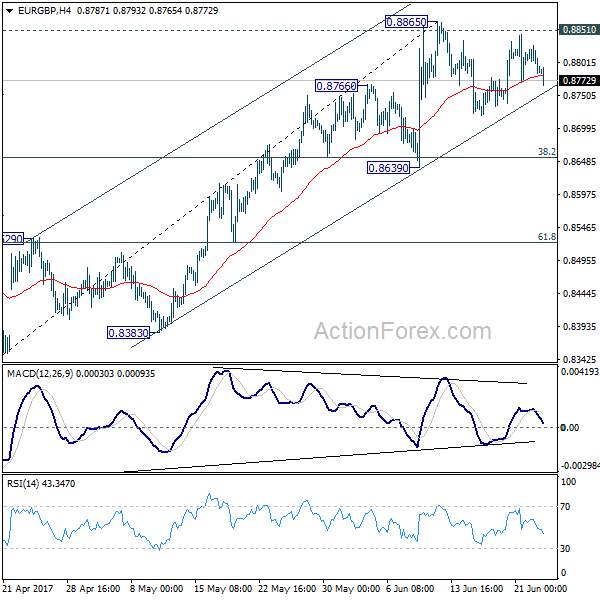
EUR/GBP is staying in consolidation from 0.8865 and intraday bias remains neutral at this point. In case of another fall, we'd expect strong support from 0.8639 to contain downside and bring rise resumption. Decisive break of 0.8851 resistance will pave the way to retest 0.9304 high. However, break of 0.8639 support will now indicate near term topping and bring deeper pull back 0.8529 resistance turned support and below.
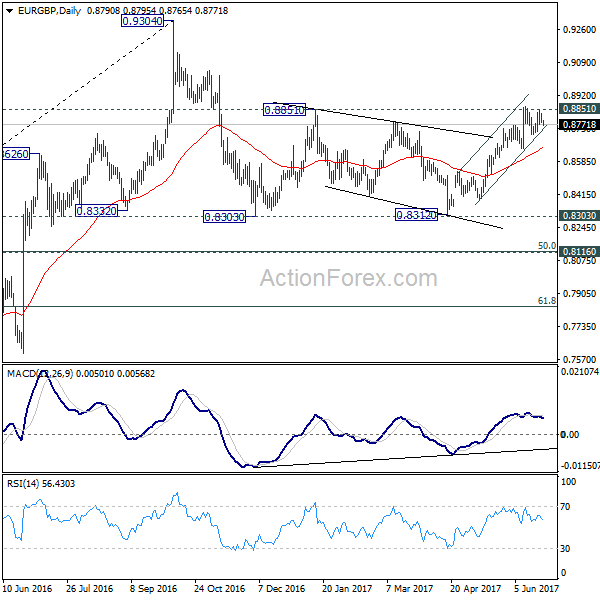
In the bigger picture, price actions from 0.9304 are viewed as a medium term corrective pattern. The leg from 0.9304 should have completed after testing 0.8332 structural support. But it's too early to say that larger rise from 0.6935 is resuming. Rejection from 0.9304 will extend the consolidation with another falling leg. Meanwhile, firm break of 0.9304 will target 0.9799 (2008 high). In case of another decline, we'd expect strong support from 0.8116 cluster support (50% retracement of 0.6935 to 0.9304 at 0.8120) to contain downside and bring rebound.
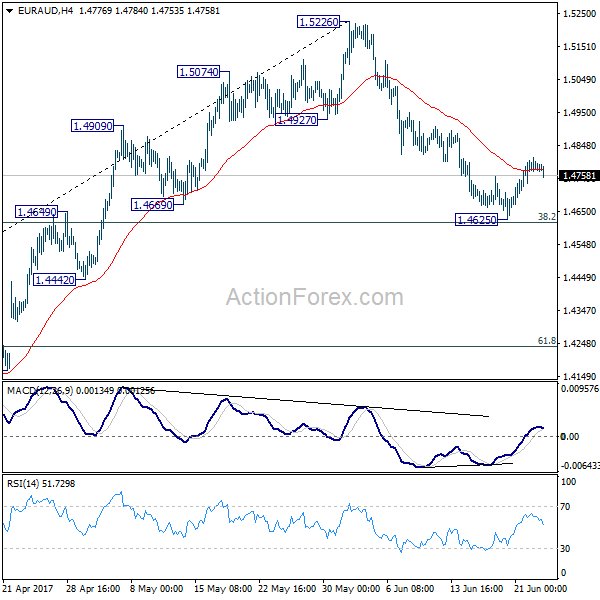
EUR/AUD Daily Outlook
Daily Pivots: (S1) 1.4743; (P) 1.4778; (R1) 1.4822; More...
The pull back from 1.5226 could have completed at 1.4625 after drawing support from 38.2% retracement of 1.3624 to 1.5226 at 1.4614. Further rise is mildly in favor to retest 1.5226 high. However, sustained break of 1.4614 fibonacci level will pave the way to 61.8% retracement at 1.4236 and possibly below.
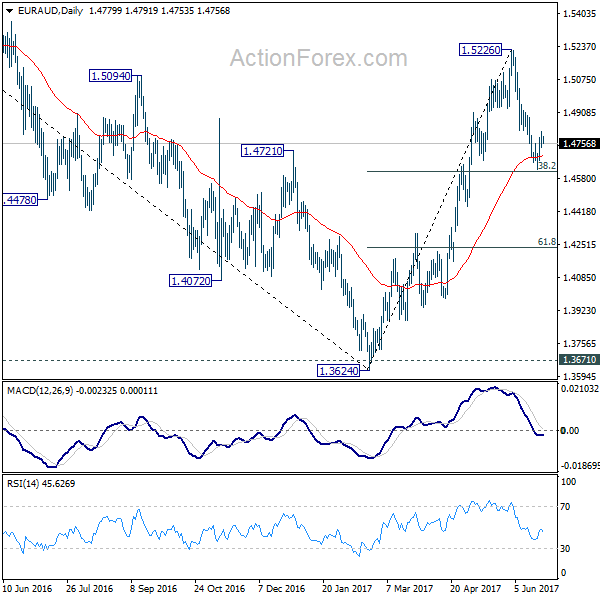
In the bigger picture, price actions from 1.6587 medium term top are viewed as a corrective pattern. Such correction should be completed at 1.3624 after defending 1.3671 key support. Rise from 1.3642 would extend to 61.8% retracement of 1.6587 to 1.3624 at 1.5455. Sustained break there will pave the way to retest 1.6587. However, sustained break of 1.4669 support will dampen this bullish view. We'll assess the outlook later after looking at the structure and depth of the pull back.
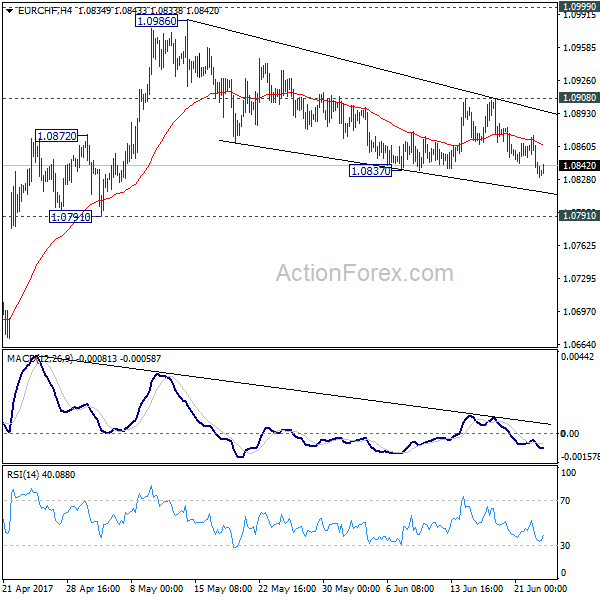
EUR/CHF Daily Outlook
Daily Pivots: (S1) 1.0822; (P) 1.0847; (R1) 1.0860; More...
The break of 1.0837 suggests that correction from 1.0986 is resuming. Intraday bias is mildly on the downside for deeper fall. Still, we'd expect strong support from 1.0791/0872 support zone to bring rebound. On the upside, break of 1.0908 resistance will argue that such correction is completed and turn bias to the upside for retesting 1.0987/0999 resistance zone.
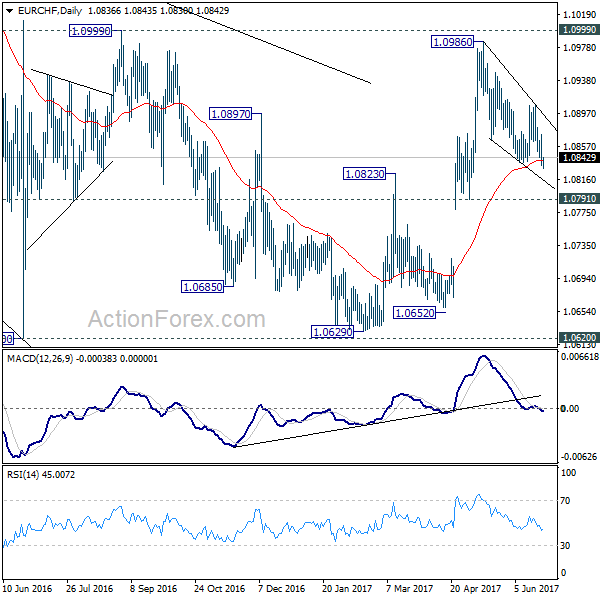
In the bigger picture, the price actions from 1.1198 are seen as a corrective move. Such correction could have completed after defending 38.2% retracement of 0.9771 to 1.1198 at 1.0653. Decisive break of 1.0999 resistance will target a test on 1.1198 high. For now, this will be the preferred case as long as 1.0791 support holds.
Canadian Dollar Jumps On Retail Sales
The US dollar continued to trade mixed across the board. Lack of clear fundamentals saw the markets trading mostly subdued.
On the economic front, data included the US initial jobless claims increased 3,000 to a seasonally adjusted 241,000 in the week ended June 17. This was slightly higher than the 240k that was forecast. In Canada, retail sales rose 0.8% on the month in April beating estimates of 0.2%. The stronger than expected retail sales push the Canadian dollar higher, which also got a boost from oil prices which snapped a 3-day losing streak.
Looking ahead, the economic data today will include the flash manufacturing and services PMI from the eurozone. Canada will be reporting the monthly inflation data which is expected to show a 0.2% increase on a month over month basis. In the US flash manufacturing and services PMI numbers will be coming out and the FOMC member, Powell will be speaking.
EURUSD intraday analysis
EURUSD (1.1161): EURUSD slipped lower yesterday, but with price action supported above 1.1129, we can expect the upside bounce to continue. We continue to watch the unfolding head and shoulders patterns currently. The upside in price will see a possibly lower high being formed near 1.1200 region. If we expect a reversal here, EURUSD will form the right shoulder of the head and shoulders pattern. Following this, a break down below 1.1129 which will become the neckline support of the H&S pattern will signal a move to the downside. However, the risks of upside continuation in prices could see EURUSD remaining biased to the upside.
GBPUSD intraday analysis
GBPUSD (1.2697): The British pound was trading subdued yesterday but the price action since earlier today has been bullish. The bias is flat at the moment unless we see a daily close above 1.2688. In this case, GBPUSD could be seen pushing higher towards 1.2800 where resistance could be tested even more firmly. If this scenario plays out, further upside in GBPUSD could be expected with a breakout above 1.2800 likely to push GBPUSD higher towards targeting 1.3000. To the downside, if the current consolidation fails, we can expect the bearish trend to resume with prices falling back to 1.2600 and possibly extending lower to 1.2400.
USDJPY intraday analysis
USDJPY (111.32): USDJPY is consolidating into a bullish flag pattern on the 4-hour chart. An upside breakout above the resistance level of 111.70 is required to confirm this bullish trend. The minimum price objective is towards 112.5 followed by 113.36. To the downside, in the event that USDJPY fails to break out above the 111.70 resistance, we can expect the downside in USDJPY to test support at 110.70 region. This would potentially invalidate the bullish outlook in price and could keep USDJPY range bound and possibly biased for further losses.
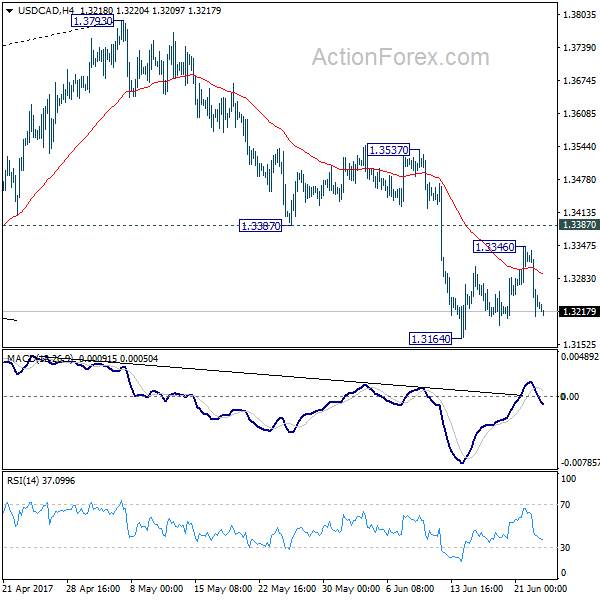
USD/CAD Daily Outlook
Daily Pivots: (S1) 1.3182; (P) 1.3260; (R1) 1.3311; More....
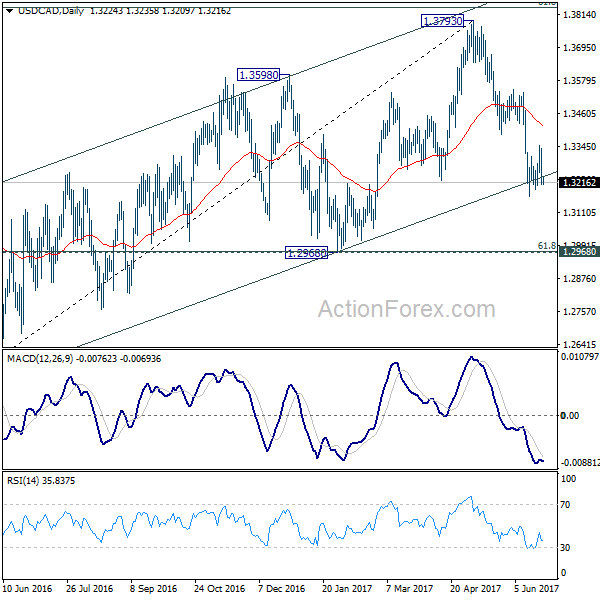
USD/CAD is still staying above 1.3164 and intraday bias remains neutral at this point. Consolidation from 1.3164 might extend but upside should be limited by 1.3387 support turned resistance and bring fall resumption. We're holding on to the view that corrective rise from 1.2460 has completed at 1.3793 already. Below 1.3164 will target 1.2968 cluster support, 61.8% retracement of 1.2460 to 1.3793 at 1.2969. However, firm break of 1.3387 will dampen our view and turn focus back to 1.3537 resistance next.
In the bigger picture, price actions from 1.4689 medium term top are seen as a correction pattern. The first leg has completed at 1.2460. Rise from 1.2460 is seen as the second leg and has completed at 1.3793, ahead of 61.8% retracement of 1.4689 to 1.2460 at 1.3838. Break of 1.3222 should now indicate the start of the third leg while further break of 1.2968 should confirm. In that case, USD/CAD should decline through 1.2460 support to 50% retracement of 0.9406 to 1.4869 at 1.2048.
EUR/JPY Elliott Wave Analysis
EUR/JPY - 124.23
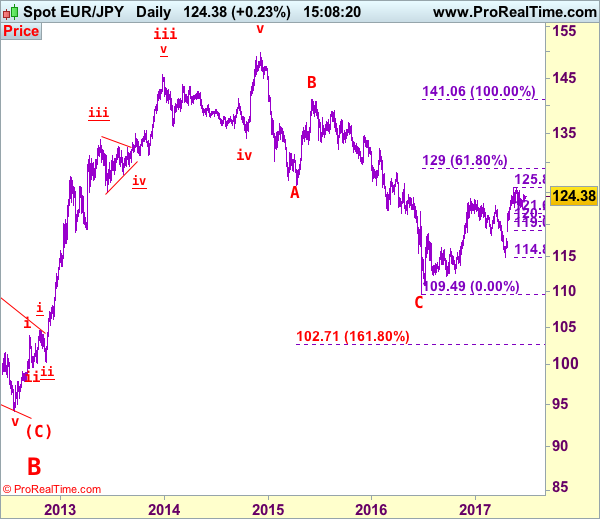
EUR/JPY: Wave v as well as larger degree wave (C) ended at 94.11 and first leg of larger degree wave C upmove has possibly ended at 149.79 and wave 2 correction has possibly ended at 109.49.
As the single currency found good support at 122.40 last week and rebounded, suggesting consolidation with mild upside bias would be seen for gain to 125.00, however, break of resistance at 125.31 is needed to confirm the pullback from 125.82 has ended at 122.40, bring retest of this recent high, above there would confirm recent upmove from 109.49 low has resumed and extend gain to resistance at 126.47 and possibly 127.50-60, having said that, reckon upside would be limited to 128.17 resistance and price should falter well below 129.00 (61.8% Fibonacci retracement of 141.06-109.49).
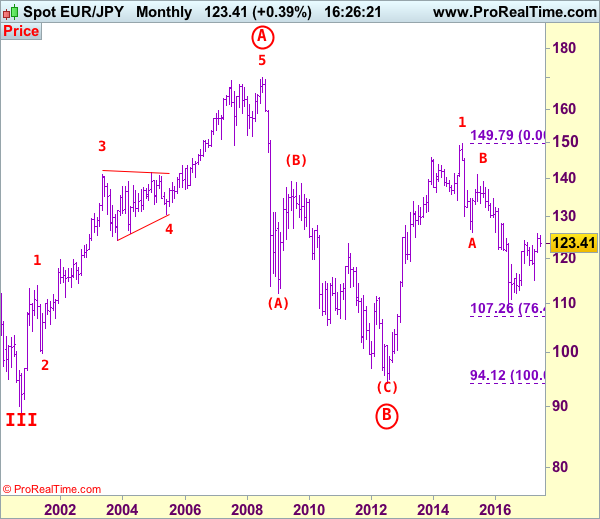
The daily chart is labeled as attached, early selloff from 169.97 (July 2008) to 112.08 is wave (A) of B instead of end of entire wave B and then the rebound from there to 139.26 is wave (B), hence, wave (C) has possibly ended at 94.12 with a diagonal triangle as labeled in the daily chart, hence upside bias is seen for further gain. Recent rally above indicated retracement level at 116.69 (50% Fibonacci retracement of the intermediate fall from 139.26-94.12) adds credence to this view and signal major reversal has commenced but first leg of this wave C has possibly ended at 149.79, hence wave 2 has commenced with wave A ended at 126.09, followed by wave B at 141.06, wave C commenced and could have ended at 109.49, above 126.00 would add credence to this view, then headway to 130.00 would follow.
On the downside, expect pullback to be limited to 123.50-55 and bring another rise later. Only below said support at 122.40 would defer and risk another corrective fall to 122.00-10, however, reckon downside would be limited and 121.60-65 (38.2% Fibonacci retracement of 114.85-125.82) and bring another rise later. A daily close below 121.60-65 would defer and suggest top is formed instead, risk correction to 121.00 and possibly towards support at 120.60 but reckon 120.30-35 (50% Fibonacci retracement) would limit downside and psychological level at 120.00 should hold.
Recommendation: Buy at 123.50 for 125.50 with stop below 122.50.
To re-cap the corrective upmove from the record low of 88.93 (18 Oct 2000), the wave A from there is subdivided as: 1:88.93-113.72, 2:99.88 (1 Jun 2001), 3:140.91 (30 May 2003), 4:124.17 (10 Nov 2003) and 5 ended at record high of 169.97 (21 Jul 2008). The brief but sharp selloff to 112.08 is viewed as a-b-c x a-b-c wave (A) of B. The subsequent rebound to 139.26 is (B) of B and (C) of (B) has possibly ended at 94.12 and in any case price should stay well above previous chart support at 88.93, bring rally in larger degree wave C towards 150.00.
USD/CHF Elliott Wave Analysis
USD/CHF – 0.9723
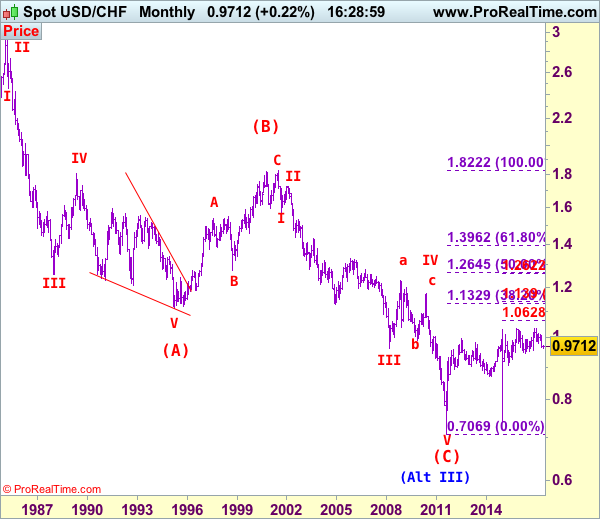
USD/CHF – Wave IV ended at 1.1730 and wave V has possibly ended at 0.7068
Although the greenback has retreated after meeting resistance at 0.9771, if our view that a temporary low has possibly been formed at 0.9613 earlier this month is correct, downside should be limited to 0.9695-00 and bring another rebound later, above said resistance at 0.9771 would add credence to this view, bring test of resistance at 0.9808-13, however, a daily close above this level is needed to bring retracement of recent decline to 0.9855-60, then towards 0.9900. Having said that, near term overbought condition should limit upside and price should falter well below psychological resistance at 1.0000, bring another decline later.
Our preferred count on the daily chart is that early selloff to 0.9630 is an end of the larger degree wave III and major correction is unfolding from there with a leg ended at 1.2298 (Nov 2008 with (a): 1.0625, (b):1.0011 and (c):1.2298), wave b ended at 0.9910 with (a): 1.0370, (b): 1.1967, (c): 0.9910. The rise from there to 1.1730 is the wave c which also marked the end of wave IV and wave V has possibly ended at 0.7068.
On the downside, expect pullback to be limited to 0.9695-00 and bring another rebound. Below last week’s low at 0.9641 would risk another test of this month’s low at 0.9613 but break there is needed to revive bearishness and signal the decline from 1.0344 top has resumed for further weakness to 0.9600, then towards previous chart support at 0.9550 (Nov 2016 low), however, still reckon downside would be limited and price should stay well above another chart point at 0.9444 (2016 low).
Recommendation: Hold long entered at 0.9700 for 0.9900 with stop below 0.9600

Dollar's long-term downtrend started from 2.9343 (Feb 1995) and it was unfolding as a (A)-(B)-(C) with (A): 1.1100, (B): 1.8310 (26 Oct 2000), then followed by another impulsive wave (C) with wave III ended at 0.9630 (Mar 2008). Under this count, correction in wave IV has possibly ended at 1.1730 and wave V already broke below support at 0.9630 and met indicated downside target at 0.7500 and 0.7400. The reversal from 0.7068 suggests the wave V has possibly ended and the breach of resistance at 0.9595 add credence to this view and indicated upside target at 1.0000 had been met, however, the sharp retreat from 1.0296 to 0.7401 suggests choppy trading would be seen but price should stay above said record low at 0.7068.