

Sample Category Title
Foreign Exchange Market Commentary: EUR/USD, USD/JPY, GBP/USD, GOLD, WTI CRUDE, DJIA, FTSE100, DAX
EUR/USD
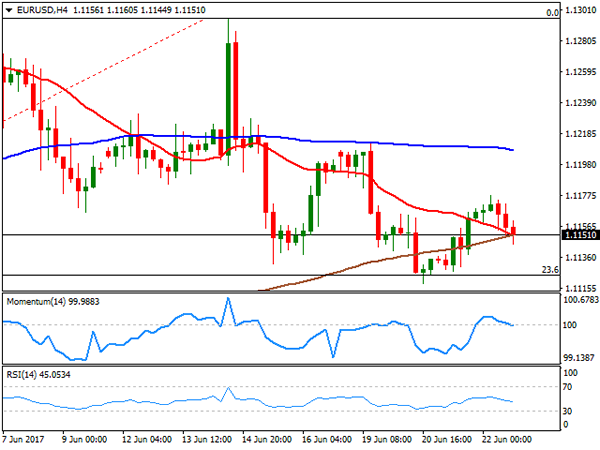
Majors saw very limited action this Thursday, with the EUR/USD pair setting around 1.1150 after peaking at 1.1177 during Asian trading hours. There were no relevant macroeconomic releases but consumer confidence improved in the EU according to June preliminary estimates improved to -1.3 from previous -3.3 and beating expectations of -3.0. In the US, weekly unemployment claims ticked higher, reaching 241K for the week ended June 16th, slightly worse than the 240K expected, while the April Housing Price index advanced 0.7% in the month, unchanged from March's final reading.
In the news, Fed's Bullard said that the projected rate path was "unnecessarily aggressive," but also that the Central Bank should begin shrinking its balance sheet "sooner rather than later," hardly a surprise coming from him, while GOP leaders released their Obamacare replacement bill that still needs to pass the Congress and already has opposition among Republicans. Indeed, dark clouds ahead for Mr. Trump, and therefore for the greenback.
In the meantime, the pair continues trading uneventfully near the lower end of its last five-week range, lacking directional strength. Technically, the risk remains towards the downside, although intraday readings maintain a neutral stance, given that in the 4 hours chart, the price is hovering around the 20 and 200 SMAs, both converging around 1.1150, while technical indicators head modestly lower around their mid-lines. There's a strong support in the 1.1110/20 region, where the pair has relevant lows alongside with the 23.6% retracement of its latest bullish run, with a stronger one at 1.1075. Below this last, the pair has scope to extend its decline towards the 1.1000 critical support.
Support levels: 1.1110 1.1075 1.1030
Resistance levels: 1.1220 1.1260 1.1300
USD/JPY
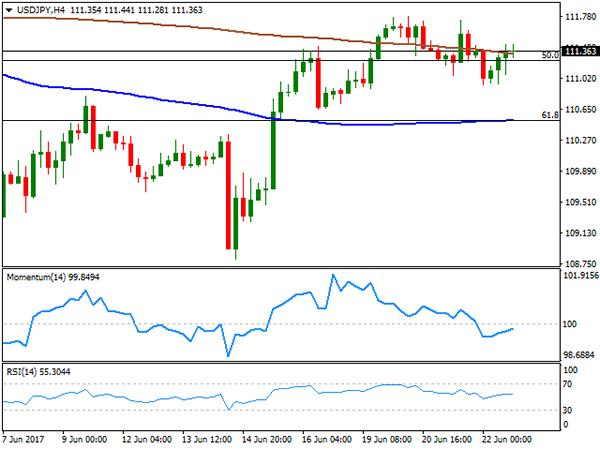
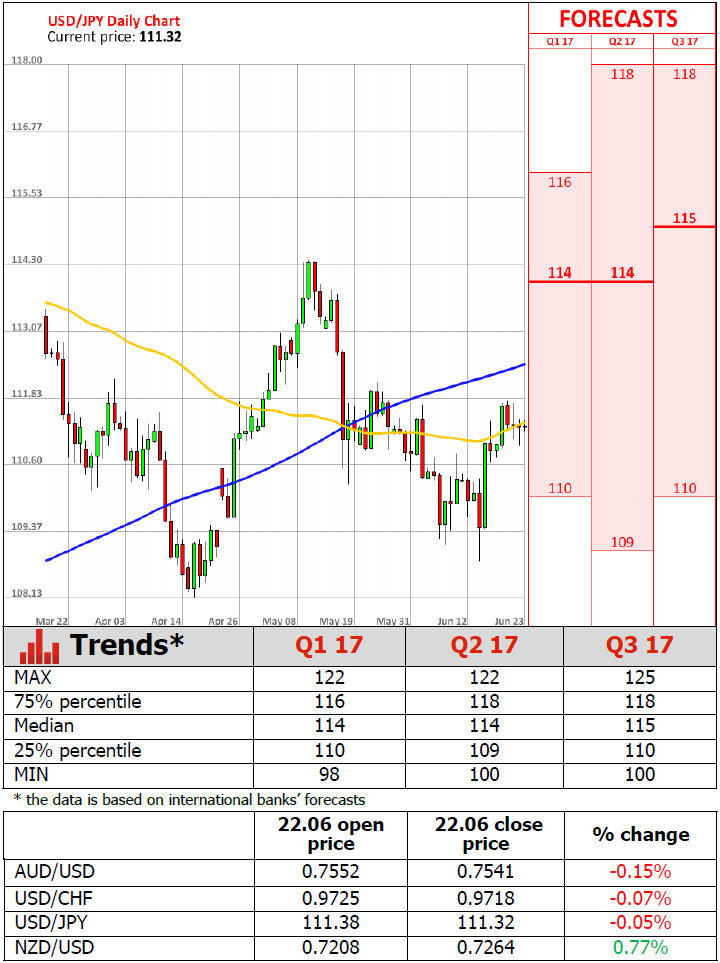
The USD/JPY pair closed flat for a second consecutive day in the 111.30 region, although daily basis, it posted a lower high and a lower low, indicating that the risk remains towards the downside. There were no major news coming from Japan this Thursday, while in the US, slightly weaker-than-expected weekly unemployment claims limit chances of dollar's gains. Claims in the week ended June 16th came in at 241K from a previously revised 238K. During the upcoming Asian session, Japan will release its June preliminary Nikkei Manufacturing PMI, expected to tick higher from May's figures. If that's the case that JPY may get an additional boost. In the meantime and from a technical point of view, the chart shows that the price has been contained below its 100 DMA ever since the week started, but also that the momentum indicator heads higher within positive territory, as the RSI stands flat around its mid-line. In the 4 hours chart the price is stuck around its 200 SMA, while technical indicators remain flat around mid-lines, giving no clear directional clues.
Support levels: 111.25 110.80 110.50
Resistance levels: 111.60 112.00 112.45
GBP/USD
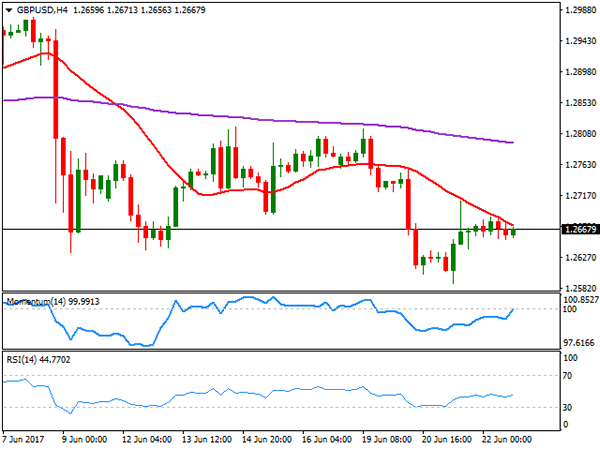
The Sterling lost its upward momentum this Thursday, with the GBP/USD pair ending the day marginally lower in the 1.2660 region, as enthusiasm over a rate hike in the UK triggered by BOE's Haldane cooled down. PM Theresa May was in Brussels, exposing to EU leaders her plan on EU citizens' rights in the UK after the split, but EU diplomats clearly rolled the ball saying that negotiations are on to Michel Barnier. In the meantime, May is still struggling to form a government, with the latest news showing that the DUP broke off talks with Theresa May for this week as it told her to spend £2billion in Northern Ireland if she wants the party to prop up her minority Conservative Government. From a technical point of view, the 4 hours chart shows that the pair has been trading below a bearish 20 SMA, unable to extend beyond it, but holding nearby ever since the day started. In the same chart, technical indicators have advanced within negative territory, but pared gains around their mid-lines, not enough to confirm a new leg higher. Nevertheless, a break above 1.2710/20, the immediate resistance, could favor an advance for this Friday.
Support levels: 1.2635 1.2590 1.2560
Resistance levels: 1.2715 1.2750 1.2795
GOLD
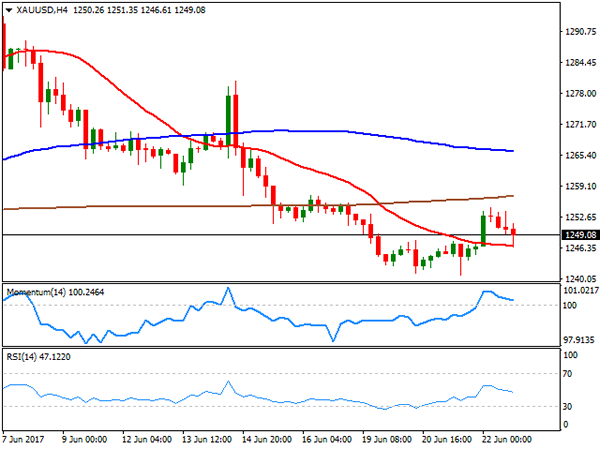
Spot gold advanced at the beginning of the day to trade at $1,254.63 a troy ounce, but trimmed most of its daily gains to settle at 1,249.20. The early advance was supported by broad dollar's weakness, and easing long-term US Treasury yields that led to the yield-curve to flatten to an almost 10-year low on Wednesday. Also, helping gold were persistent weakness in equities during the Asian and European sessions alongside with political uncertainty. The commodity advanced modestly for a third consecutive day, but the technical picture keeps favoring the downside as in the daily chart, the price was unable to advance beyond a horizontal 100 SMA, while technical indicators continue heading south within bearish territory. In the 4 hours chart, the price has settled above a horizontal 20 SMA while technical indicators have bounced modestly from their mid-lines, but remain below previous daily highs limiting chances of a stronger recovery.
Support levels: 1,241.95 1,230.90 1,222.80
Resistance levels: 1,257.20 1,265.90 1,273.90
WTI CRUDE OIL
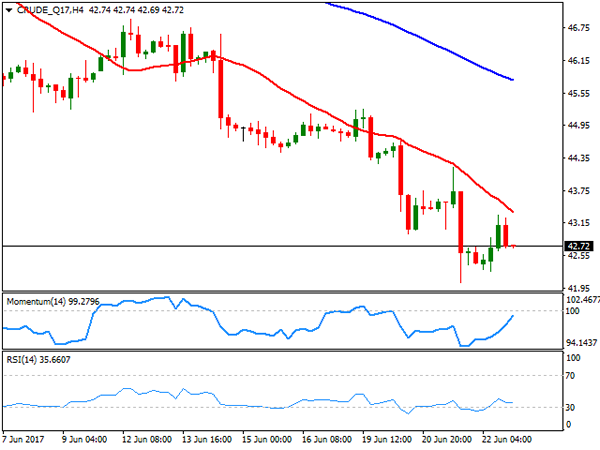
Crude oil prices recovered modestly with West Texas Intermediate crude futures settling 0.5% higher daily basis at $42.70 a barrel. There were no fresh market headlines affecting the commodity, with the movement seem due to traders locking some profits after Wednesday's sharp slide that led to a fresh 10-month low. The technical picture remains bearish, given that in the daily chart, the price held far below a bearish 20 DMA, while the Momentum indicator keeps heading south within oversold readings as the RSI consolidates around 24. Additionally, the price hovered at the lower half of its previous day's range. Shorter term, and according to the 4 hours chart, intraday advances met selling interest around a bearish 20 SMA, currently offering a dynamic resistance around 43.35, whilst technical indicators have bounced partially, but remain well below their mid-lines, in line with further declines ahead.
Support levels: 42.10 41.65 41.10
Resistance levels: 43.35 43.80 44.50
DJIA
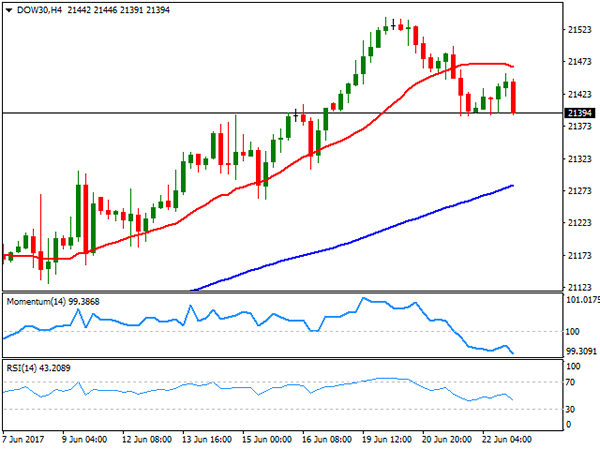
US indexes closed mixed this Thursday, with the DJIA and the S&P down, and the Nasdaq Composite barely up, despite a rally in health care equities following the release of the new US healthcare projected bill, and a bounce in oil prices. The Dow settled 12 points lower at 21,397.29, while the S&P lost 1 point or 0.05%, to 2,434.50. The Nasdaq, on the other hand, gained 2 points to 6,236.69. Republicans presented a 142-page draft of their bill to repeal Obamacare, but still needs to pass the Congress. Within the Dow, Merck & Co. was the best performer, up 0.86%, followed by United Health Group that added 0.85%. Goldman Sachs led decliners with a 1.22% lost. The DJIA trades at the lower end of its weekly range, but the downside potential remains limited, as the index continues trading well above all bullish moving averages, whilst technical indicators pared their previous decline and turned flat well above their mid-lines. In the 4 hours chart, and for the short term, however, the risk is towards the downside given that the index is developing below a horizontal 20 SMA, whilst technical indicators turned south within negative territory.
Support levels: 21,389 21,351 21,303
Resistance levels: 21,449 21,495 21,542
FTSE100
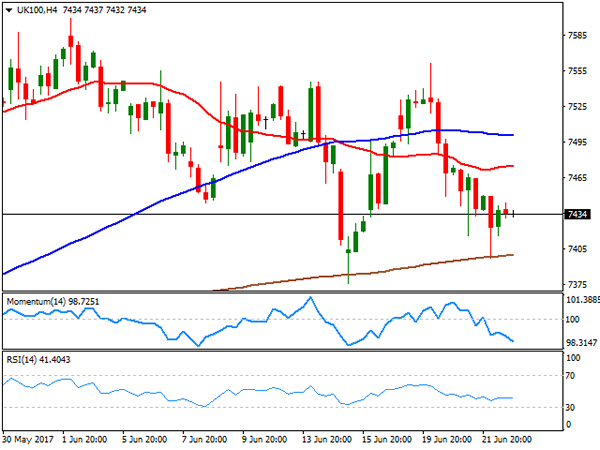
The FTSE 100 closed the day at 7,439.29, down 8 points, but off its daily low as oil´s bounce helped the benchmark trim early losses. Nevertheless, more members closed down, with WM Morrison Supermarkets being the worst performer, down 270%, followed by TUI that shed 2.17%. Shire on the other hand led advancers, adding 3.72%, followed by Provident Financial that added 3.64%. Commodity-related equities managed to recover some ground amid an advance in gold prices, with Randgold Resources up 1.22% and Antofagasta adding 1.18%. Overall, Brexit jitters continued dominating the Pound and the Footsie, with a high degree of political uncertainty keeping investors in cautious mode. The daily chart for the London benchmark shows that the index is down for a third consecutive day, extending below a now bearish 20 DMA, and with technical indicators heading further lower within negative territory, in line with further slides ahead. In the shorter term, and according to the 4 hours chart, the risk is also towards the downside, with the Momentum heading south within negative territory, the RSI indicator turning lower around 40, and the benchmark still developing below its 20 and 100 SMAs.
Support levels: 7,403 7,376 7,327
Resistance levels: 7,499 7,541 7,584
DAX
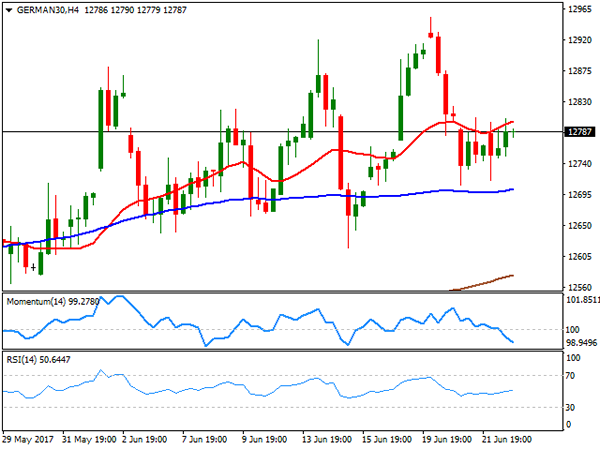
European equities closed mixed, but off their daily lows, with the German DAX managed to add 19 points, to close at 12,794.00, as commodity-related equities pared losses on oil's shallow bounce, also helped by a recovery in health stocks. ThyssenKrupp extended its bullish run, leading winners' list for a third consecutive session, up by 4.29%, followed my Merck that added 2.53%. Among the worst performers were Linde, down 1.39% and Heidelberg Cement that shed 0.84%. The daily chart for the index shows that if bounced from a horizontal 20 DMA for a second consecutive day, but remain nearby, while technical indicators keep retreating within positive territory, with limited bearish strength, rather indicating more range trading ahead than suggesting an upcoming downward move. In the 4 hours chart, the index remained contained by selling interest around its 20 SMA, now at 12,805 while technical indicators head south within negative territory, indicating limited buying interest around the benchmark, probably amid increasing political uncertainty.
Support levels: 12,719 12,653 12,605
Resistance levels: 12,805 12,851 12,892
Technical Outlook: EURUSD – Near-Term Action Maintains Bullish Bias, Eyes 1.1200 Pivot
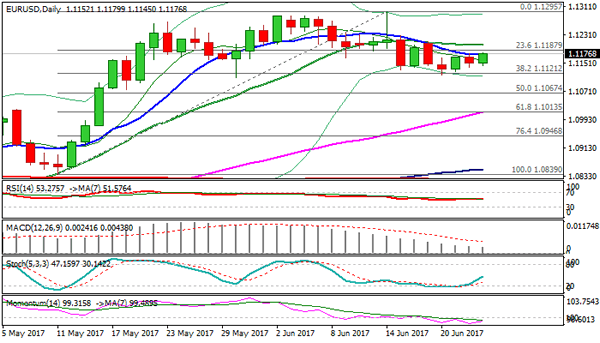
The Euro is maintaining bullish tone in early European trading on Friday and probing above Thursday's high / 10SMA at 1.1177, after downside attempts were repeatedly contained by widening hourly cloud.
Broader bulls are looking for extended upside action which requires break above 10/20 SMA's at 1.1177/1.1201 respectively, to confirm higher base and open way for fresh attack at 1.1300 zone targets.
Corrective dips should hold above 1.1160 (hourly cloud top, reinforced by hourly Tenkan-sen / Kijun-sen bull cross) to keep near-term bullish bias in play.
Otherwise, renewed downside risk towards 1.1140/45 (Wed/Thu lows and key supports at 1.1121/09.
Mixed PMI data Eurozone, Germany and France offered mild support the pair.
Res: 1.1180, 1.1201, 1.1228, 1.1268
Sup: 1.1160, 1.1140, 1.1121, 1.1109
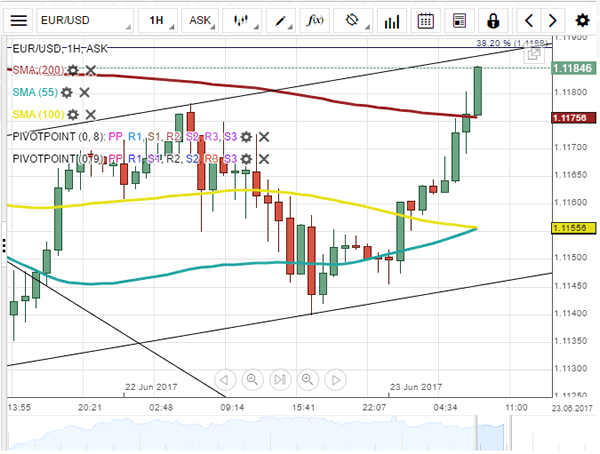
EUR/USD Analysis: Reveals New Pattern
The EUR/USD currency exchange rate did not bounce off the resistance of the 200-hour SMA, as it was forecasted on Thursday. However, the pair began a decline without the help of the resistance level. Moreover, by the end of the day's trading session the surge of the Euro against the US Dollar was resumed. Due to that reason a more in-depth analysis was done. As a result of the closer look, a short term ascending channel pattern was mapped. Although in accordance with the channel the pair should surge at least to the 38.20% Fibonacci retracement level at the 1.1188 mark, it is highly possible that the 200-hour SMA, which on Friday was located at the 1.1176 level, will force the currency pair to change its direction sooner than expected.
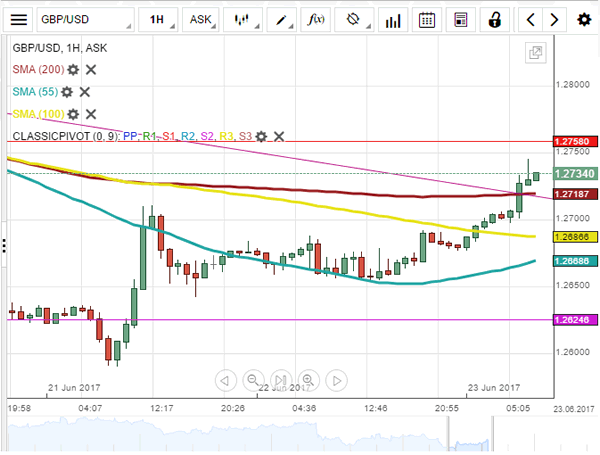
GBP/USD Analysis: Points To Weakness
During the last trading session, the Sterling demonstrated solid appreciation against the US Dollar, crossing the 20– and 100-hour SMAS along the way. The pair has approached a short-term down-trend near the 1.2710 mark, reinforced by the 200-hour SMA and the 23.6% Fibo at 1.2717 and 1.2720, respectively. The pair has been trading below the given SMA for most of the down-trend, suggesting that this may serve as a stopping point in this session, as well. Technical indicators are generally bearish, demonstrating that the down-trend may, in turn, be respected. Thus, it is likely that the Pound tests the 1.2717 level prior to edging lower mid-day. The subsequent fall might be stopped by the 55-day SMA located circa 1.2660. On the contrary, an upward breakout would put the monthly S1 at 1.2758 to the test.
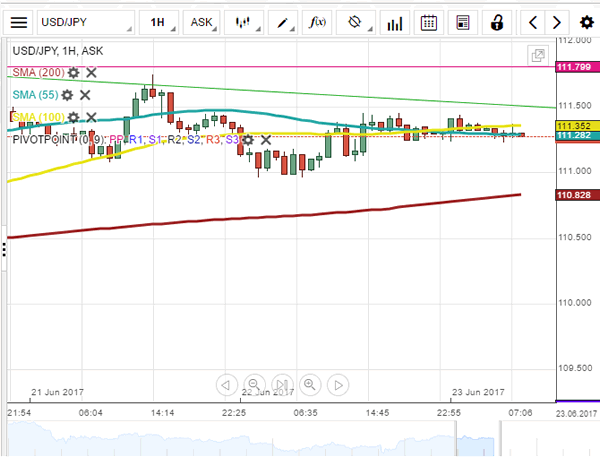
USD/JPY Analysis: Tests Channel Boundary Once More
Despite being pressured to the downside early Thursday, USD/JPY made a U-turn and moved closer the upper channel boundary. The given level, however, was not reached, allowing some room for further appreciation up to 111.42. Yesterday's trading session resulted in a death cross of the 55– and 100-hour SMAs, thus flashing bearish signals. Other technical indicators likewise support a possible fall down to the 111.05/10 territory. As no significant fundamental events are scheduled for today, the pair may continue its movement sideways, setting the aforementioned 111.42 and 111.05 as a possible trading range. In case of strong upward risks, the US Dollar should cap at the 111.80 mark where the monthly PP is located.
Gold Analysis: Trades Near 1,250 Level
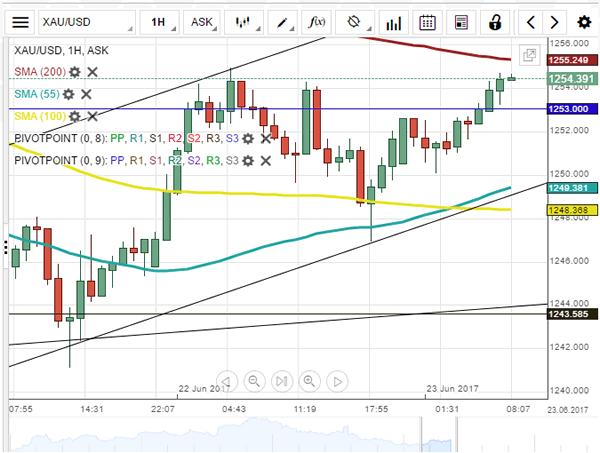
The yellow metal has revealed a short term ascending channel pattern. The pattern could be drawn only after the fluctuations of Thursday's trading session showed, where the reference points of the pattern's trend lines are located at. However, during Friday's trading session the borders of the channel most likely will not play a significant role. The 200-hour SMA is set to be of more importance, as the pair had once more reached above the monthly PP at 1,253 while the mentioned SMA was preparing to provide resistance at 1,255.40. It is highly likely that the SMA will push the pair into a combined support of the monthly PP and the lower trend line of the short term junior pattern.
Canadian Retail Trade Rebounds At Stronger-Than-Expected Pace
'The solid run of Canadian data continues. There's nothing here to alter the Bank of Canada's now more hawkish path.' — Benjamin Reitzes, Bank of Montreal
Canadian retail trade rebounded more than expected in April amid higher gasoline prices and higher demand for home appliances and garden supplies. Statistics Canada reported on Thursday that retail sales climbed 0.8% in April, following the preceding month's downwardly revised gain of 0.5% and surpassing analysts' expectations for a 0.3% increase. Apart from that, Thursday's data showed that core retail sales surged 1.5% during the same month, compared to March's upwardly revised fall of 0.1%, whereas analysts anticipated a rise of 0.6%. In volume terms, sales advanced 0.3%. Sales in the building material, garden equipment and supplies sector climbed 3.5%, marking the largest gain in about two years. Furthermore, sales at merchandise stores advanced 2.1%, while sales at gasoline stations rose 1.7% helped by higher prices. In the meantime, sales of vehicles and parts dropped 1.0%. Moreover, Statistics Canada said sales were up in nine out of the 11 subsectors, accounting for 71% of total retail trade. Analysts suggest strong retail sales figures would likely please the Bank of Canada ahead of its next policy meeting.
Initial Jobless Claims Rise In Line With Forecasts Last Week
'Our findings suggest that the labor market has already slightly overshot full employment.' - Daan Struyven, Goldman Sachs
The number of Americans filing for unemployment benefits rose slightly last week, official figures revealed on Thursday. The US Department of Labour reported that initial jobless claims rose to 241K in the week ended June 16, following the preceding week's upwardly revised 238K but meeting market analysts' expectations. Initial claims remained below the 300K level for the 120th week, the longest streak since 1973. The four-week moving average of initial jobless claims climbed 1.5K to 244,750 last week, the highest level since April. Apart from that, Thursday's data also showed that the number of people continuing to receive jobless benefits rose 8K to 1.94M in the week ended June 10. Continuous claims remained below the 2M level for 10 consecutive weeks, pointing to the strong labour market trends. According to some analysts, the US labour market is at or close to full employment, with the unemployment rate at a 16-year low of 4.3%. If the jobs market continues to perform strong, the Fed will likely speed up interest rate hikes. However, to make the next rate hike policymakers will also focus their attention on inflation growth.
USDCAD Short-Term Bearish Below 200-Day MA, Neutral In Medium-Term
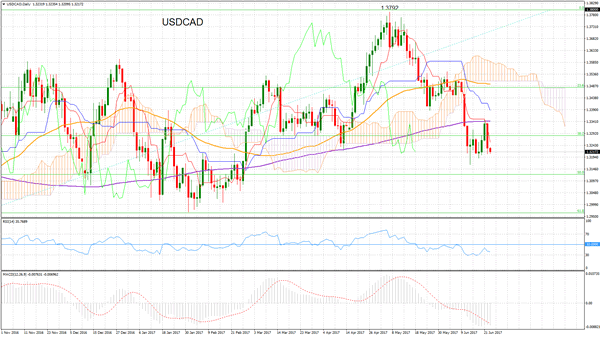
USDCAD has been in a downtrend since falling from the May 5 high of 1.3792. There is risk to the downside since the momentum indicators are bearish. RSI is below 50 and MACD is below zero and trending down.
Other bearish signals were given when the tenkan-sen crossed below the kijun-sen on May 24. Trend indicators are also showing a bearish picture, as the market is below the Ichimoku cloud and below the 200-day moving average.
Major resistance is now being provided by this 200-day MA at 1.3342. A sustained break above this would start to weaken the downside bias and prices would target the base of the cloud at 1.3507. From here prices would move into the cloud. Rising above the cloud top at 1.3612 would negate the bearish bias.
Immediate support is at the June 14 low of 1.3163 and a fall below this level would target the January 31 low of 1.2968.
In the bigger picture, staying within the range of 1.3000 and 1.3600 would keep a neutral bias for the medium-term
Oil-Linked Currencies Gain With The Commodity’s Rise, Dollar Retreats
As the Asian trading session is coming to a close, the dollar is modestly down while commodity-linked currencies, such as the loonie, are gaining ground versus the greenback on the back of oil rising.
The dollar index, a broader gauge of the US currency's strength, was last down two-tenths of a percent on the day. Dollar/yen was slightly down at 111.25. If it closes the day lower, it would be the fourth consecutive day of declines for the pair. The retreat in the previous three days was only minor in nature though, failing to erase the greenback's gains versus the yen on Monday. Euro/dollar was up at 1.1177, more than making up for yesterday's fall by 0.1%.
Among others, the final core PCE figure for the first quarter of the year, which is the Federal Reserve's preferred inflation measure, will be released next week. It will be closely watched given recent weak inflation numbers out of the US. Should the measure disappoint, market participants might fear it would postpone the Fed's plans on hiking rates.
Sterling faced added volatility this week on conflicting signaling by Monetary Policy Committee (MPC) members, including the Bank of England Governor, Mark Carney. The last member to contrast Carney's dovishness through her comments was Kristin Forbes, who voted for a rate hike in the previous two BoE rate-setting meetings and who will be stepping down from the MPC by the end of the month. Sterling maintains yesterday's momentum following her comments and was last trading at $1.2738 versus the greenback after commencing trading at $1.2681. The pound's gains extend relative to the euro as well with euro/pound at 0.8771, down from the day's open of 0.8793.
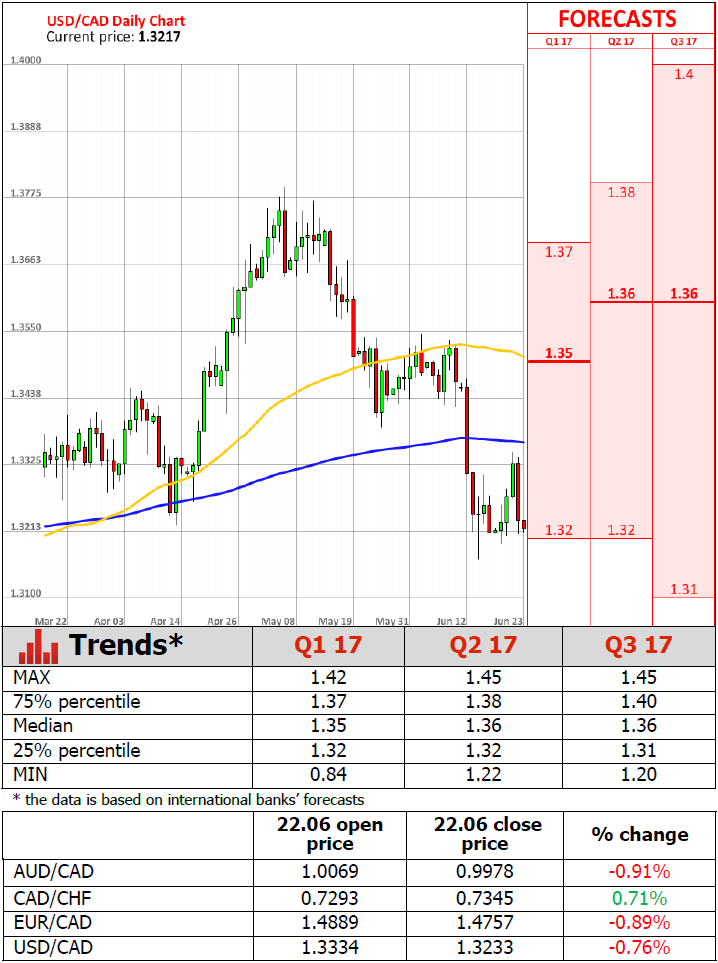
The Canadian dollar was helped by stronger-than-expected retail sales numbers and the rebound in oil to gain by 0.75% versus its US counterpart in yesterday's trading and trade below the C$1.33 handle. In today's trading, dollar/loonie is slightly down on the day at 1.3223.
The commodity-linked aussie was up four-tenths of a percent versus the greenback at $0.7568 after declining for four straight days, while the kiwi, a strong performer yesterday following the New Zealand central bank's meeting, extended gains today to rise to a four day high of $0.7289.
In commodities, gold last marginally exceeded the $1253 an ounce mark, gaining on dollar weakness. The precious metal is on its third day of advances following a downtrend starting in the first week of June that pushed it to the one-month low of $1240.74. WTI and Brent crude oil were last trading at $42.83 and $45.34 a barrel respectively, both up two-tenths of a percent, maintaining yesterday's momentum for the time being.
Regarding the rest of the day, the economic releases that are expected to attract most attention are the preliminary PMI estimates out of the eurozone and the US for the manufacturing and services sectors, as well as Canadian inflation figures and US new home sales data. Numerous speeches by FOMC members, including voting member Jerome Powell, will also be watched by forex market participants.