Sample Category Title
Technical Outlook: WTI Oil Is Holding Within Tight Range Ahead Of US Crude Inventories
WTI oil price is trading within narrow consolidation on Wednesday, holding above Tuesday's low at $42.94, the lowest since 14 Nov 2016.
Strong bearish acceleration in past two days has eventually taken out important support at $43.74 (05 May low) and generated fresh bearish signal.
Oil prices remain under strong pressure on concerns about increase in US oil production that adds on growing fears about global oversupply.
Bears are eyeing next target at $42.19 (14 Nov low) with psychological $40.00 support expected to come in focus on stronger bearish acceleration
Release of better that expected API crude stocks data on Tuesday (crude inventories fell by 2.7 million barrels vs forecasted 2.1 million barrels draw) did not show stronger impact on oil prices, as traders are focusing on today's release of EIA weekly crude stocks report, due at 14:30 GMT. Oil inventories are forecasted for 1.2 million barrels draw, below last week's draw of 1.7 million barrels, which may pressure oil prices further on release at/below forecast.
Firmly bearish technical studies are supportive for further weakness, as oversold conditions have so far been ignored, however, corrective action should be anticipated in coming sessions.
Falling 10SMA which tracks the downtrend since 30 May offers solid resistance at $44.80 (reinforced by daily Tenkan-sen) which is expected to ideally limit corrective rallies.
Res: 43.59, 44.07, 44.80, 45.03
Sup: 42.94, 42.72, 42.19, 41.09
Technical Outlook: AUDUSD Risks Deeper Pullback Towards 200SMA
The Aussie dollar stays in red for the third consecutive day, extending pullback from 0.7630 zone after multiple upside rejection.
Fresh bearish extension on Wednesday cracked supports at 0.7566/57 (10 / 100SMA’s) and increasing risk of further easing towards key near-term supports at 0.7539 (daily cloud top) and 0.7534/27 (Fibo 38.2% of 0.7369/0.7635 / 200SMA.
Correction should be ideally contained here to keep larger bulls intact for renewed attempts above 0.7600 and extension towards targets at 0.7650 (Fibo 76.4% of 0.7749/0.7328) and 0.7679 (30 Mar lower top).
Conversely, break lower would sideline broader bulls for deeper correction.
Res: 0.7586, 0.7623, 0.7635, 0.7650
Sup: 0.7539, 0.7527, 0.7512, 0.7490
Technical Outlook: USDJPY – 200/20SMA’s To Ideally Contain Pullback
The pair extends pullback from Tuesday's rejection at 111.78 and pressures psychological 111.00 support, reinforced by 55SMA. Slow stochastic is in deep overbought territory on daily chart and sees risk of deeper pullback on reversal.
Strong supports at 111.80 (200SMA) and 111.65 (20SMA/Fibo 38.2% of 108.80/111.78) should ideally contain correction to keep in play fresh upside attempts, which could be also attracted by thinning daily cloud.
Conversely, firm break below 111.80/65 pivots would signal reversal and open way for further retracement of 108.80/111.78 upleg and expose psychological 110.00 support.
Res: 111.33, 111.48, 111.78, 112.24
Sup: 111.02, 110.65, 110.29, 110.00
Oil & GBP Slide Lower
Oil continues to be under 'over supply' pressure resulting in prices dipping to 7 month lows. Yesterday Oil suffered a 2% drop as the increased supply from several key producers undermined OPEC producers deal to reinforce a cut in global output. For those traders following technicals the recent fall in Oil equates to a 20% fall from recent highs signaling official 'bearish' territory. In early trading WTI was trading around $43.35pb and Brent was trading just below $46pb.
GBP dropped on Tuesday, and continued to be soft, after Bank of England Governor Mark Carney stated 'that there would be no immediate adjustment of monetary policy by the central bank' in a speech he delivered at Mansion House in London. He also stated that 'this stimulus is working, and that credit is widely available, the cost of borrowing is near record lows, the economy has outperformed expectations and unemployment has reached a 40-year low'. Because of his comments the market has reacted that an interest rate rise is highly unlikely.
GBPUSD dropped from 1.2753 at 8:00 BST to 1.2631 just before 15:00 BST in response to Carney's comments yesterday. Overnight GBPUSD has traded in a range of 1.25885 to 1.26345 currently trading near the lows at 1.2590.
Today sees the State Opening of Parliament in the UK. An event normally full of pomp but, due to the snap election, will be somewhat muted. Whilst the Conservative Party is the largest party in Government there are still concerns that they may not gain the support of the DUP in Northern Ireland and gain the slim majority they need to govern without complications from other parties. Regardless, Prime Minister May will have a greatly trimmed down manifesto with the focus being Brexit and the state of the UK economy. We can expect GBP to continue to be under some pressure because of these uncertainties.
EURUSD recovered slightly, after hitting a 3 week low, currently trading around 1.1130. USD also eased against JPY currently trading around 111.19.
At 15:30 GMT the EIA Crude Oil Stocks change (June 16) are released. The consensus is -2.106M with the previous release at -1.661M. Regardless of the figure that is released we are expecting volatility in Crude Oil.
BoE’s Carney Says It’s Not Time For Hikes, Queen’s Speech In Focus
Yesterday, BoE Governor Mark Carney indicated that now is not the time to raise rates. The pound tumbled as his comments probably poured cold water on speculation that BoE rate hikes may be looming, a prospect that attracted attention after 3/8 MPC members surprisingly voted for an immediate hike at last week's BoE meeting. These remarks reinforce our view that the BoE will probably continue 'looking through' above-target inflation, as a potential rate hike is likely to weigh on employment and growth in a period of political uncertainty. A media story that the UK's credit rating could soon be downgraded may have also weighed on the pound.
As for today, we expect market focus to turn back to UK politics, as the Queen's Speech takes place. The Queen will outline to Parliament a list of laws that the government wants to get approved over the coming year. Parliament will spend the next few days debating these plans, before holding a vote next week. Importantly, the agreement between the Tories and the DUP is not finalized yet, and recent media reports suggest the deal may even fall apart. This implies that May still lacks the majority she needs to get the Speech passed and stay on as PM.
Therefore, in the short-term, any signs that May can establish a government and/or that she may soften her Brexit stance, could lead to a relief rally in sterling, in our view. We could even get some soft Brexit signals in today's Queen's Speech. On the other hand, if May is unable to get the Queen's speech passed, then Labour leader Jeremy Corbyn would be invited to attempt to form a government. In this scenario, GBP could trade lower initially on the possibility of prolonged uncertainty over the timeline of the EU-UK talks. However, we think that the prospect of a Labour government or another election could result in a stronger pound overall, as the likelihood of a hard Brexit will probably diminish.
GBP/USD collapsed yesterday on Carney's remarks, falling below the support (now turned into resistance) of 1.2700 (R2), and subsequently breaking the 1.2635 (R1) hurdle. Although the price structure on the 4-hour chart still suggests a short-term downtrend, the rate is trading slightly above the crossroad of the longer-term upside support line taken from the low of the 7th of October and the prior downside resistance line drawn from the 6th of December. Combined with the fact that yesterday's tumble appears too steep, this makes us believe that there is the likelihood of a rebound back above 1.2635 (R1), something that may pave the way for a test near 1.2700 (R2) as a resistance this time.
RBNZ decision: Is the Kiwi too strong?
During the Asian morning Thursday, the RBNZ rate decision will be in the spotlight and the forecast is for the Bank to keep its policy steady. At its latest meeting, the Bank kept the door for further easing open, indicating that much of the recent progress in inflation was transitory. Meanwhile, policymakers noted that although growth was soft in H2 2016, the outlook remained positive. With regards to the Kiwi, they indicated that its 5% decline since February was encouraging, and that if sustained, this would help to rebalance the growth outlook.
However, ever since, developments on the latter two fronts have been quite discouraging. GDP data for Q1 showed that growth was only +0.5% qoq, far below the RBNZ's forecast of +0.9% qoq. On top of that, the NZD recovered notably, and is now trading at levels similar to those in February, when officials had noted that 'a decline in the exchange rate is needed'. Bearing all these in mind, we think that the Bank is likely leave the prospect for further easing on the table, and may also reintroduce its prior concerns regarding the exchange rate. In the extreme scenario, the RBNZ could even hint at FX intervention if needed to curb NZD's strength, as it did back in November. Any such signals could reverse some of the Kiwi's recent gains.
NZD/USD has been trading in an uptrend since the 12th of May, but in the last few days, the trend appears to be running out of steam. This is evident by the latest lower peaks in the price action and the declining momentum indicators. If indeed the RBNZ sounds more concerned tonight than it did in previous gatherings, then we may see the pair sliding below the 0.7215 (S1) support. Another break below 0.7180 (S2) would confirm a forthcoming lower low on the 4-hour chart and perhaps bring a short-term trend reversal.
As for the rest of today's highlights:
The economic calendar today is relatively light today. From Norway we get the AKU unemployment rate for April, while in Sweden, the consumer and manufacturing confidence indices for June are due out. From the US, we get existing home sales for May and the forecast is for a slowdown.
GBP/USD
Support: 1.2600 (S1), 1.2515 (S2), 1.2480 (S3)
Resistance: 1.2635 (R1), 1.2700 (R2), 1.2755 (R3)
NZD/USD
Support: 0.7215 (S1), 0.7180 (S2), 0.7150 (S3)
Resistance: 0.7270 (R1), 0.7300 (R2), 0.7320 (R3)
EURUSD Maintains Neutral Bias Between 1.11 And 1.13, Bullish Market Structure Intact
EURUSD maintains a neutral bias in the short-term, as the pair continues to trade between 1.1100 and 1.1300. In recent days, there has been some downward momentum following the failure to break above major resistance at 1.1300 after prices came very close to this level on June 14. There was a subsequent fall below 1.1200. This support-turned-resistance level is also close to the tenkan-sen line, making it an important resistance area.
Momentum indicators like the RSI and MACD are showing a downside bias as both indicators are falling. However, momentum is not that strong and the RSI has stalled its decline and remains close to the 50-point level.
A move by EURUSD below the May 30 low at 1.1108 would trigger a downside move to target 1.1056, which is the 50% Fibonacci retracement level of the upleg from 1.0820 to 1.1295 (April 24 to June 14). Falling below this level would strengthen the downside bias. Only a break above 1.1182 (23.6% Fibonacci) and above the key 1.1200 level would relieve any downside pressure.
The short-term trend is expected to remain neutral unless prices break out of the range, either above 1.1300 or below 1.1100 in order to give a clearer direction going forward. Looking at the bigger picture, the uptrend that started from the January 3 low at 1.0340 to the June 14 high of 1.1295 is still intact. Trend indicators are giving a bullish market structure, as prices are above the daily Ichimoku cloud and there was a bullish crossover of the 50-day moving average with the 200-day MA. Meanwhile, the 50-day MA is still rising.
EUR/CAD Elliott Wave Analysis
EUR/CAD – 1.4805
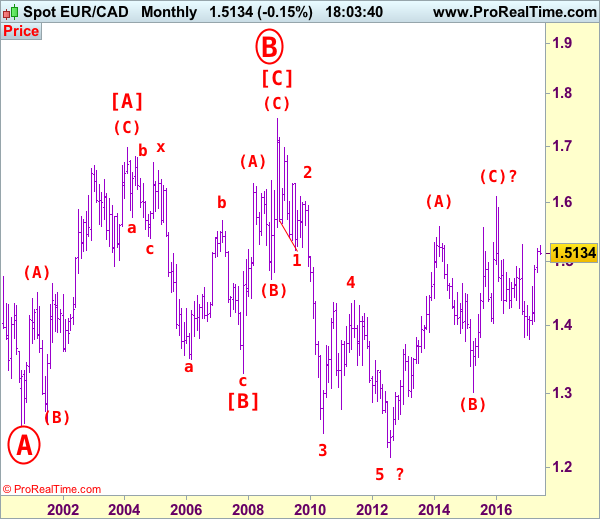
EUR/CAD: Wave 4 ended at 1.4380 and wave 5 as well as circle wave C has possibly ended at 1.2129, major (A)-(B)-(C) correction has commenced and indicated target at 1.6000 had been met.
Despite recent anticipated resumption of recent upmove to 1.5259 earlier this month, the subsequent sharp retreat suggests a temporary top has been formed there and consolidation with mild downside bias is seen for retracement of recent rise from 1.3784, hence further fall to 1.4700 would be seen, however, loss of near term downward momentum should limit downside to previous resistance at 1.4600 and price should stay above 1.4520-25 (50% Fibonacci retracement of entire rise from 1.3784-1.5259), risk from there is seen for a strong rebound to take place probably in Q3.
Our latest preferred count is that larger degree wave [C] from 1.3289 as well as circle wave B ended at 1.7509 in Dec 2008 with (A): 1.6325, (B): 1.4719 followed by wave (C) at 1.7509, hence circle wave C is unfolding with wave 1 ended at 1.5186 (diagonal wave 1), wave 2 at 1.6096, impulsive wave 3 has ended at 1.2451, followed by wave 4 at 1.4380, in view of recent strong rebound, we are now treating the wave 5 as well as larger degree circle wave C has ended at 1.2129, hence (A)-(B)-(C) correction has commenced from there with impulsive wave (C) now unfolding and indicated initial upside target at 1.6000 had been met and reckon 1.6500 would hold.
On the upside, whilst recovery to 1.4845-50 and possibly 1.4910-20 cannot be ruled out, reckon upside would be limited to 1.5000 and bring another decline later. Above 1.5100-10 would dampen this near term bearishness and suggest the retreat from 1.5259 has ended, bring a stronger rebound to 1.5155-60 but aside should be limited to 1.5200 and price should falter below said recent high at 1.5259.
Recommendation: Turn short at 1.5000 for 1.4700 with stop above 1.5100.
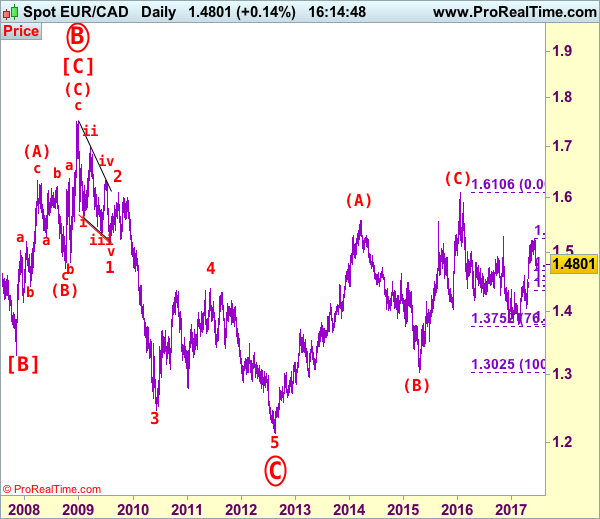
On the bigger picture, our long-term count on the monthly chart is that a big sideways consolidation from 2000 low of 1.2557 has possibly ended at 1.7509 as circle wave B with [A]: 1.6976 ( (A): 1.4513, (B): 1.2612, (C): 1.6976), wave [B]: 1.3289 is a double three with 1st a-b-c: 1.5384, x: 1.6709 and 2nd a-b-c: 1.3289. As indicated above, the wave [C] has ended at 1.7509. The selloff from there is now unfolding which itself should be labeled as an impulsive wave with wave 1: 1.5186 (diagonal wave 1), followed by wave 2: 1.6096 and wave 3: 1.2451, wave 4: 1.4380, wave 5 as well as larger degree circle wave C has possibly ended at 1.2129 and major correction has possibly commenced for retracement of recent decline towards 1.4000, then 1.4180-90 (38.2% Fibonacci retracement of 1.7509-1.2129). Below said support at 1.2129 would risk weakness to psychological support at 1.2000 and then 1.1851 (50% projection of 1.7509-1.2451 measuring from 1.4380) but reckon 1.1500 would remain intact, bring reversal later.
Technical Outlook: EURUSD Is Holding In Tight Consolidation, Key Near-Term Supports At 1.1121/09 Under Pressure
The Euro remains within tight range in early European trading and consolidating above Tuesday’s fresh three-week low at 1.1118.
Near-term outlook is bearish after strong fall in past two days and marginal close below former higher base at 1.1135, as bears dented next strong support at 1.1121(Fibo 38.2% of 1.0839/1.1295 upleg).
Profit-taking on larger uptrend and stronger dollar are seen as pair’s main drivers, with increased risk of deeper correction towards 1.1067/13 (Fibo 50% and 61.8% retracement of 1.0839/1.1295 upleg) seen on sustained break below of 1.1121/09 pivots.
Bear-cross of 10/20SMA’s maintains near-term bearish pressure, with falling 10SMA offering solid resistance at 1.1179 and guarding upper pivot at 1.1202, provided by 20SMA.
Res: 1.1138, 1.1165, 1.1179, 1.1202
Sup: 1.1121, 1.1109, 1.1067, 1.1013
AUD/USD Elliott Wave Analysis
AUD/USD – 0.7555
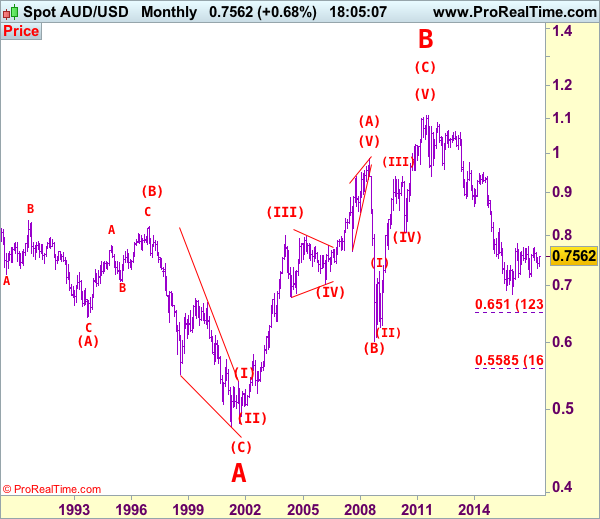
AUD/USD – Wave 5 of C and (B) has possibly ended at 1.1081
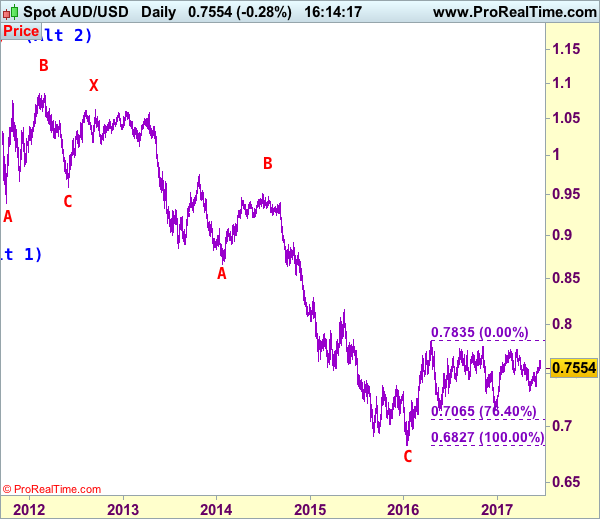
As aussie has eased after surging to 0.7636 last week, suggesting minor consolidation below this level would be seen and pullback to 0.7510-15 cannot be ruled out, however, reckon 0.7455-60 would contain downside and bring another rise later, above said resistance at 0.7636 would signal the rise from 0.7329 is still in progress, this would also reinforce our view that the fall from 0.7750 has ended at 0.7329, then further gain to previous resistance at 0.7680 would be seen but said resistance at 0.7750 would hold on first testing.
We are keeping our count that top has been formed at 1.1081 (wave 5 of V) and major correction (A-B-C-X-A-B-C) has commenced, indicated downside targets at 0.7945 (61.8% Fibonacci retracement of entire rise from 0.6007-1.1081) and 0.7750 had been met and downside bias is seen for further weakness to 0.6800, then 0.6700 but reckon 0.6500 would hold from here.
Our preferred count is that the rally from 0.6007 to 0.7270 (7 Jan 2009) is marked as wave A, the retreat to 0.6248 (2 Feb 2009) is wave B and the subsequent upmove is labeled as wave C with wave (iii) and wave (iv) ended at 0.8265 and 0.7700 respectively and wave (v) as well as 3 ended at 0.9407, then wave 4 ended at 0.8066 (instead of 0.8578). The wave 5 has met our indicated projection target of 1.1060 and could ended at 1.1081, this level is now treated as the peak of wave (C) as well as larger degree wave B, hence major fall in wave C has commenced, our initial downside target at psychological support at 0.7000 has just been met and further weakness to 0.6500 would be seen later.
On the downside, whilst pullback to 0.7500-10 cannot be ruled out, reckon downside would be limited to 0.7455-60 and bring another rise later. Only below support at 0.7415 would abort and suggest top is possibly formed, bring weakness towards said strong support at 0.7372 which is likely to hold from here. Looking ahead, a break below this support is needed to signal the rebound from 0.7329 has ended and revive bearishness for retest of this level later.
Recommendation: Turn long at 0.7470 for 0.7670 with stop below 0.7370.
Our alternate count on the daily chart treated the top formed in 2008 at 0.9851 could be a larger degree wave I and was followed by a deep and sharp correction in wave II to 0.6007 and wave III is unfolding from there.
The long-term uptrend started from 0.4775 (2 Apr 2001) with an impulsive structure. Wave I is labeled as 0.4775 to 0.9851 (15 Jul 2008), wave II has ended at 0.6007 (Oct 2008) and wave III is still in progress which may extend further gain to 1.1265.
Forex Technical Analysis: EUR/USD, USD/JPY, GBP/USD
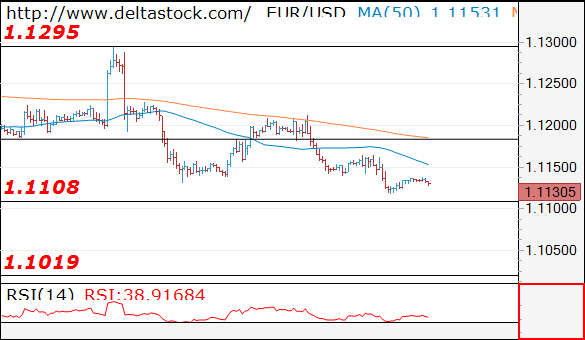
EUR/USD
Current level - 1.1130
The bias is bearish below 1.1140, for a break through 1.1108 low, towards 1.1020. Crucial on the lower frames is 1.1164.
| Resistance | Support | ||
| intraday | intraweek | intraday | intraweek |
| 1.1140 | 1.1360 | 1.1108 | 1.1020 |
| 1.1210 | 1.1610 | 1.1020 | 1.0838 |
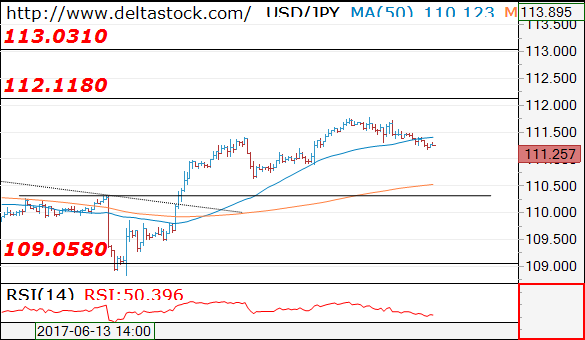
USD/JPY
Current level - 111.25
The slide from 111.80 is still intact despite its corrective nature and the outlook is bearish below 111.40, for a slide towards 110.90 and even 110.30.
| Resistance | Support | ||
| intraday | intraweek | intraday | intraweek |
| 111.40 | 112.10 | 110.90 | 109.08 |
| 112.10 | 114.30 | 110.30 | 108.12 |
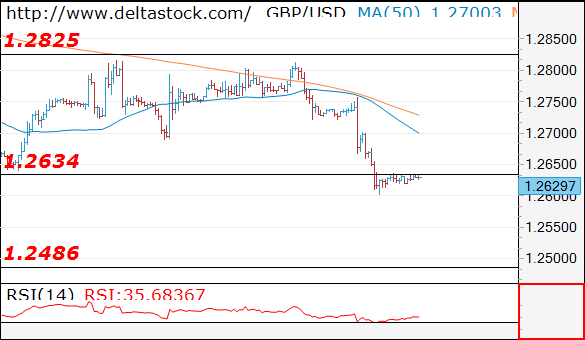
GBP/USD
Current level - 1.2629
My outlook remains bearish below 1.2640 minor resistance, for a slide towards 1.2480 area. Crucial on the upside is 1.2700 area.
| Resistance | Support | ||
| intraday | intraweek | intraday | intraweek |
| 1.2640 | 1.2970 | 1.2600 | 1.2480 |
| 1.2825 | 1.3050 | 1.2480 | 1.2480 |