Sample Category Title
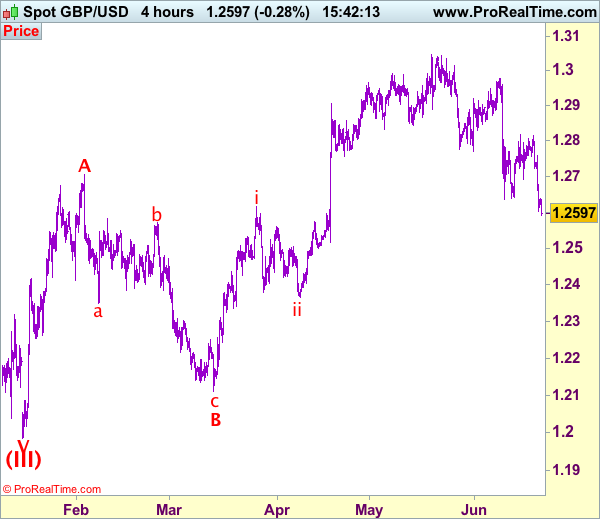
Trade Idea: GBP/USD – Sell at 1.2675
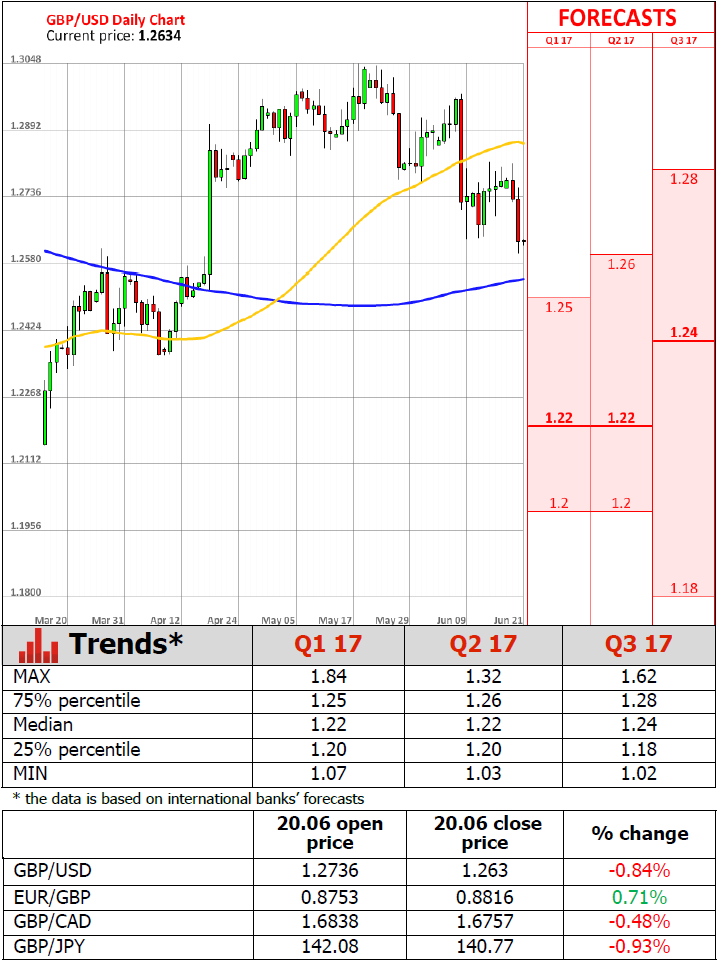
GBP/USD – 1.2591
Recent wave: Wave V of larger degree wave (III) has ended at 1.1986 and major correction has commenced from there for gain to 1.3000 and 1.3140-50
Trend: Near term down
Original strategy :
Sell at 1.2750, Target: 1.2600, Stop: 1.2810
Position: -
Target: -
Stop: -
New strategy :
Sell at 1.2675, Target: 1.2525, Stop: 1.2735
Position: -
Target: -
Stop:-
Yesterday’s selloff together with the breach of previous support at 1.2635 add credence to our view that recent decline from 1.3048 top has resumed and bearishness remains for this move to bring retracement of early upmove to 1.2550, then towards previous support at 1.2515, however, loss of near term downward momentum should prevent sharp fall below 1.2490-00 and reckon 1.2450-60 would hold.
Our preferred count on the daily chart is that cable's rebound from 1.3500 (wave (A) trough) is unfolding as a wave (B) with A ended at 1.7043, followed by triangle wave B and wave C as well as wave (B) has ended at 1.7192, the subsequent selloff is the larger degree wave (C) which is still unfolding with minor wave (III) of larger degree wave 3 ended at 1.1986, hence wave (IV) correction is in progress which could either be a triangle wave (IV) of a complex formation but upside should be limited to 1.3500 and price should falter well below 1.4000, bring another decline in wave (V) of 3 for weakness to 1.1500, then 1.1200.
On the upside, whilst recovery to 1.2640-50 cannot be ruled out, reckon 1.2675-80 would limit upside an bring another decline. Above previous support at 1.2723 would defer and risk a stronger rebound to 1.2758 but break of this resistance is needed to signal a temporary low is formed instead, risk test of 1.2818 resistance later.
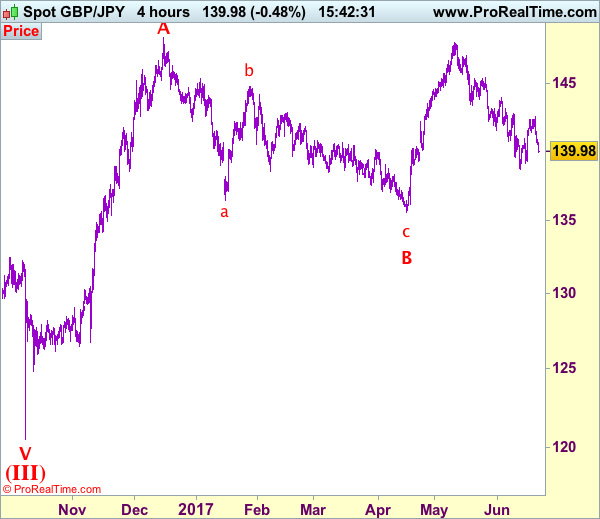
Trade Idea: GBP/JPY – Stand aside G
GBP/JPY - 139.95
Recent wave: Medium term low formed at 120.50 and (A)-(B)-(C) major correction has commenced with (A) leg ended at 148.45, hence wave (B) is unfolding for retreat to 131.00-10.
Trend: Near term down
Original strategy:
Exit long entered at 141.50,
Position: - Long at 141.50
Target: -
Stop: -
New strategy :
Stand aside
Position: -
Target: -
Stop:-
Sterling’s selloff after meeting strong resistance at 142.50 dampened our bullishness and suggests the rebound from 138.70 has ended there and downside risk remains for weakness towards support at 139.15, however, break there is needed to add credence to this view and signal recent decline has resumed for retest of 138.70, then towards 138.00-10 later which is likely to hold from here due to near term oversold condition.
On the upside, whilst recovery to 139.65-70 cannot be ruled out, reckon upside would be limited to 141.15-20 and bring another decline later. Only above 141.80 would revive bullishness and suggest the retreat from 142.50 has ended, bring another test of this level first. Once this resistance is penetrated, this would signal the erratic rise from 138.70 is still in progress or test of indicated previous resistance at 142.75, above there would signal recent decline has ended and encourage for at least a strong retracement of recent selloff to 143.05-10.
Our preferred count is that larger degree wave V with circle is unfolding from 251.12 with wave (I) 219.34, (II): 241.38 and wave (III) is subdivided into 1: 192.60, 2: 215.89 (23 Jul 2008) and wave 3 ended at 118.87 earlier in 2009. The correction from there to 162.60 is wave 4 which itself is a double three and is labeled as first a-b-c ended at 151.53, followed by wave x at 139.03, 2nd a ended at 162.60, 2nd b at 146.75 and 2nd c leg of wave 4 ended at 163.00. Therefore, the decline from 163.00 to 116.85 is now treated as wave 5 which also marked the end of larger degree wave (III), hence wave (IV) major correction has commenced for retracement of the wave (III) from 241.38 and upside target at 183.95-00 (50% Fibonacci retracement of the wave (II) from 241.38) had been met, a drop below 160.00 would suggest wave (IV) has ended at 195.85, bring decline in wave (V) for initial weakness to 130 (already met) and 120.
Oil Remains Close To 7-Month Lows, Dollar Little Changed
As Asian markets are completing their trading day, the dollar index has eased from yesterday's one-month high but is still close to that level. In the meantime, WTI and Brent crude didn't manage to post a rebound after yesterday's sizable losses.
The dollar index, a broader gauge of the greenback's strength, remains close but below yesterday's one-month high of 97.87. The greenback was recently supported by key Fed officials communicating that rate normalization should remain on track. Dollar/yen didn't manage to maintain momentum after yesterday's more than three-week high and finished the day lower. The pair continues declining today and was last down two-tenths of a percent at 111.25. Euro/dollar was flat at 1.1132 and close to yesterday's three-week low. Pound/dollar which posted significant losses following dovish remarks by Bank of England Governor Mark Carney yesterday, which pushed the pair to two-month lows, was last down marginally below the 1.26 handle.
The oil-linked Canadian dollar continues retreating versus its US counterpart. Dollar/loonie yesterday finished the day four-tenths of a percent higher. With the close of Asian markets, the pair is slightly up at 1.3275.
It is noteworthy that the greenback was also partially negatively affected by lower oil prices as those weaken inflationary pressures, translating into lower US Treasury yields. Lower yields render dollar investments less attractive.
Other commodity-currencies and specifically the Australian and New Zealand dollar were also down on the day versus the greenback. Aussie/dollar last traded at 0.7563, after recording a one-week low of 0.7554 earlier in the day. Kiwi/dollar last traded at 0.7227 after commencing the day at 0.7238. The kiwi was hurt by the outcome of yesterday's bi-weekly dairy auction which showed prices declining by 0.8%, contrasting the 0.6% rise from two-weeks ago. New Zealand relies heavily on milk product exports. On a different note, the Reserve Bank of New Zealand is expected to announce that it will maintain its key cash rate at the record low of 1.75% as it completes its meeting tomorrow.
Transitioning from forex markets to commodities, gold was last up two-tenths of a percent, trading around $1245 an ounce after declining for five days in a row and falling to a one-month low in yesterday's trading. WTI and Brent crude were both close to yesterday's seven month lows, below $44 and $46 a barrel respectively. The two benchmarks fell yesterday on reports of increased supply by Libya and Nigeria. The Energy Information Administration's (EIA) weekly report on US crude oil inventories will be released later in the day. The report will attract even more interest than usual given WTI's massive declines recently.
EUR/USD Analysis: Reaches Support Cluster
As it was expected the common European currency continued its decline against the US Dollar in the previous 24 hours. However, on Wednesday morning a short lived climb of the Euro against the Greenback was expected. Due to the fact that the pair found support and rebounded against the combined support of the weekly S1 at 1.1120 and monthly PP at 1.1117 the rate began to surge. It is highly likely that the pair will reach for the upper trend line of the short term descending channel pattern. The trend line is strengthened by the resistance of the 55 and 100-hour SMAs. Although, the exact level, where the trend line could be reached is unclear. Afterwards it can be expected that the surge of the Buck will continue.
GBP/USD Analysis: Attempts To Recover From Tuesday’s Losses
Severe bearish momentum on Tuesday caused the GBP/USD currency pair to pierce the ascending channel's support line, with the support around 1.2624 limiting the losses. Due to the strong demand at this area, the Sterling has the opportunity to erase some of yesterday's losses, despite technical indicators in the shorter timeframes suggesting otherwise. The RSI specifically both in short and medium terms approached its bottom turnaround point, which implies a recovery could be due. Intraday gains should then be capped around 1.2720, where a relatively tough resistance on the hourly chart rests. On the other hand, in case more bearish momentum persists and the monthly S2 fails to hold the pair, the 1.2560 mark is the area to consider as another potential support.
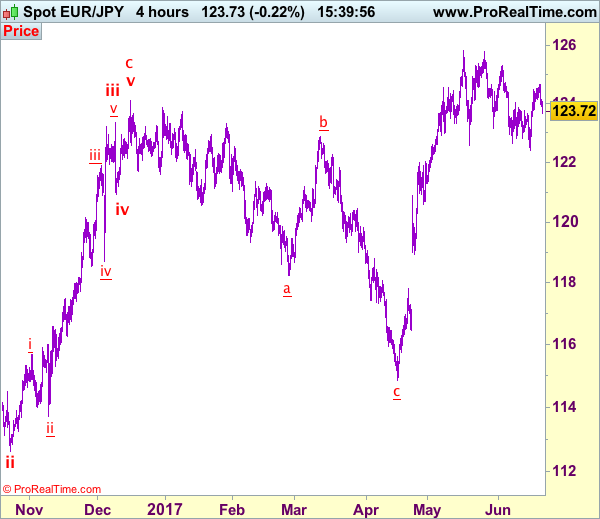
Trade Idea: EUR/JPY – Hold long entered at 123.80
EUR/JPY - 123.72
Recent wave: wave v of (C) ended at 94.12 and major correction in wave A has ended at 149.79
Trend: Near term up
Original strategy:
Bought art 123.80, Target: 125.30, Stop: 123.20
Position: - Long at 123.80
Target: - 125.30
Stop: - 123.20
New strategy :
Hold long entered at 123.80, Target: 125.30, Stop: 123.20
Position: - Long at 123.80
Target: - 125.30
Stop:- 123.20
As the single currency has retreated sharply after meeting resistance at 124.65 yesterday, suggesting consolidation below this level would be seen, however, as long as 123.20-25 holds, prospect of another rise remains, above said resistance at 124.65 would signal recent upmove from 122.40 (last week’s low) is still in progress and may extend further gain to 125.00 but break of resistance at 125.31 is needed to retain upside bias and signal correction from 125.82 has ended at 122.40, bring subsequent rise towards this level which is likely to hold on first testing.
In view of this, we are holding on to our long position entered at 123.80. Below 123.20-25 would defer and suggest first leg of rebound from 122.40 has ended instead, risk further weakness to 122.90-00 but price should stay well above said support at 122.40, bring another rebound later.
Our latest preferred count is that wave (ii) is ABC-X-ABC which ended at 123.33 and wave (iii) is unfolding with wave iii ended at 100.77, followed by wave iv at 111.57 and wave v as well as the wave (iii) has ended at 97.04, followed by wave (iv) at 111.43 and wave (v) has ended at 94.12 which is also the end of the larger degree v, this also implied the major wave (C) has also ended there, hence major correction has commenced from there with (A) leg unfolding in its lower degree wave c which has possibly ended at 145.69. Under this count, A-B-C wave (B) has commenced with A leg ended at 136.23, wave B at 143.79 and wave C has possibly ended at 149.79.
Our larger degree count is that the decline from 139.26 is wave (C) and is sub-divided into a diagonal triangle i-ii-iii-iv-v with wave i - 105.44, wave ii- 123.33, wave iii - 97.03, wave iv - 111.43, followed by the final wave v as well as the end of wave (C) at 94.12, this also mark the bottom of larger degree wave B. Under this count, major rise in wave C has commenced as an impulsive wave with minor wave III ended at 145.69, wave V is still in progress for further gain to 150.00. Having said that, this so-called wave V could well be the first leg of larger degree 5-waver wave C and this wave C should bring at least a retest of wave A top at 169.97 (July 2008).
USD/JPY Analysis: Stuck Between 109.22 And 111.80
The resistance encountered at 111.80, namely the monthly PP, was too tough for the USD/JPY pair to bare, resulting in the breach of the recently-acquired up-trend. Being that the pair kept trading between the monthly S1 and the monthly PP, the exchange rate should now keep falling towards the 109.22 area. Technical indicators somewhat support this possibility. No significant developments are expected this week, meaning that with the given rate of decline the most likely weekly close could be 110.00 major level. Moreover, there are no market movers present on the calendar, with the closest potential one scheduled only for June 26. Meanwhile, traders' sentiment also remains relatively neutral, as 55% of all open positions are long.
Gold Analysis: Reaches 55-Hour SMA
The Tuesday morning forecast fulfilled itself only on Wednesday morning, as the US Dollar attempted to score additional gains during the second half of Tuesday's trading. However, on Wednesday morning the bullion reached the resistance of the 55-hour SMA near the 1,247.50 mark. Day traders were and will be watching this level of significance. The reason for that is that it could force the metal to make another attempt to pass the support at 1,243.59 level. On the other hand, if the resistance of the SMA is broken, the commodity price might surge above the 1,250 mark, as the closest resistance is located at the descending 100-hour SMA just above the mentioned level.
Bank Of England Governor Mark Carney Delivers Speech At Mansion House Dinner
'Before long, we will all begin to find out the extent to which Brexit is a gentle stroll along a smooth path to a land of cake and consumption.' — Mark Carney, Bank of England
The Bank of England Governor Mark Carney delivered a speech on Tuesday at the Mansion House dinner in London. The Governor said that the potential movement of the Euro-clearing centre from London to another EU-based city amid Britain's withdrawal from the European Union would likely lead to higher costs for participants and do little for the region's financial stability. Last week the European Commission proposed to move all Euro-clearing businesses away from London after the UK leaves the EU in 2019. The European Commission said that the following step would likely sustain financial stability in the region. In the meantime, Carney urged the EU to develop together a new form of cross-border supervisory cooperation, highlighting the high importance of free trade in financial services. Apart from that, the Governor stated that policymakers would proceed tolerating the inflation rate above the 2% target 'to see the extent to which weaker consumption growth is offset by other components of demand' and assess both wage and economic growth and, thus, leave interest rates on hold.
Trade Idea: AUD/USD – Hold long entered at 0.7595
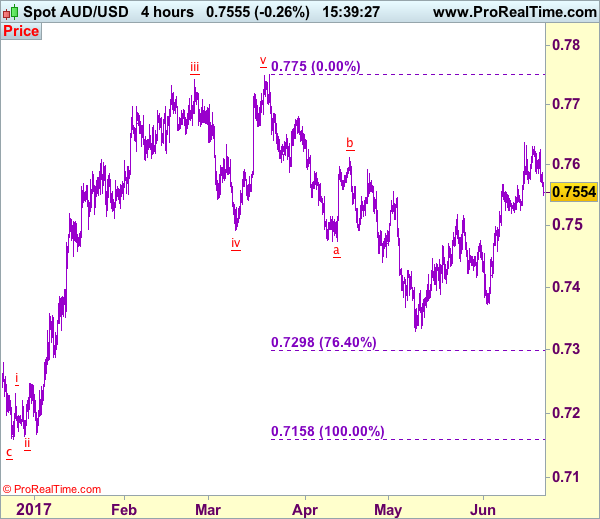
AUD/USD – 0.7554
Recent wave: Wave 5 ended at 1.1081 and major correction has commenced for fall to 0.7000 and then towards 0.6500-10
Trend: Near term up
Original strategy :
Bought at 0.7595, Target: 0.7745, Stop: 0.7535
Position: - Long at 0.7595
Target: - 0.7745
Stop: - 0.7535
New strategy :
Hold long entered at 0.7595, Target: 0.7745, Stop: 0.7535
Position: - Long at 0.7595
Target: - 0.7745
Stop:- 0.7535
Current retreat has dampened our bullishness and 0.7535 needs to hold to retain prospect of another rise, above 0.7600 would bring test of indicated resistance at 0.7636, break there would confirm recent upmove has resumed and extend the rise from 0.7329 towards previous resistance at 0.7680 but loss of momentum should limit upside to chart resistance at 0.7750 and price should falter below 0.7785-90.
In view of this, we are holding on to our long position entered at 0.7595. Below 0.7535 would defer and suggest top is possibly formed, bring correction to 0.7515-20, break there would provide confirmation, then correction to 0.7490-95 and possibly towards support at 0.7457 would be seen later.
On the 4-hour chart, the move from 0.8066 is the wave 5 with i: 0.8860, ii: 0.8315, wave iii is an extended move ended at 1.0183, iv: 0.9706 and wave v has ended at 1.1081 (also the top of entire wave 5). The subsequent selloff is the major correction which is unfolding as ABC-X-ABC and 2nd A leg has ended at 0.8848, followed by a-b-c wave B which ended at 0.9758, hence, 2nd C wave is now in progress and indicated downside target at 0.7000 and 0.6950 had been met, so further fall to 0.6710-20 cannot be ruled out.