Sample Category Title
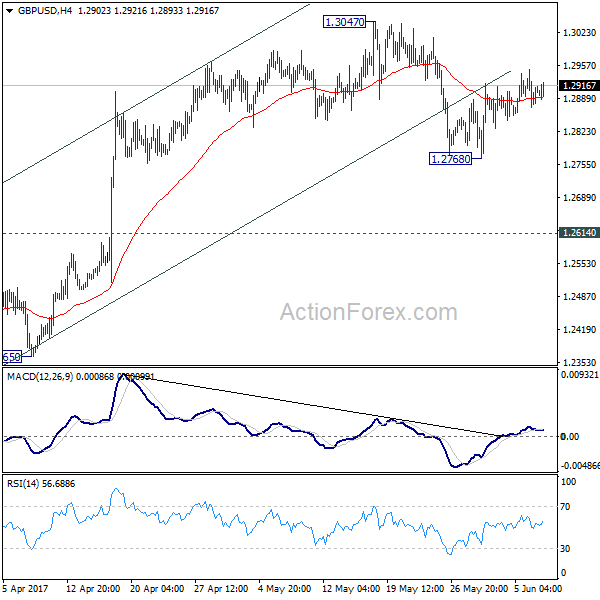
GBP/USD Mid-Day Outlook
Daily Pivots: (S1) 1.2868; (P) 1.2909; (R1) 1.2946; More...
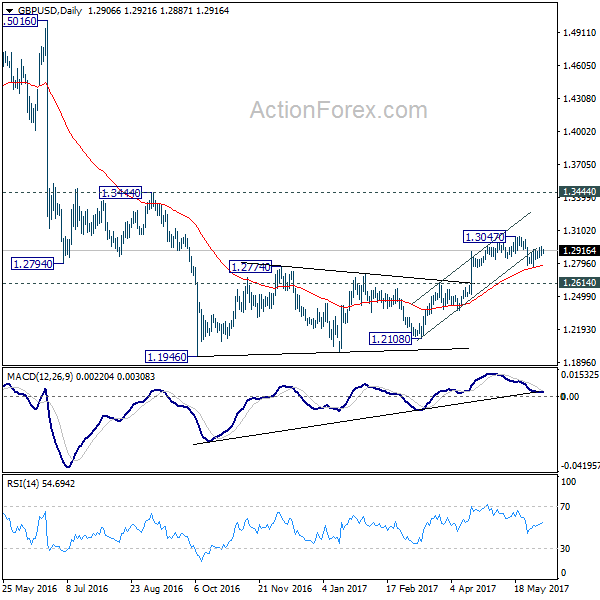
Intraday bias in GBP/USD remains neutral for the moment. On the downside, below 1.2768 minor support will extend the fall from 1.3047 to 1.2614 resistance turned support. Decisive break there should confirm completion of the consolidation pattern from 1.1946 and resume the larger down trend through this low. On the upside, break of 1.3047 will extend the correction with another rise towards 1.3444 key resistance.
In the bigger picture, fall from 1.7190 is seen as part of the down trend from 2.1161. The rejection from 55 week EMA is maintaining bearishness in the pair. Also, at this point, as long as 1.3444 resistance holds, fall from 1.7190 is still expected to continue. Break of above mentioned 1.2614 support will affirm this bearish case.
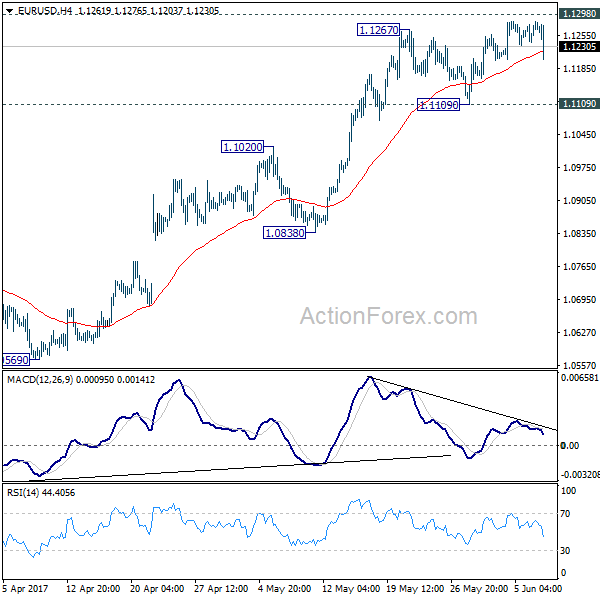
EUR/USD Mid-Day Outlook
Daily Pivots: (S1) 1.1250; (P) 1.1267 (R1) 1.1294; More....
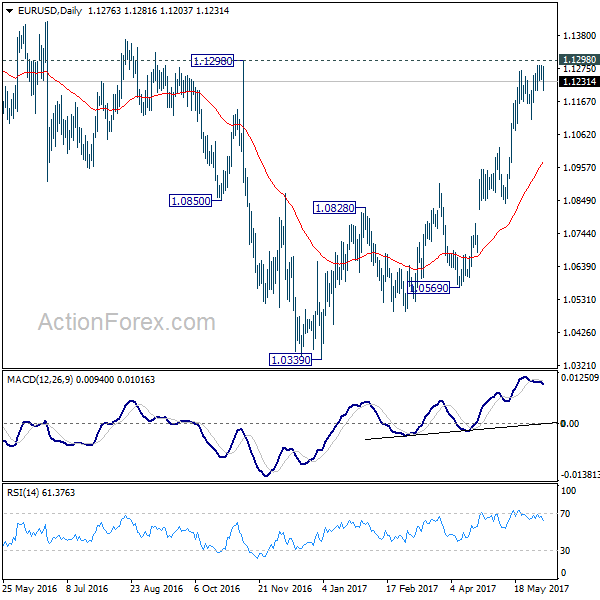
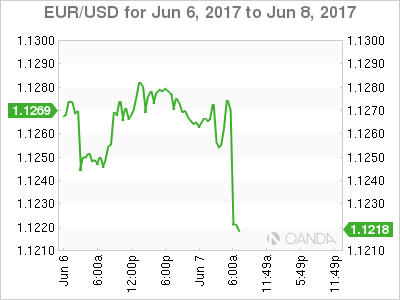
EUR/USD dips further today but it's staying well above 1.1109 support. Intraday bias remains neutral for the moment. With 1.1109 intact, further rally is in favor. Decisive break of 1.1298 will carry larger bullish implication and target 1.1615 resistance next. However, break of 1.1109 will indicate short term topping and rejection from 1.1298. In that case, intraday bias will be turned back to the downside for 1.0838 support first.
In the bigger picture, the case for medium term reversal continues to build up with EUR/USD staying far above 55 week EMA (now at 1.0888). Also, bullish convergence condition is seen in weekly MACD. Focus will now be on 1.1298 key resistance. Rejection from there will maintain medium term bearishness and would extend the whole down trend from 1.6039 (2008 high). However, firm break of 1.1298 will indicate reversal. In such case, further rally would be seen back to 1.2042 support turned resistance next.
Euro Dips as ECB Said to Downgrade Inflation Forecasts Tomorrow
Euro dips broadly today as it's reported that ECB would downgrade inflation forecast in the staff economic projections to be published tomorrow. Bloomberg quoted unnamed source noting that ECB staff forecasts inflation to be at 1.5% in 2017, 2018 and 2019. That's quite notable downward revision from prior forecasts of 1.7%, 1.6% and 1.7% respectively. Weakness in energy price is seen as a major factor for the change. This will add to the case for policymakers to be have more patience regarding any stimulus exit. However, GDP forecast will be another thing that's closely watched for any upward revision. Based on March staff projections, Eurozone economy will grow 1.8% in 2017, 1.7% in 2018 and 1.6% in 2019.
Also, ECB is widely expected to keep key interest rate at 0% and deposit rate at -0.4% tomorrow. The asset purchase program will be left unchanged, at EUR 60b per month. ECB officials have generally expressed the view that it won't raise interest rate before ending the asset purchase in December. It's still generally expected that, due to receding political risks, the central bank will end the asset purchase after that, and there could be an announcement of some sort in September. The main focus tomorrow is indeed on whether ECB would close the door for further stimulus by changing the language.
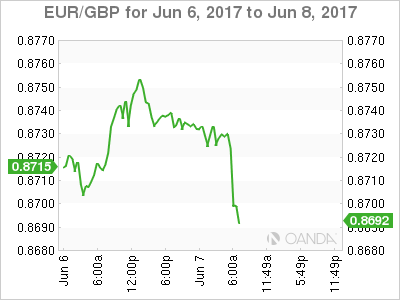
Technically, EUR/USD is staying well above 1.1109 near term support and thus, outlook remains bullish. 1.1298 is a key structure resistance to watch and firm break there will carry larger bullish implications. Meanwhile, EUR/GBP is also staying comfortably above 0.8654 support for the moment and maintains near term bullish outlook.
Sterling mixed as election awaited
Sterling continues to trade mixed as markets await the highly uncertain election tomorrow. The latest Survation poll found that Prime Minister Theresa May's Conservatives at 41.5% and Labour at 40.4%, just 1.1% apart. According to YouGov's model, Conservatives could get just 304 seats in the Commons, down 26 from prior parliament. On the other hand, Labour could get 266 seats, up 37. That is, neither one will get the 323 seats required for absolute majority.
We'll try not to predict the outcome of the election, which now becomes too hard to predict. But we do have anticipation on market reactions depending on the outcome. It should be noted again that Sterling surged sharply when May announced the snap election. Conservatives had over 20 pts lead over Labour back then. And the Pound started to struggle when Labour gained momentum recently. We'd expect to see such pattern continue as the vote counts are being released.
Aussie surges on GDP growth
Australian dollar surges broadly today as GDP grew 0.3% qoq in Q1, meeting market expectations, even though it's sharply slower than prior quarter's 1.1% qoq. But after all, it's the 103rd successive quarter, or 26 years, without recession. And it's now a new world record of a country without a recession. Treasurer Scott Morrison said that "the results demonstrate the continued resilience of the Australian economy:" Some analysts noted that the slowdown in Q1 showed that the economy is "tired". But Morrison blamed the weather for the slowdown in Q1 and argued that improvements would be seen ahead. He noted that RBA Governor Philip Lowe reiterated yesterday that he expects the economy to grow above 3% in the next couple of years.
Elsewhere...
Canadian building permits dropped -0.2% mom in April. Swiss foreign currency reserves dropped slightly to CHF 694b in May. New Zealand manufacturing activity rose 2.8% in Q1. Australia GDP rose 0.3% qoq in Q1. Japan leading index dropped to 104.5 in April. German factory orders dropped -2.% mom in April.
EUR/USD Mid-Day Outlook
Daily Pivots: (S1) 1.1250; (P) 1.1267 (R1) 1.1294; More....
EUR/USD dips further today but it's staying well above 1.1109 support. Intraday bias remains neutral for the moment. With 1.1109 intact, further rally is in favor. Decisive break of 1.1298 will carry larger bullish implication and target 1.1615 resistance next. However, break of 1.1109 will indicate short term topping and rejection from 1.1298. In that case, intraday bias will be turned back to the downside for 1.0838 support first.
In the bigger picture, the case for medium term reversal continues to build up with EUR/USD staying far above 55 week EMA (now at 1.0888). Also, bullish convergence condition is seen in weekly MACD. Focus will now be on 1.1298 key resistance. Rejection from there will maintain medium term bearishness and would extend the whole down trend from 1.6039 (2008 high). However, firm break of 1.1298 will indicate reversal. In such case, further rally would be seen back to 1.2042 support turned resistance next.
Economic Indicators Update
| GMT | Ccy | Events | Actual | Forecast | Previous | Revised |
|---|---|---|---|---|---|---|
| 22:45 | NZD | Manufacturing Activity Q1 | 2.80% | 0.30% | 0.80% | 1.30% |
| 01:30 | AUD | GDP Q/Q Q1 | 0.30% | 0.30% | 1.10% | |
| 05:00 | JPY | Leading Index Apr P | 104.5 | 104.3 | 105.5 | |
| 06:00 | EUR | German Factory Orders M/M Apr | -2.10% | -0.30% | 1.00% | 1.10% |
| 07:00 | CHF | Foreign Currency Reserves May | 694B | 696B | 697B | |
| 07:30 | GBP | Halifax House Prices M/M May | 0.40% | -0.20% | -0.10% | |
| 12:30 | CAD | Building Permits M/M Apr | -0.20% | 2.40% | -5.80% | |
| 14:30 | USD | Crude Oil Inventories | -3.1M | -6.4M |
Elliott Wave Analysis: GBPUSD Trading In Final Stages Of a Correction; A Reversal Can Be Near
GBPUSD also suggests that there can be dollar strength coming as recovery from end of May looks to be slow and choppy; a clear overlapping move that suggests weaker pound, especially once 1.2860 level is broken.
GBPUSD, 1H
Caution Prevails ahead of Key Events
An air of caution lingered across the financial markets on Wednesday as investors rushed to the side lines ahead of a week filled with key political and macroeconomic events. Asian equity markets were mostly mixed this morning amid the subdued trading mood while European stocks opened cautiously higher. Wall Street closed in the red territory on Tuesday and may follow the same pattern this afternoon as anxious investors avoid riskier assets. With Risk-off potentially becoming the name of the game ahead of a trio of major risk events on Thursday, the flight to safety could support safe-haven assets such as Gold and the Japanese Yen.
Will the ECB surprise markets?
The current relief from political risk in Europe and encouraging macro-fundamentals for the European economy has made the Euro a champion amongst its pairs. Sentiment is turning increasingly bullish towards the currency and this can be reflected on the EURUSD which currently trades around a seven-month high at 1.1275 as of writing.
Much attention will be directed towards Thursday's ECB meeting which can be labelled as a major event risk for the Euro. Although it is widely expected that the central bank will leave monetary policy unchanged in June, investors will be paying very close attention to see if there are any hints of the ECB tapering in the future. With confidence steadily rising over the health of the European economy amid the improving fundamentals, it will be interesting to see if the ECB dishes out a hawkish surprise.
Sterling on standby ahead of UK General Election
The Sterling/Dollar was static on Wednesday as investors remained on the fence ahead of Thursday's General Election in the UK. With poll results varying from Labour making minimal gains to a potential "hung parliament" scenario, Thursday's election outcome is uncertain. I feel that this growing uncertainty ahead of the General Election should leave Sterling vulnerable to further losses. While a scenario where Theresa May secures victory in the UK General Election could support the Pound, the upside could still face some headwinds against ongoing Brexit uncertainty. From a technical standpoint, the GBPUSD is currently on standby with prices trading around 1.2900 as of writing. A hung parliament situation could expose Sterling to extreme downside risks with 1.2600 acting as the first checkpoint.
Dollar Index pressured below 97.00
The Greenback has lost some of its charisma this year with the outlook tilted to the downside as political uncertainty in Washington and soft US economic data weighs on the currency. With the Trump rally a theme of the past and expectations fading over US President Donald Trump moving forward with the proposed fiscal spending, Dollar bullish investors have lost the inspiration to support prices. Although the Federal Reserve is widely expected to raise US interest rates in June, the longer-term hiking path remains clouded amid the uncertainty and as such, has contributed to the Dollar's woes.
The main event risk for the Dollar this week will be the testimony of former FBI Director James Comey before the Senate Intelligence Committee on Thursday. If Comey shares any new information on whether President Trump wanted him to stop investigating his connections to Russia, the Greenback may be exposed to further losses.
Attention On UK Election On Final Day Of Campaigning
- FTSE stabilises as election uncertainty weighs on sentiment;
- EUR tumbles on reports of lower inflation forecasts in draft projection;
- EIA inventories eyed as oil remains under pressure.
We're seeing mild gains in the FTSE in what is otherwise a mixed European session this morning. US futures are pointing a little higher ahead of the open, with little direction coming from across the pond.
The UK index has stabilised in the weeks leading up to the election, with the sudden uncertainty around the outcome appearing to be contributing to the moves. We've seen a similar situation in sterling, which after coming off its highs as the polls showed the Conservatives strong majority being possibly wiped out, has since entered a period of relative stability. I don't think this is helped by the polls with some indicating that the Conservatives have lost their majority altogether and others claiming its very much intact.
This should make for some volatile trade on Thursday evening as the exit polls start to come out. Should the exit polls suggest we're headed for a hung parliament then the knee jerk reaction could be fierce in both the pound and the FTSE. Once this passes then the index could benefit from the weakness in the currency, as it has since the Brexit referendum. The question though is how long this will take. The knee jerk reaction in the FTSE didn't last long after the referendum and the reaction to Trump in the US was much shorter again.
With the last day of campaigning underway and there being little on the economic calendar, attention will likely remain on the UK today. The polls suggest that the Conservatives maintain a six or seven point lead which should be enough to secure a majority, but one that is far smaller than was expected when the election was called. This would come as a relief to the Conservatives and avoid the hung parliament scenario that may be worst case scenario for markets.
The euro has come off this morning after reports of a draft ECB staff projection which showed growth forecasts being revised higher and inflation lower through 2019. Should this be the case, it would support the need for monetary policy to remain very accommodative and either delay tapering or at least slow the pace of it. The dovish nature of this has hit the euro sending it back towards 1.12 against the dollar and below 0.87 against the pound. Should this be rejected, I would expect the moves to quickly reverse.
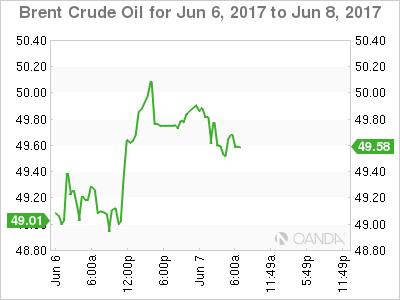
The only notable data to come today is EIA crude oil inventories which follow an API release on Tuesday that reported a drawdown of 4.62 million barrels. With oil already under pressure as traders appear to question the suitability of the output deal and the latest geopolitical issues in the region weigh, it will be interesting to see whether another large drawdown will offer any support. Having broken below $50 though, Brent continues to look vulnerable to further downside.
Dollar Drifts Ahead Of Super Thursday
A move to own haven assets has lost some of its momentum overnight as investors take a time out ahead of an onslaught of key events tomorrow that include a snap election in the U.K, an ECB policy meeting, and testimony by James Comey, the former FBI chief fired by President Trump.
Currently, U.K polls are suggesting that PM Theresa May might not be able to bolster her majority, while Comey's testimony may offer clues to how the probe into the Trump campaign's contact with Russian officials will impact the administration's ability to push through its policy agenda.
The dollar remains adrift atop of its eight-month low while gold edges lower after touching its highest level since November. U.S Treasuries remain flat after climbing yesterday on news that China is prepared to buy more of the debt. Global equities are mixed.
Speculation about a shift in the ECB's policy stance tomorrow is gaining traction. Increasing signs of a strengthening eurozone and more upbeat official comments has raised some investor expectations that a 'no change' could be seen as a small disappointment.
Nonetheless, with last month's regional inflation reports surprisingly soft, any move by ECB policy makers is likely to be only 'subtle' and possibly limited to just a modification of the forward guidance (FG).
The market majority expects ECB interest rates to remain at 'present or lower levels' for an extended period of time.
1. Stocks mixed results
The aforementioned geopolitical worries have many investors wading to the sidelines to seek sanctuary, at least until there is more market clarity.
In Japan, both the Nikkei and broader Topix closed flat in thin trade as investors continued to shun riskier assets ahead of tomorrow's geopolitical events.
Down-under, Australia's S&P/ASX 200 Index also finished flat, after closing yesterday's sessions at its lowest level in four-months.
In Hong Kong, the Shanghai Composite jumped +1.2% to its highest level in four-weeks, while Hang Seng retreated -0.3% from its two-year high print recorded Tuesday.
In Europe, regional indices are trading mixed, with both Italy and France outperforming while the DAX and Swiss SMI and IBEX trade slightly lower. U.K's FTSE 100 is little changed in thin trade ahead of tomorrow's Parliamentary vote.
Indices: Stoxx50 flat at 3555, FTSE +0.2% at 7539, DAX -0.1% at 12681, CAC-40 +0.3% at 5287, IBEX-35 -0.4% at 10838, FTSE MIB +0.5% at 20855, SMI -0.1% at 8899, S&P 500 Futures flat.
2. Oil dips on concerns about rising U.S output, OPEC tensions
Ahead of the U.S open, oil prices have dipped on concerns about the usefulness of OPEC-led production cuts due to rising tensions within the export group over Qatar and growing U.S output.
Currently, Brent crude prices are at +$49.79 per barrel, down -33c. Brent is about -8% below its open on May 25, when OPEC and other producers agreed to extend oil output cuts through to Q1 2018. U.S. light crude (WTI) prices are at +$47.89 per barrel, down -30c.
Yesterday, the EIA said that U.S crude oil production could hit a record +10m bpd next year, up from +9.3m bpd now, putting it nearly on a par with top exporter Saudi Arabia.
Investors will take their cue from today's inventory report from the EIA at 10:30 am. The market is expecting another drawdown (-3.1m vs. -6.4m m/m).
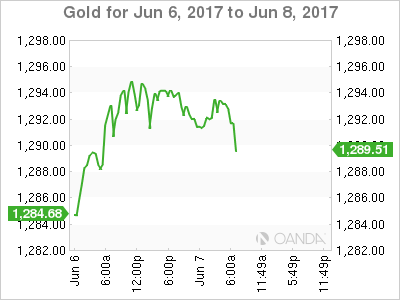
Ahead of the U.S open, gold is holding steady (-0.1% to +$1,292.92), hovering close to its six-week high print in yesterday's session, on weaker global stocks and amid dwindling expectations for aggressive U.S rate hikes this year.
3. U.S Treasury China demand
Yesterday, U.S 10-year yields (+2.147%) closed at its lowest level for 2017, extending its big slide since reaching this year's peak in March (+2.60%).
Aside from the safe haven demand aspect ahead of 'Super Thursday' for product, another boost for debt prices came from 'hearsay' that China is preparing to increase its holdings of U.S product, judging that stateside assets are becoming 'more attractive than other sovereign debt and as the yuan stabilizes.'
Elsewhere, Aussie government notes with a similar maturity rallied +1 bps to +2.38%, while French (OAT's), German (Bunds) and U.K (Gilts) yields were little changed after losing at least -4 bps in yesterday's session.
4. Dollar drifts before D-Day
Overall forex price action remains rather subdued ahead of tomorrows 'Super Thursday' – U.K Parliamentary elections, ECB rate decision and former FBI chief Comey testimony in Congress.
The EUR/USD (€1.1270) trades atop of its seven month high. The single unit has gained strongly since mid-May on market expectations the ECB will announce plans to scale back monetary stimulus tomorrow. This leaves the possibility for 'disappointment,' but the EUR is not expected to ease notably short-term, as the market is assuming deposit rates will start to rise next year.
USD/JPY (¥109.23) is a tad softer – the yen's strength has been driven by risk and safe-haven flows. Lower U.S yields, supported by China's hearsay demand for treasuries, are not supporting the dollar on rate differentials.
The pound's (£1.2920) value is wholly dependent on what happens tomorrow in the U.K election. A strong majority will favor sterling and strengthen PM May's own position ahead of Brexit negotiations.
The pound is expected to plunge to as low as £1.20'ish, a level last seen in January, should the U.K snap election lead to a hung parliament or a Labour win.
Opinium U.K general election poll: Conservatives +43% (unchanged), Labour +36% (-1).
Ashcroft U.K election model: UK conservatives to win total 357 seats in Parliament for a 64-seat majority
Note: compares with 60 projected on June 2.
5. OECD calls for ECB taper and lowers U.S growth
The OECD has reversed its March position on the Eurozone stating this morning that the ECB should taper its bond purchases in 2018, and raise its deposit rate by the end of that year. It was only three-months ago that the research body suggested that Draghi and company should 'continue with what it is doing.'
It has also cut its economic growth forecasts for the U.S for this year and next, stating that the 'stimulative measures it had expected from the Trump administration would now likely be implemented later than it had previously anticipated.' It lowered its projection for 2018 to +2.4% from +2.8%.
'Stronger business and consumer confidence, rising industrial production and recovering employment and trade flows will help global GDP grow +3.6% in 2018, up from +3.0% in 2016.'
Euro Yawns Ahead Of ECB Rate Meeting
The euro continues to have an uneventful week. EUR/USD has inched lower in the Wednesday session, as the pair is currently trading at 1.1270. On the release front, German Factory Orders dropped 2.1%, much weaker than the estimate of a 0.2% decline. It’s a quiet day in the US, highlighted by Crude Oil Inventories. The markets are expecting a decline of 3.1 million barrels, which would mark a ninth consecutive decline. On Thursday, the ECB releases its benchmark rate, which is expected to remain at a flat 0.00%. The US will release unemployment claims, with an estimate of 241 thousand.
If lackluster movement from the euro is a reliable indication, the markets are not expecting any dramatic moves from Mario Draghi & Co. at Thursday’s policy meeting. The central bank has held the benchmark rate at a flat 0.0% since March 2016, and no change is expected on Thursday. Still, with the euro-area economy showing improved growth in 2017, the markets would like to see the ECB at least acknowledge that the economic picture has brightened, and will be looking for a more hawkish tone from the rate statement or the follow-up comments from ECB head Mario Draghi. The ECB has been reluctant to taper its asset-purchase program or raise interest rates, despite grumbling from economic powerhouse Germany, which wants a tighter monetary policy out of Brussels. The markets will be poring over the rate statements and Draghi’s follow-up comments, looking for any nuances which are hawkish in tone. If this occurs, the euro could gain ground.
The Federal Reserve holds its policy meeting next week, and the markets are widely expecting the Fed to raise rates for the second time in 2017. The odds of a rate increase stood at 96%, but the odds have dipped to 91%, in response to the dismal Nonfarm Payrolls report on Friday. An increase in interest rates represents a vote of confidence in the US economy, but the Fed continues to have some concerns. Inflation remains stubbornly low, despite a labor market that remains close to capacity. Fed policy makers are also scratching their heads over soft consumer spending, which has not kept pace with high levels of consumer confidence. As for additional rate hikes in the second half of 2017, the markets remain skeptical, with the odds of a September rate hike at just 22%. However, stronger data in the third quarter will likely raise the likelihood a September hike.
GOLD Riding Within Uptrend Channel, SILVER Testing 61.8% Fibonacci Retracement, CRUDE OIL Strong Volatility.
GOLD Riding within uptrend channel.
Gold is pushing higher within uptrend channel. Hourly support is located at 1246 (18/05/2017 low). Stronger support is given at 1195 (10/03/2017 low). Expected to show further upside pressures.
In the long-term, the technical structure suggests that there is a growing upside momentum. A break of 1392 (17/03/2014) is necessary ton confirm it, A major support can be found at 1045 (05/02/2010 low).
SILVER Testing 61.8% Fibonacci retracement.
Silver declines. Strong support is given at 15.63 (20/12/2017 low). Closest support is given at 16.20 (04/05/2017 low). Key resistance is given at a distance at 19.00 (09/11/2017 high). Expected to push back towards 61.8% Fibonacci retracement around 17.75.
In the long-term, the death cross indicates that further downsides are very likely. Resistance is located at 25.11 (28/08/2013 high). Strong support can be found at 11.75 (20/04/2009).
CRUDE OIL Strong volatility.
Crude oil is now moving sideways after the recent collapse from $52. Support is given at a distance 43.76 (05/05/2017 low). The technical structure suggests decline towards 43.76.
In the long-term, crude oil has recovered after its sharp decline last year. However, we consider that further weakness are very likely. Strong support lies at 24.82 (13/11/2002) while resistance can now be found at 55.24 (03/01/2017 high). 07 June 2017 DAILY
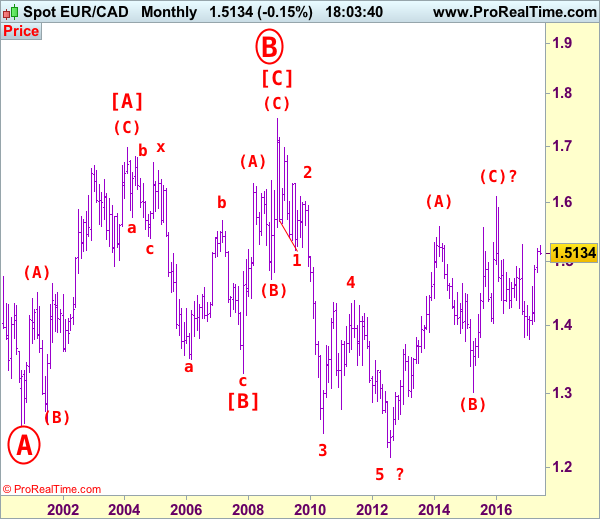
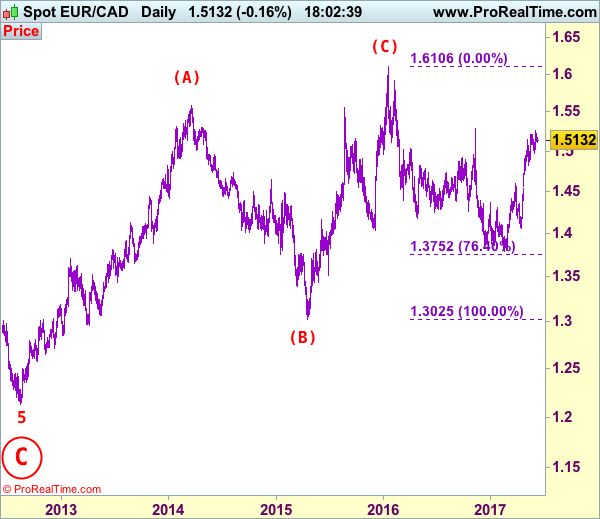
EUR/CAD Elliott Wave Analysis
EUR/CAD – 1.5075
EUR/CAD: Wave 4 ended at 1.4380 and wave 5 as well as circle wave C has possibly ended at 1.2129, major (A)-(B)-(C) correction has commenced and indicated target at 1.6000 had been met.
Although the single currency did find renewed buying interest at 1.4969 and has resumed recent upmove in line with our bullish expectation (our long position entered at 1.5000 met target at 1.5250), lack of follow through buying and current retreat from 1.5259 suggest consolidation below this level would be seen and pullback to 1.5000 cannot be ruled out, however, break of support at 1.4969 is needed to signal top is formed, bring retracement of recent upmove to 1.4900 but support at 1.4825 (previous 4th of a lesser degree) should hold from here.
Our latest preferred count is that larger degree wave [C] from 1.3289 as well as circle wave B ended at 1.7509 in Dec 2008 with (A): 1.6325, (B): 1.4719 followed by wave (C) at 1.7509, hence circle wave C is unfolding with wave 1 ended at 1.5186 (diagonal wave 1), wave 2 at 1.6096, impulsive wave 3 has ended at 1.2451, followed by wave 4 at 1.4380, in view of recent strong rebound, we are now treating the wave 5 as well as larger degree circle wave C has ended at 1.2129, hence (A)-(B)-(C) correction has commenced from there with impulsive wave (C) now unfolding and indicated initial upside target at 1.6000 had been met and reckon 1.6500 would hold.
On the upside, whilst recovery to 1.5160-70 cannot be ruled out, upside should be limited to 1.5200-10 and bring further consolidation below 1.5259. Only a break of this level would revive bullishness and signal recent upmove has resumed for headway to 1.5350 and possibly 1.5400 but price should falter well below 1.5500, risk from there is seen for a retreat later.
Recommendation: Long entered at 1.5000 met target at 1.5250 with 250 points profit.
On the bigger picture, our long-term count on the monthly chart is that a big sideways consolidation from 2000 low of 1.2557 has possibly ended at 1.7509 as circle wave B with [A]: 1.6976 ( (A): 1.4513, (B): 1.2612, (C): 1.6976), wave [B]: 1.3289 is a double three with 1st a-b-c: 1.5384, x: 1.6709 and 2nd a-b-c: 1.3289. As indicated above, the wave [C] has ended at 1.7509. The selloff from there is now unfolding which itself should be labeled as an impulsive wave with wave 1: 1.5186 (diagonal wave 1), followed by wave 2: 1.6096 and wave 3: 1.2451, wave 4: 1.4380, wave 5 as well as larger degree circle wave C has possibly ended at 1.2129 and major correction has possibly commenced for retracement of recent decline towards 1.4000, then 1.4180-90 (38.2% Fibonacci retracement of 1.7509-1.2129). Below said support at 1.2129 would risk weakness to psychological support at 1.2000 and then 1.1851 (50% projection of 1.7509-1.2451 measuring from 1.4380) but reckon 1.1500 would remain intact, bring reversal later.