Sample Category Title
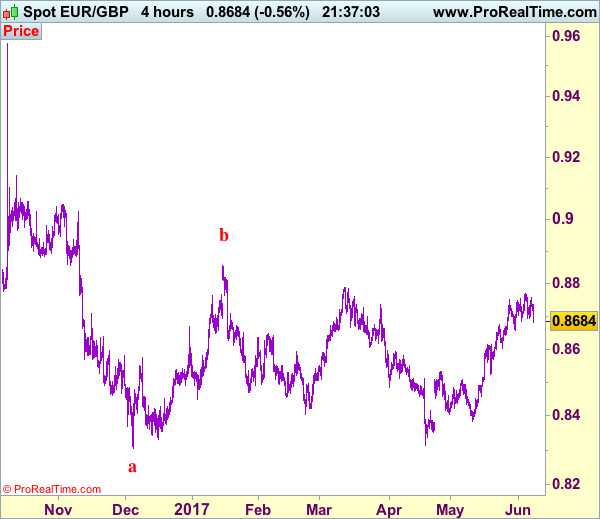
Trade Idea: EUR/GBP – Hold short entered at 0.8735
EUR/GBP - 0.8685
Recent wave: Major double three (A)-(B)-(C)-(X)-(A)-(B)-(C) is unfolding and 2nd (A) has possibly ended at 0.6936.
Trend: Near term up
Original strategy :
Sold at 0.8735, Target: 0.8610, Stop: 0.8775
Position : - Short at 0.8735
Target : - 0.8610
Stop : - 0.8775
New strategy :
Hold short entered at 0.8735, Target: 0.8610, Stop: 0.8760
Position : - Short at 0.8735
Target : - 0.8610
Stop : - 0.8760
As euro has retreated again after meeting resistance at 0.8756, retaining our view that further consolidation below this week’s high at 0.9771 would be seen and mild downside bias remains for another retreat towards indicated support at 0.8655, however, break there is needed to add credence to our view that a temporary top is formed, bring retracement of recent rise to 0.8600-10 later.
In view of this, we are holding on to our short position entered at 0.8735. Only above 0.8771 would extend recent rise from 0.8312 low to previous resistance at 0.8788, however, reckon upside would be limited to 0.8800-10 due to weakening of upward momentum.
Our preferred count is that, after forming a major top at 0.9805 (wave V), (A)-(B)-(C) correction is unfolding with (A) leg ended at 0.8400 (A: 0.8637, B: 0.9491 and 5-waver C ended at 0.8400. Wave (B) has ended at 0.9413 and impulsive wave (C) has either ended at 0.8067 or may extend one more fall to 0.8000 before prospect of another rally. Current breach of indicated resistance at 0.9043 confirms our view that the (C) leg has ended and bring stronger rebound towards 0.9150/54, then towards 0.9240/50.
CAC Gains Ground, ECB Rate Decision Looms
The CAC index has reversed directions in the Wednesday session and posted slight gains. The CAC has risen 0.91% and is currently at 5315.95 points. There are no eurozone or French indicators on the schedule. On Thursday, France releases Trade Balance, with the trade deficit expected to widen to EUR 5.9 billion. On Thursday, ECB policymakers will set the benchmark rate, which is expected to remain at a flat 0.00%.
France will hold two rounds of voting for the 577 seats in the National Assembly, with the first round slated for June 14, with a second vote a week later. French President Emmanuel Macron won the presidential election in convincing style, and his LREM party is on track to win the first round of the legislative election. The latest polls are showing Macron's party with 30 percent of the vote, well ahead of the conservative Republicans, at 22 percent. The polls are forecasting that Macron is well on his way to winning a strong majority in parliament. Macron has a pro-business agenda, and wants to streamline government and improve the country's productivity. A cooperative parliament would enable Macron to implement his pro-business agenda, and the French stock market will likely head higher if Macron does well at the ballot box.
The ECB meets on Thursday to set interest rates, but investors are not expecting any significant moves from the central bank. The French stock market has shown limited movement this week, and the ECB meeting could well be a non-event. The benchmark rate has been pegged at 0.00% since March 2016, and policymakers do not appear in any rush to alter course. At the same time, the eurozone economy has improved in recent months, and the markets would like to see some minor changes in policy, or at least some mention in the rate statement of the improvement in economic conditions. The ECB has been reluctant to taper its asset-purchase program or raise interest rates, despite grumbling from economic powerhouse Germany, which want the ECB to tighten monetary policy. The markets will be poring over the rate statement and Draghi's follow-up comments, looking for any nuances which are hawkish in tone. If this occurs, the CAC could respond positively and move to higher levels.
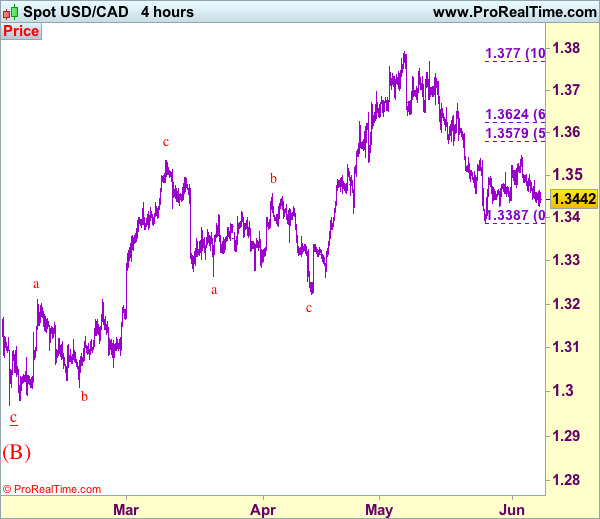
Trade Idea: USD/CAD – Sell at 1.3500
USD/CAD - 1.3443
Recent wave: Only wave v of c has ended at 0.9407 and wave C of major A-B-C correction is underway for headway to 1.4700
Trend: Near term up
Original strategy :
Sell at 1.3580, Target: 1.3380, Stop: 1.3640
Position: -
Target: -
Stop: -
New strategy :
Sell at 1.3500, Target: 1.3330, Stop: 1.3560
Position: -
Target: -
Stop:-
As the greenback has remained under pressure and broke below 1.3435-45 level, suggesting the rebound from 1.3387 has ended at 1.3547 last week and consolidation with downside bias is seen for test of said support at 1.3387 but break there is needed to confirm the fall from 1.3794 top has resumed for further weakness to 1.3350, then towards 1.3300, however, loss of near term downward momentum should prevent sharp fall below 1.3250-60.
In view of this, we are looking to sell on recovery as 1.3490-00 should limit upside. Above said resistance at 1.3547 would abort and prolong consolidation, risk rebound to 1.3571-79 (previous support and 50% Fibonacci retracement of 1.3770-1.3387), however, reckon upside would be limited to 1.3620-25 (61.8% Fibonacci retracement) and bring another decline later.
To recap, wave B from 1.3066 is unfolding as an a-b-c and is sub-divided as a: 1.2192, b: 1.2716 and wave c is a 5-waver with i: 1.1983, ii: 1.2506, extended wave iii with minor iii at 1.0206, wave iv ended at 1.0781 and wave v as well as wave iii has ended at 0.9931, hence the subsequent choppy trading is the wave iv which is unfolding as (a)-(b)-(c) with (a) leg of iv ended at 1.0854, followed by (b) leg at 1.0108 and (c) leg as well as the wave iv ended at 1.0674. The wave v is sub-divided by minor wave (i): 0.9980, (ii): 1.0374, (iii): 0.9446, (iv): 0.9913 and (v) as well as v has possibly ended at 0.9407, therefore, consolidation with upside bias is seen for major correction, indicated target at 1.3700 and 1.4000 had been met and further gain to 1.4700 would be seen later.
Hawkish Expectations Build up for the Euro as ECB Meets this Week
The European Central Bank's next monetary policy meeting is scheduled for June 8th, 2017. The ECB's meeting gains prominence amid a broad-based pickup in the economic recovery in the eurozone. This puts in focus on how the ECB will deliver its assessment this week.
Earlier last week, speculation was rife that the ECB could begin to prepare the markets for a possible tapering to its QE program later this year. Most likely in during the September meeting.
The possibility of a tightening bias saw the euro rally on the news, only to fade later in the day.
The euro currency has been posting steady gains ahead of time. The rally started right after the conclusion of the French presidential elections. As the political risks faded, the euro turned the focus on the possibility of tightening from the European Central bank.
Why is the ECB expected to be hawkish at the June meeting?
The economic activity in the eurozone has been continuing with the pickup seen gaining momentum. In the first quarter, the Eurozone's combined gross domestic product (GDP) rose 0.5% on a quarter over quarter basis. Annualized, the GDP rose 1.7% compared to the same quarter a year before.

Figure 1: EA19 and EU28 GDP QoQ and YoY (Source: Eurostat)
Inflation, which was one stubbornly low also managed to rise 1.9% on the headline in April, while core inflation rose 1.2% during the period. The gains in April came following a 1.5% increase in March. Of course, most of the gains came from higher energy prices which rose 7.6% on the month, advancing from 7.4% the month before.
The services sector also added to the increase, accelerating 1.8% on the month, up from 1.0% from the previous month.
The increase in inflation and GDP obviously prompted lawmakers from Germany and Netherlands to put pressure on the ECB to tighten monetary policy.
As a result, the speculation of tightening sent the euro higher.
While data remains positive, there is no denying the fact that there is no strong evidence that inflationary pressures are here to stay.
Why could the ECB disappoint the markets this week?
Last week's flash inflation estimates from Eurostat, however, showed that inflation eased back in May. According to the flash estimates, official data showed that headline consumer price index fell in May, compared to April.
Headline consumer prices rose 1.4% on an annualized basis, down from April's 1.9% increase. Core consumer prices which strip the volatile food and energy prices also slipped, rising just 0.9%, down from 1.2% increase registered in April.
As expected, energy prices eased, rising 4.6% compared to the 7.6% increase registered in April. While food prices rose 1.5%, rising at the same pace as the month before, services also eased, rising 1.3% compared to 1.8%.
Draghi: Still too early to tell if inflation is self-sustained
Last week, despite the hawkish speculation, ECB President Mario Draghi was testifying to the European Parliament in Brussels. He told lawmakers there that it was too early to tell whether inflation was in a "self-sustained upward adjustment."
Draghi's comments suggest that there is a possibility for the ECB to do nothing. Given the divergence with the expectations, this sets the possibility of a disappointment in the markets.
But remove the inflation aspect from the puzzle, and the other economic indicators point to sustained growth. This will likely see the ECB to remove some of its dovish assumptions when it meets this week.
But, it is going to be a balancing act as far as the ECB is concerned.
So, what will the ECB do at the June meeting?
Most likely, the ECB will give a positive assessment of the economy as far as growth is concerned. This could be sensed as the central bank being hawkish. As for the market expectations on QE tapering, Draghi is likely to remain cautious on inflation.
After all, it is much better for the central bank chief to bear the ire of lawmakers in the eurozone than to make a policy mistake and risk the ECB's credibility.
Any concrete forward guidance on policy tightening will have to wait for now.
In conclusion, the risks to the euro remain to the downside for the moment. It will all come down to how the markets will interpret the ECB's meeting next week.
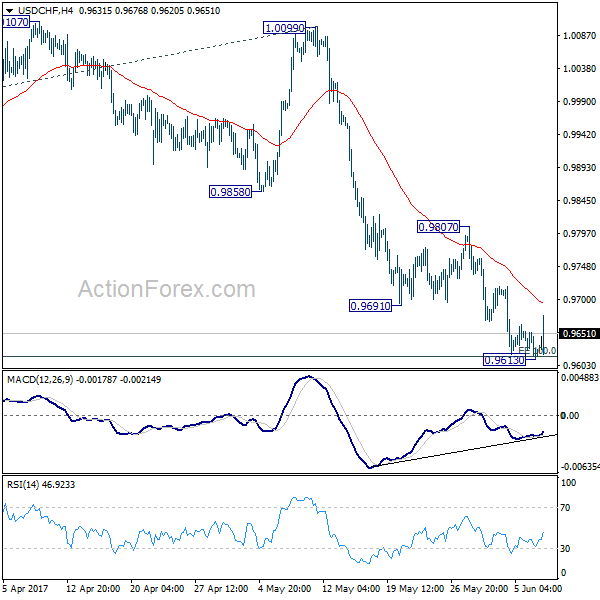
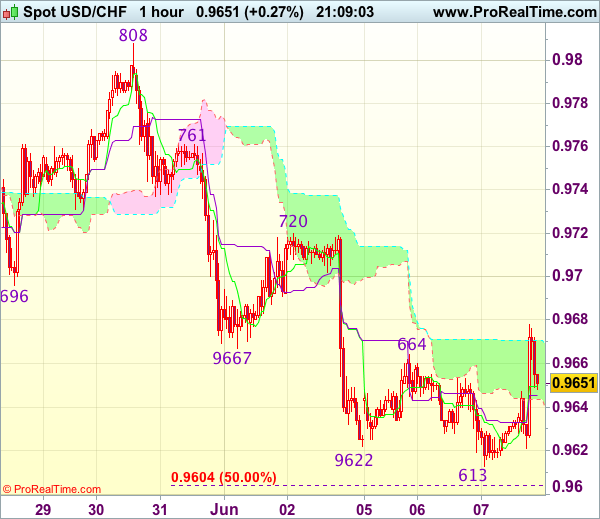
Trade Idea Update: USD/CHF – Sell at 0.9720
USD/CHF - 0.9659
Original strategy :
Sell at 0.9700, Target: 0.9600, Stop: 0.9735
Position : -
Target : -
Stop : -
New strategy :
Sell at 0.9720, Target: 0.9620, Stop: 0.9755
Position : -
Target : -
Stop : -
As the greenback has rebounded after marginal fall to 0.9613, suggesting consolidation above this level would be seen and corrective bounce to 0.9680-85 is likely, however, reckon upside would be limited to resistance at 0.9720 and bring another decline later to 0.9600-05 (50% projection of 1.0100-0.9692 measuring from 0.9808) but oversold condition should limit downside to 0.9570 and price should stay above support at 0.9550, risk from there has increased for a rebound to take place later.
In view of this, we are looking to sell dollar on recovery as resistance at 0.9720 should limit upside. Above 0.9740 would abort and signal a temporary low is formed instead, bring a stronger rebound to 0.9761 resistance but price should falter below resistance at 0.9808.
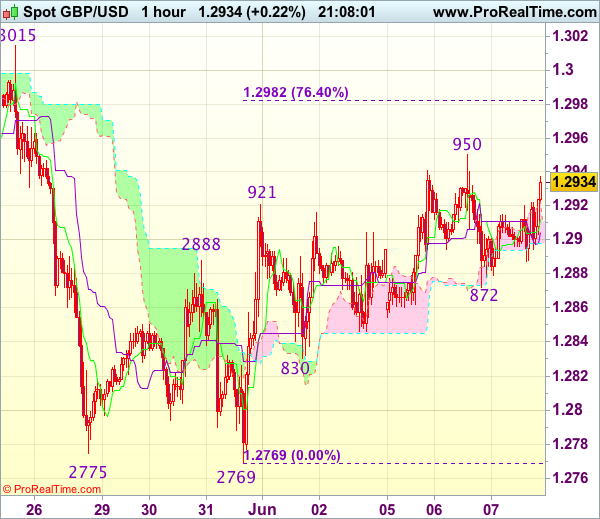
Trade Idea Update: GBP/USD – Stand aside
GBP/USD - 1.2925
New strategy :
Stand aside
Position : -
Target : -
Stop : -
Sterling’s retreat after yesterday’s brief rise to 1.2950 has retained our view that further consolidation below this level would be seen and pullback to 1.2865-70 cannot be ruled out, however, break of indicated support at 1.2830 is needed to confirm top has been formed and suggest the rebound from 1.2769 has ended, bring further fall to 1.2800.
On the upside, expect recovery to be limited to said resistance at 1.2950 and bring another retreat later. Only break above there would extend the erratic rise from 1.2769 to 1.2970, however, as broad outlook remains consolidative, reckon upside would be limited to 1.3000 and indicated previous resistance at 1.3015 should remain intact. As near term outlook is still mixed, would be prudent to stand aside for now.
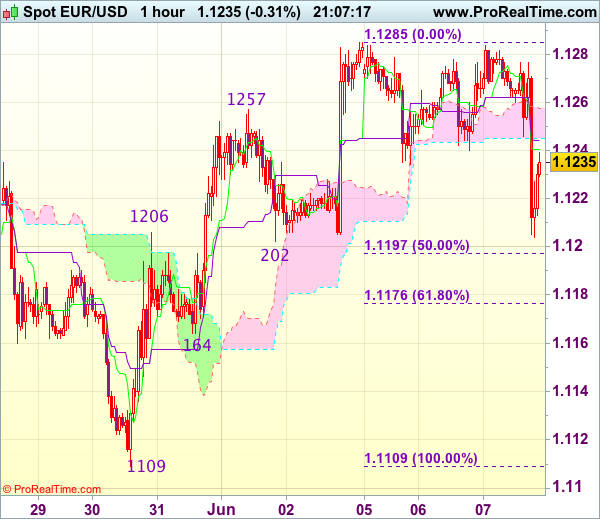
Trade Idea Update: EUR/USD – Stopped profit and stand aside
EUR/USD - 1.1227
Original strategy :
Bought at 1.1205, stopped profit at 1.1235
Position : - Long at 1.1205
Target : -
Stop : - 1.1235
New strategy :
Stand aside
Position : -
Target : -
Stop : -
As the single currency has slipped after meeting resistance again just below last week’s high at 1.1285, suggesting further consolidation below this level would be seen, however, break of 1.1195-00 (50% Fibonacci retracement of 1.1109-1.1285) is needed to signal top has been formed at 1.1285, bring retracement of recent rise to indicated support at 1.1164 first.
On the upside, only break of said resistance at 1.1285 would revive bullishness and extend recent rise to previous chart resistance at 1.1300, break there would encourage for headway to 1.1340-45 but overbought condition should limit upside to chart point at 1.1366. As near term outlook is mixed, would be prudent to stand aside for now.
Trade Idea Update: USD/JPY – Sell at 110.20
USD/JPY - 109.43
Original strategy :
Sell at 109.90, Target: 108.90, Stop: 110.25
Position : -
Target : -
Stop : -
New strategy :
Sell at 110.20, Target: 109.20, Stop: 110.55
Position : -
Target : -
Stop : -
As the greenback has fallen again after brief recovery, suggesting recent decline from 114.37 is still in progress and bearishness remains for further weakness to 109.00-05 (1.236 times projection of 111.71-110.31 measuring from 110.73), then towards 108.70-75 but near term oversold condition should limit downside to 108.45-50 (1.618 times projection), bring rebound later.
In view of this, would not chase this fall here and would be prudent to sell dollar on recovery as previous support at 110.24 (now resistance) should limit upside and bring another decline. Above previous support at 110.31 would defer and suggest low is formed instead, bring a stronger rebound to 110.60 but break of resistance at 110.73 is needed to add credence to this view.
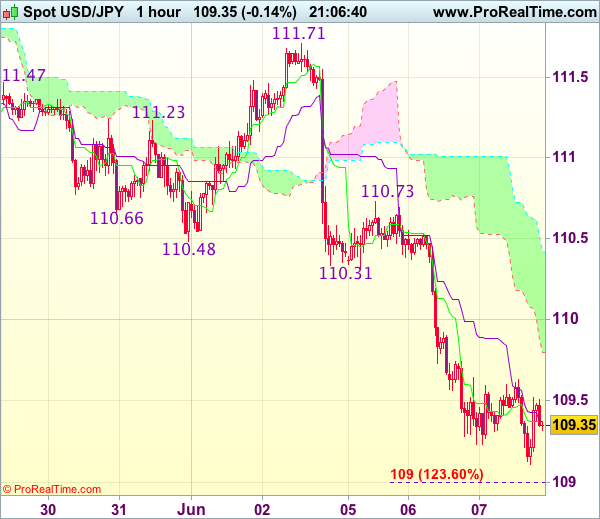
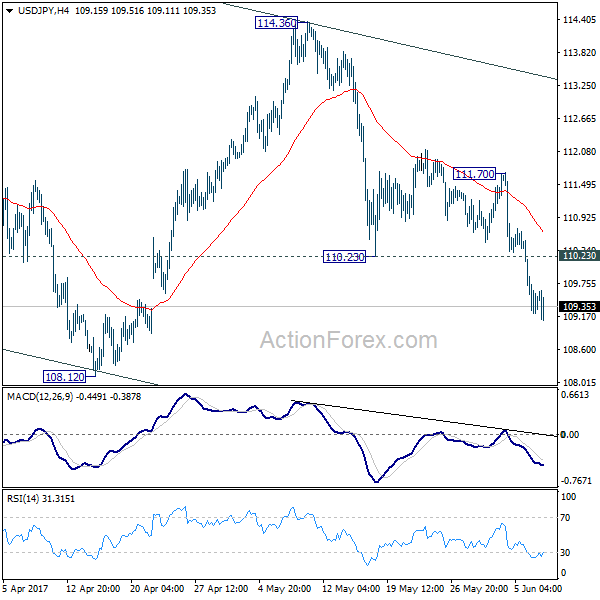
USD/JPY Mid-Day Outlook
Daily Pivots: (S1) 108.91; (P) 109.71; (R1) 110.20; More...
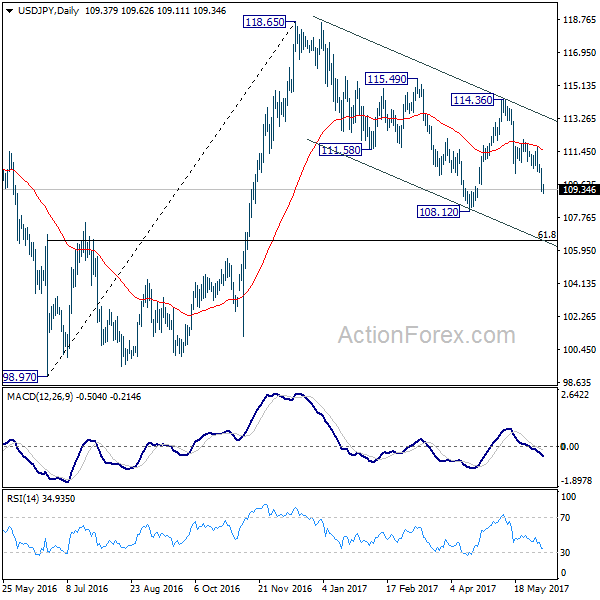
Intraday bias in USD/JPY remains on the downside for retesting 108.12 low first. Also whole decline from 118.65 is seen as a correction and is still in progress. Break of 108.12 will target 61.8% retracement of 98.97 to 118.65 at 106.48. We'll look for bottoming signal around 106.48. On the upside, above 110.23 support turned resistance will turn bias neutral first. But near term outlook will remain bearish as long as 111.70 resistance holds.
In the bigger picture, price actions from 125.85 high are seen as a corrective pattern. It's uncertain whether it's completed yet. But in case of another fall, downside should be contained by 61.8% retracement of 75.56 to 125.85 at 94.77 to bring rebound. Overall, rise from 75.56 is still expected to resume later after the correction from 125.85 completes.
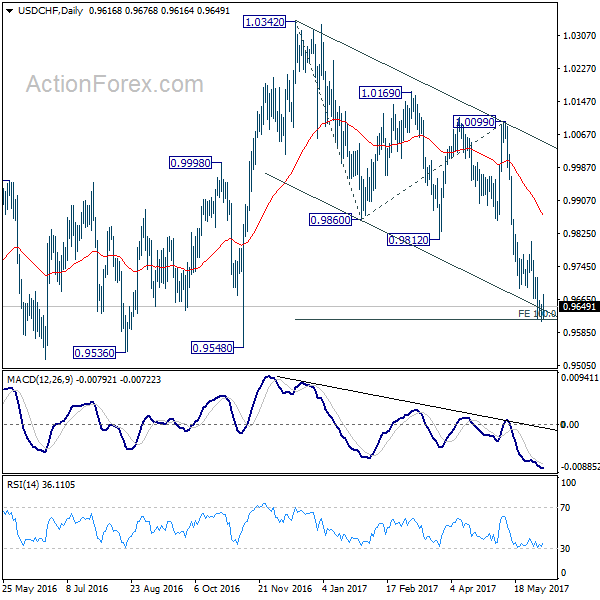
USD/CHF Mid-Day Outlook
Daily Pivots: (S1) 0.9603; (P) 0.9628; (R1) 0.9643; More.....
Intraday bias in USD/CHF stays neutral first and some more consolidation would be seen. Another decline will be mildly in favor as long s 0.9807 resistance holds. But in case of deeper fall, we'd start to look for bottoming signal again as it approaches 0.9443 key support level. However, considering bullish convergence condition in 4 hour MACD, break of 0.9807 will indicate near term reversal and turn outlook bullish.
In the bigger picture, USD/CHF is still bounded in medium term range of 0.9443/1.0342 for the moment. Consolidative trading would likely continue and medium term outlook remains neutral. Break of 1.0342 key resistance is needed to confirm underlying bullish momentum in the pair. Meanwhile, downside attempts should be contained by 0.9443 key support level. However, sustained break of 0.9443 will carry larger bearish implication and target 0.9 handle.