

Sample Category Title
Loonie Trading Marginally Lower In The Asian Session
For the 24 hours to 23:00 GMT, the USD rose 0.45% against the CAD and closed at 1.3509.
On the macro front, Canada’s building permits unexpectedly eased 0.2% MoM in April, compared to a revised drop of 4.9% in the prior month. Markets were anticipating building permits to rebound by 3.0%.
In the Asian session, at GMT0300, the pair is trading at 1.3511, with the USD trading slightly higher against the CAD from yesterday’s close.
The pair is expected to find support at 1.3450, and a fall through could take it to the next support level of 1.3389. The pair is expected to find its first resistance at 1.3549, and a rise through could take it to the next resistance level of 1.3587.
Ahead in the day, investors would eye a speech by the Bank of Canada’s (BoC) Governor, Stephen Poloz, along with Canada’s housing starts data for May.
The currency pair is trading above its 20 Hr and 50 Hr moving averages.

Daily Technical Analysis: Forex, CFD Markets Await UK General Election
Currency pair GBP/USD
The UK will hold general parliamentary elections today Thursday 8th of June 2017. The polls and results could impact price action for the rest of this and next week.
The GBP/USD, not surprisingly, remains in a large consolidation zone (purple box) and channel (green/red lines). The breakout direction could depend on the above mentioned election results.
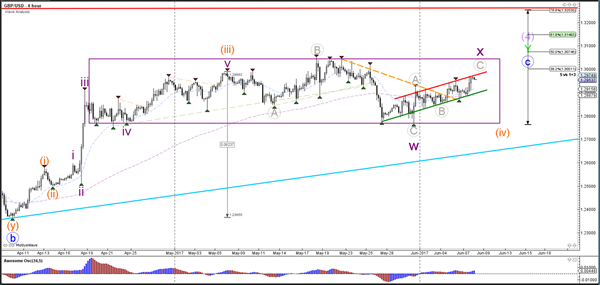
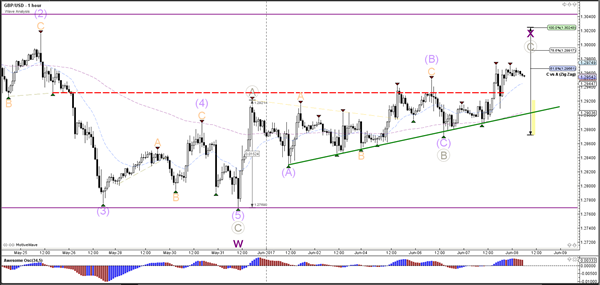
The GBP/USD broke above resistance but seems to be moving into resistance such as trend lines and Fibonacci levels.
Currency pair EUR/USD
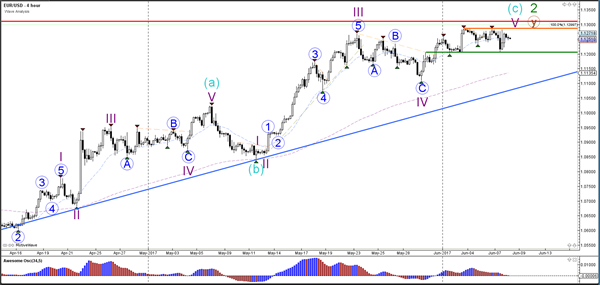
The EUR/USD remains trapped between the 100% Fib resistance level at 1.13 and the support zone at 1.12. A breakout is needed before a trend continuation becomes more likely.
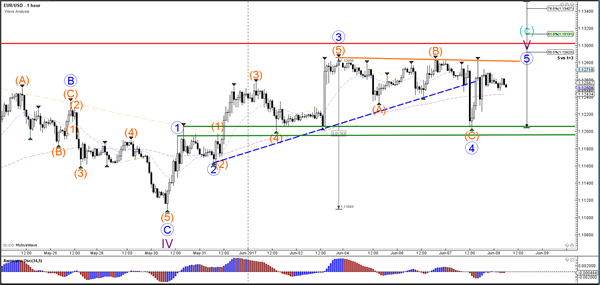
The EUR/USD broke the bullish channel (dotted blue) but price bounced at the support levels (green). The ABC correction (orange) could still be part of a wave 4 (blue) but a break below support (green) invalidates it.
Currency pair USD/JPY
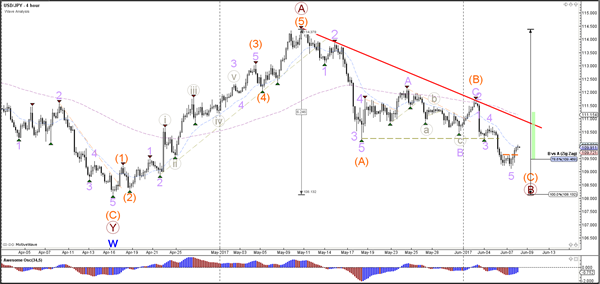
The USD/JPY has bounced at the 78.6% Fibonacci level of wave B (brown) but it remains to be seen on lower time frames if this is a reversal upwards or a correction for more bearish price action.
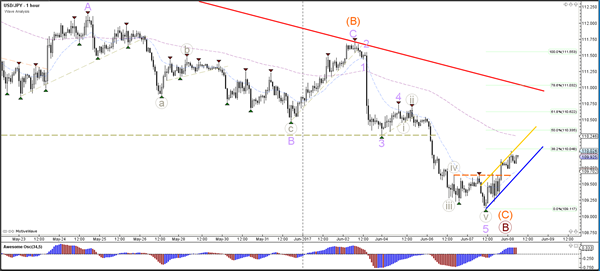
The USD/JPY has reached the 38.2% Fibonacci level. A bullish break above the 50% Fibonacci level indicates that the wave B (brown) has most likely been completed at the low.
EUR/USD Daily Outlook
Daily Pivots: (S1) 1.1212; (P) 1.1247 (R1) 1.1291; More....
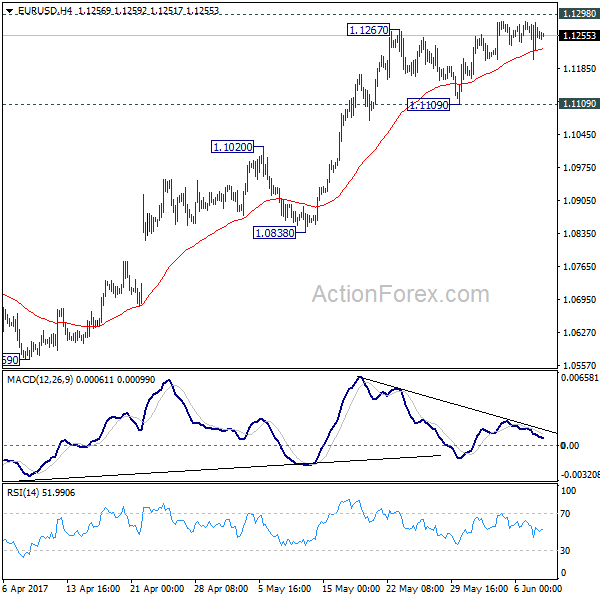
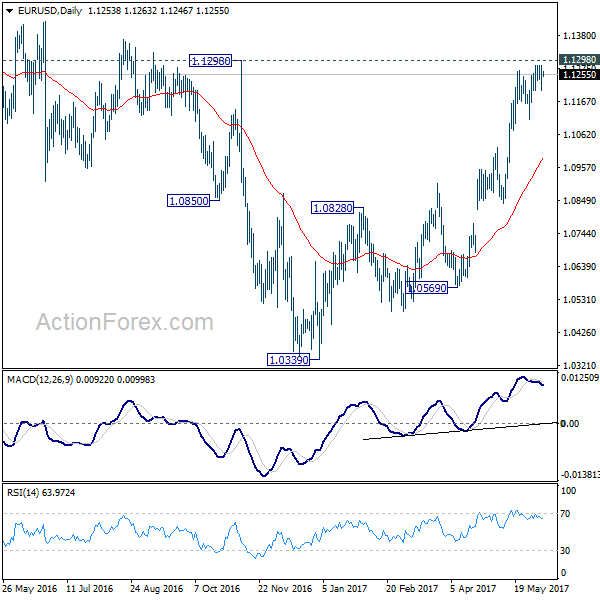
Intraday bias in EUR/USD remains neutral with focus on 1.1298 key resistance level. Decisive break of 1.1298 will carry larger bullish implication and target 1.1615 resistance next. However, break of 1.1109 will indicate short term topping and rejection from 1.1298. In that case, intraday bias will be turned back to the downside for 1.0838 support first.
In the bigger picture, the case for medium term reversal continues to build up with EUR/USD staying far above 55 week EMA (now at 1.0888). Also, bullish convergence condition is seen in weekly MACD. Focus will now be on 1.1298 key resistance. Rejection from there will maintain medium term bearishness and would extend the whole down trend from 1.6039 (2008 high). However, firm break of 1.1298 will indicate reversal. In such case, further rally would be seen back to 1.2042 support turned resistance next.
GBP/USD Daily Outlook
Daily Pivots: (S1) 1.2908; (P) 1.2937; (R1) 1.2988; More...
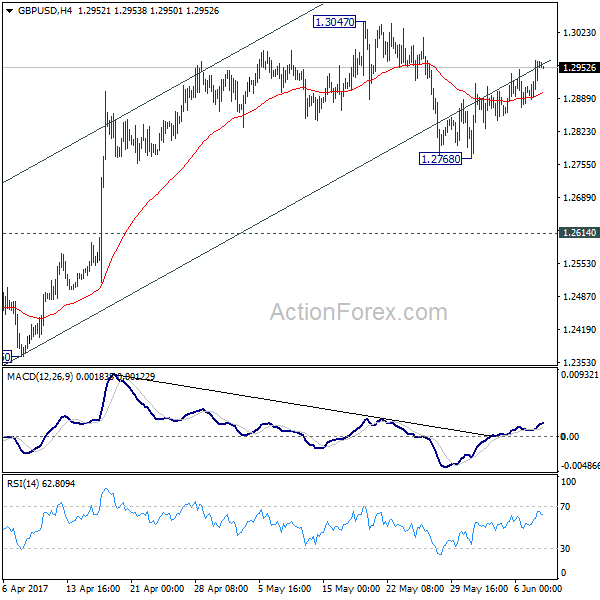
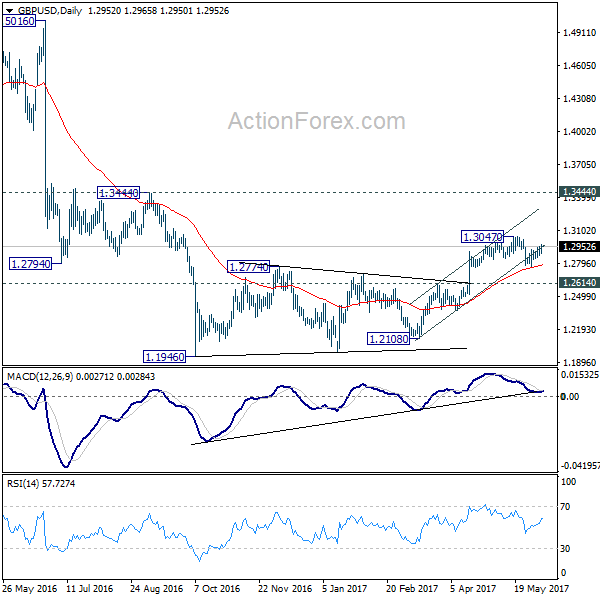
Intraday bias in GBP/USD remains neutral for the moment. On the downside, below 1.2768 minor support will extend the fall from 1.3047 to 1.2614 resistance turned support. Decisive break there should confirm completion of the consolidation pattern from 1.1946 and resume the larger down trend through this low. On the upside, break of 1.3047 will extend the correction with another rise towards 1.3444 key resistance.
In the bigger picture, fall from 1.7190 is seen as part of the down trend from 2.1161. The rejection from 55 week EMA is maintaining bearishness in the pair. Also, at this point, as long as 1.3444 resistance holds, fall from 1.7190 is still expected to continue. Break of above mentioned 1.2614 support will affirm this bearish case.
USD/JPY Daily Outlook
Daily Pivots: (S1) 108.91; (P) 109.71; (R1) 110.20; More...
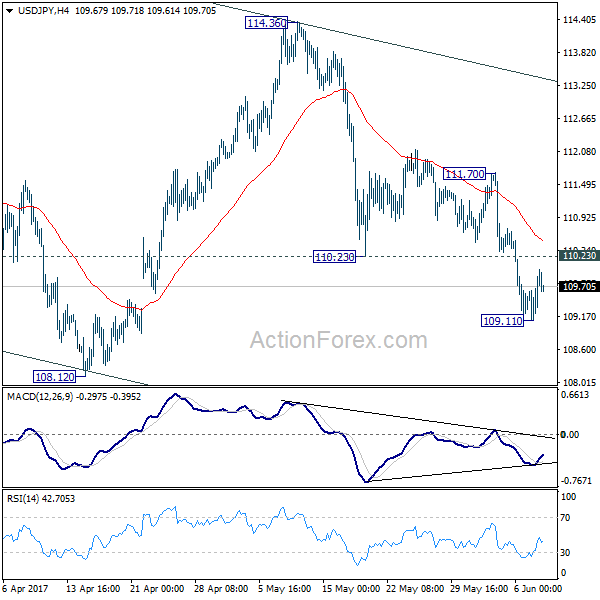
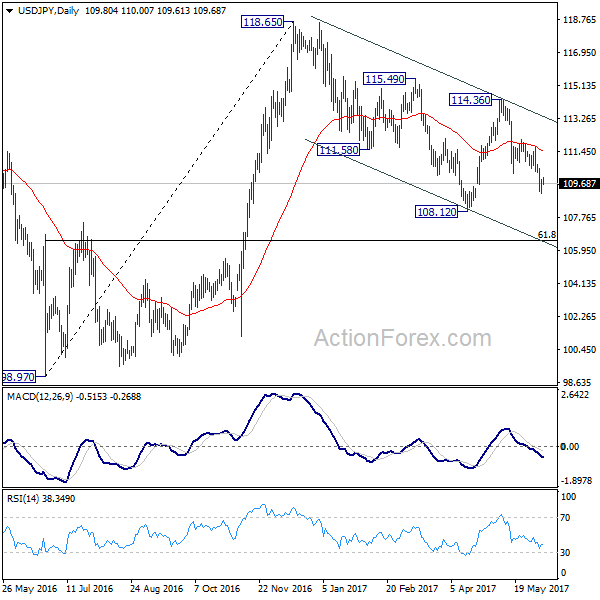
Intraday bias in USD/JPY is turned neutral with a temporary low formed at 109.11. Some consolidation would be seen. But another fall is expected as long as 111.70 resistance holds. Below 109.11 will target 108.12 low first. Break will extend whole decline from 118.65 to 61.8% retracement of 98.97 to 118.65 at 106.48. As such decline is seen as a correction, we'll looking for bottoming signal around 106.48. Meanwhile, break of 110.70 will suggest near term reversal and turn bias back to the upside for 114.36 resistance instead.
In the bigger picture, price actions from 125.85 high are seen as a corrective pattern. It's uncertain whether it's completed yet. But in case of another fall, downside should be contained by 61.8% retracement of 75.56 to 125.85 at 94.77 to bring rebound. Overall, rise from 75.56 is still expected to resume later after the correction from 125.85 completes.
USD/CHF Daily Outlook
Daily Pivots: (S1) 0.9615; (P) 0.9646; (R1) 0.9676; More.....
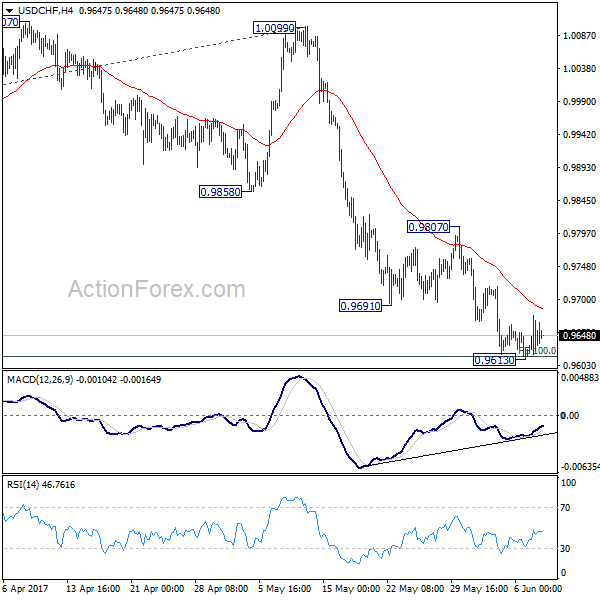
USD/CHF is staying in tight range above 0.9613 temporary low for the moment and intraday bias stays neutral first. Deeper decline is still expected as long as 0.9807 resistance holds. But in case of deeper fall, we'd start to look for bottoming signal again as it approaches 0.9443 key support level. However, considering bullish convergence condition in 4 hour MACD, break of 0.9807 will indicate near term reversal and turn outlook bullish for 1.0099 resistance next.
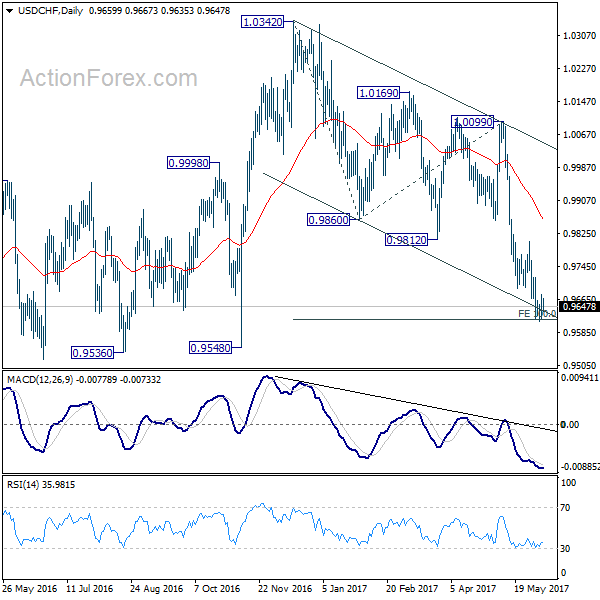
In the bigger picture, USD/CHF is still bounded in medium term range of 0.9443/1.0342 for the moment. Consolidative trading would likely continue and medium term outlook remains neutral. Break of 1.0342 key resistance is needed to confirm underlying bullish momentum in the pair. Meanwhile, downside attempts should be contained by 0.9443 key support level. However, sustained break of 0.9443 will carry larger bearish implication and target 0.9 handle.
Sterling Steady as Final Polls Suggest Conservative Win, Euro Awaits ECB
Sterling is steadily in range as the latest poll on the eve of today's election showed that the Conservative could get an increased majority. According to ICM, Conservatives got a 12 point lead over Labour, 46 to 34. ComRes suggested a 10 point lead with Conservatives at 44, Labour at 34. YouGov said Conservatives got 42 and Labour got 35, 7 point lead. Meanwhile, Survation results showed Conservative at 41.3, Labour at 40.4, a mere 0.9 point lead. YouGov Director Anthony Wells said that "the seven-point Conservative lead is the same as at the previous election, but we think it is likely they will nevertheless be returned with an increased majority." But there is one key factor that analysts pointed out. The turnout of young voters is uncertain and they typically support Labour.
| Conservatives | Labour | Con. Lead | |
| ICM | 46 | 34 | 12 |
| ComRes | 44 | 34 | 10 |
| YouGov | 42 | 35 | 7 |
| Survation | 41.3 | 40.4 | 0.9 |
* Poll released on June 7
Technically, EUR/GBP, currently at 0.8680, is close to top of medium term range of 0.8303/8851. 0.8654 is an important near term suppot for the cross and a firm break there will indicate near term reversal. GBP/JPY is close to a near term fibonacci level at 140.35. Break there would pave the way to test on 135.58 support. But a break of 143.93 resistance will indciate near term reversal and target 148.09. GBP/USD's recovery from 1.2768 is corrective looking so far and lacks decisive momentum. Key levels to watch are 1.3047 and 1.2768.
Euro holds breath ahead of ECB
Euro spiked lower overnight on talk that ECB would lower inflation forecasts in new staff economic projections to be released today. But the common currency quickly recovered. Bloomberg quoted unnamed source noting that ECB staff forecasts inflation to be at 1.5% in 2017, 2018 and 2019. That's quite notable downward revision from prior forecasts of 1.7%, 1.6% and 1.7% respectively. Weakness in energy price is seen as a major factor for the change. This will add to the case for policymakers to be have more patience regarding any stimulus exit.
ECB is widely expected to keep key interest rate at 0% and deposit rate at -0.4% today. The asset purchase program will be left unchanged, at EUR 60b per month. ECB officials have generally expressed the view that it won't raise interest rate before ending the asset purchase in December. It's still generally expected that, due to receding political risks, the central bank will end the asset purchase after that, and there could be an announcement of some sort in September. The main focus is indeed on whether ECB would close the door for further stimulus by changing the language.
Markets shrugs Comey's statement
US equities and treasury yields closed mildly higher yesterday, as markets seem to have taken ex-FBI Director James Comey's written testimony well. Comey will appear in a hearing before Senate Intelligence Committee regarding US President Donald Trump's intervention in FBI investigation. In Comey's statement, he noted that Trump asked him to back off from a probe into former national secrutiy advisor Michael Flynn. And Trump told Comey, "I need loyalty. I expect loyalty". But it seems that the markets were expecting much worse from Comey and some noted that it's not that "smoking gun" that some predicted.
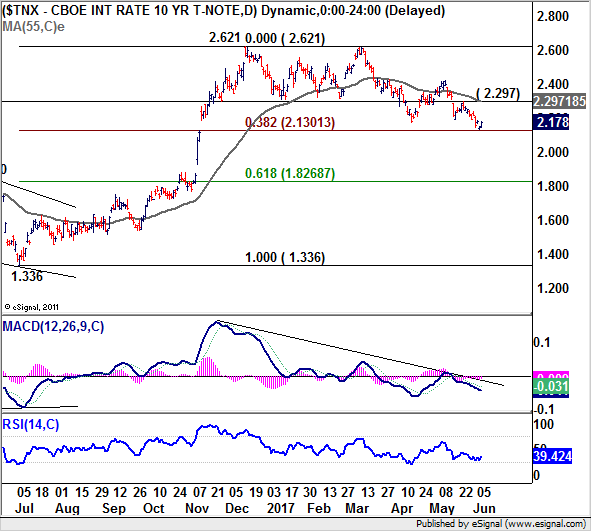
10 year yield is trying to get support from 38.2% retracement of 1.336 to 2.621 at 2.130 for the moment. It remains to be seen if TNX will rebound from here and the key structure resistance is at 2.297. But a rebound from 2.130 would likely help lift up the greenback. And given then EUR/USD is close to 1.1298, a rebound in Dollar that sends EUR/USD through 1.1109 would trigger position squaring and accelerate the move.
Loonie lower as oil plunges
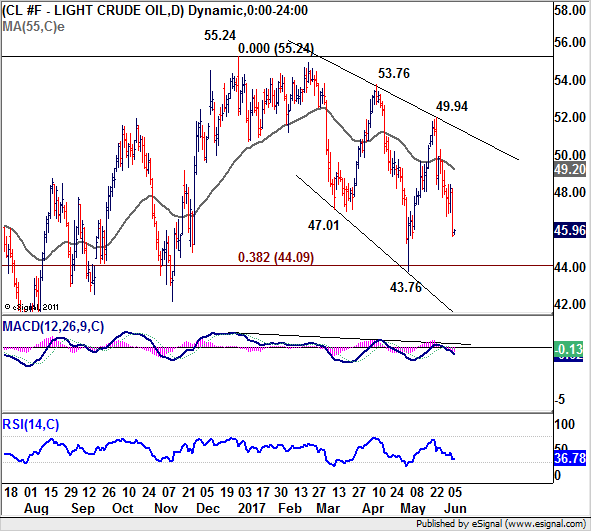
Canadian Dollar weakened following another sharp decline in oil price. WTI dived to as low as 45.65 after data showed unexpected surge in US stockpiles by 3.3m barrels in the week ended June 2. WTI is now set to have a test on 38.2% retracement of 26.05 to 55.24 at 44.09. Meawnwhile, near term outlook in USD/CAD will stay bearish as long as 1.3570 minor resitsance holds.
On the data front
Japan Q1 GDP growth was finalized at 0.3% qoq, below expectation of 0.6% qoq. GDP deflator dropped -0.8% yoy. Japan current account surplus widened to JPY 1.81T in April. China trade surplus widened to USD 40.8b, CNY 282b in May. AUstralia trade surplus narrowed sharply to AUD 0.56b in April. UK RICS house price balance dropped to 17 in May.
Looking ahead, Swiss will release unemployment rate and CPI in Europea session. Germany will release industrial production while Eurozone will release Q1 GDP final. Canada will release housing starts and new housing price index. US will releas initial jobless claims as usual on Thursdays.
USD/CHF Daily Outlook
Daily Pivots: (S1) 0.9615; (P) 0.9646; (R1) 0.9676; More.....
USD/CHF is staying in tight range above 0.9613 temporary low for the moment and intraday bias stays neutral first. Deeper decline is still expected as long as 0.9807 resistance holds. But in case of deeper fall, we'd start to look for bottoming signal again as it approaches 0.9443 key support level. However, considering bullish convergence condition in 4 hour MACD, break of 0.9807 will indicate near term reversal and turn outlook bullish for 1.0099 resistance next.
In the bigger picture, USD/CHF is still bounded in medium term range of 0.9443/1.0342 for the moment. Consolidative trading would likely continue and medium term outlook remains neutral. Break of 1.0342 key resistance is needed to confirm underlying bullish momentum in the pair. Meanwhile, downside attempts should be contained by 0.9443 key support level. However, sustained break of 0.9443 will carry larger bearish implication and target 0.9 handle.
Economic Indicators Update
| GMT | Ccy | Events | Actual | Forecast | Previous | Revised |
|---|---|---|---|---|---|---|
| 23:01 | GBP | RICS House Price Balance May | 17.00% | 20.00% | 22.00% | |
| 23:50 | JPY | GDP Q/Q Q1 F | 0.30% | 0.60% | 0.50% | |
| 23:50 | JPY | GDP Deflator Y/Y Q1 F | -0.80% | -0.80% | -0.80% | |
| 23:50 | JPY | Current Account (JPY) Apr | 1.81T | 1.62T | 1.73T | |
| 1:30 | AUD | Trade Balance (AUD) Apr | 0.56B | 1.99B | 3.11B | 3.17B |
| 2:30 | CNY | Trade Balance (USD) May | 40.8B | 47.5B | 38.1B | |
| 2:30 | CNY | Trade Balance (CNY) May | 282B | 336B | 262B | |
| 5:00 | JPY | Eco Watchers Survey Current May | 48.5 | 48.1 | ||
| 5:45 | CHF | Unemployment Rate May | 3.30% | 3.30% | ||
| 6:00 | EUR | German Industrial Production M/M Apr | 0.50% | -0.40% | ||
| 7:15 | CHF | CPI M/M May | 0.00% | 0.20% | ||
| 7:15 | CHF | CPI Y/Y May | 0.30% | 0.40% | ||
| 9:00 | EUR | Eurozone GDP Q/Q Q1 F | 0.50% | 0.50% | ||
| 11:45 | EUR | ECB Rate Decision | 0.00% | 0.00% | ||
| 12:15 | CAD | Housing Starts May | 205K | 213K | ||
| 12:30 | EUR | ECB Press Conference | ||||
| 12:30 | CAD | New Housing Price Index M/M Apr | 0.30% | 0.20% | ||
| 12:30 | USD | Initial Jobless Claims (JUN 03) | 241K | 248K | ||
| 14:30 | USD | Natural Gas Storage | 81B |
European Open Briefing: Markets Remained Quiet In Asia
Global Markets:
- Asian stock markets: Nikkei and ASX 200 both up 0.05 %, Shanghai Composite gained 0.15 %, Hang Seng rose 0.25 %
- Commodities: Gold at $1287 (-0.50 %), Silver at $17.54 (-0.45 %), WTI Oil at $45.97 (+0.55 %), Brent Oil at $48.38 (+0.67 %)
- Rates: US 10-year yield at 2.18, UK 10-year yield at 1.00, German 10-year yield at 0.26
News & Data
- China Trade Balance $40.81bln vs $46.32bln expected
- China Imports 14.8 % vs 8.5 % expected
- China Exports 8.7 % vs 7.0 % expected
- Japan GDP q/q 0.3 % vs 0.6 % expected
- Japan GDP y/y 1.0 % vs 2.4 % expected
- Japan Current Account JPY1.95trln vs JPY1.70trln expected
- Australia Trade Balance A$0.55bln vs $1.95bln expected
- Australia Exports -8.0 % vs 2.0 % previous
- Australia Imports -1.0 % vs 5.0 % previous
Markets Update:
Markets remained quiet in Asia, ahead of three major risk events – the ECB meeting, the Comey testimony and the UK elections.
Comey already released his written testimony yesterday, and the reaction in the market was neutral. Traders did not identify anything that could really hurt US President Trump. Nevertheless, his testimony in front of the committee this afternoon will be closely watched.
The Euro did not move much since yesterday. Traders are waiting for the ECB rate decision. While no changes in rates or QE are expected, the central bank is likely to change their economic outlook. However, low inflation will prevent the ECB from abandoning their loose monetary policy soon. The key levels in EUR/USD are 1.12, 1.1108, 1.1070 and to the topside 1.13 & 1.1420.
Volatility will be high today in the GBP pairs. The market is expecting that Theresa May’s party will win the election, which is why GBP/USD is approaching 1.30. However, if it will be a tight race as the polls suggest, there could be volatile moves prior to the official results. Should May win, GBP is likely to appreciate a bit further. The worst scenario would be a “hung parliament”. The uncertainty would likely bring both the Pound and UK stock markets under pressure.
Upcoming Events:
- 06:45 BST – Swiss Unemployment Rate
- 07:00 BST – German Industrial Production
- 07:15 BST – Swiss CPI
- 12:45 BST – ECB Rate Decision
- 13:30 BST – US Initial Jobless Claims
Daily Technical Outlook And Review: EUR/USD, GBP/USD, AUD/USD, USD/JPY, USD/CAD, USD/CHF, DOW 30, GOLD
A note on lower timeframe confirming price action...
Waiting for lower timeframe confirmation is our main tool to confirm strength within higher timeframe zones, and has really been the key to our trading success. It takes a little time to understand the subtle nuances, however, as each trade is never the same, but once you master the rhythm so to speak, you will be saved from countless unnecessary losing trades. The following is a list of what we look for:
- A break/retest of supply or demand dependent on which way you're trading.
- A trendline break/retest.
- Buying/selling tails ... essentially we look for a cluster of very obvious spikes off of lower timeframe support and resistance levels within the higher timeframe zone.
- Candlestick patterns. We tend to only stick with pin bars and engulfing bars as these have proven to be the most effective.
We typically search for lower-timeframe confirmation between the M15 and H1 timeframes, since most of our higher-timeframe areas begin with the H4. Stops are usually placed 1-3 pips beyond confirming structures.
EUR/USD
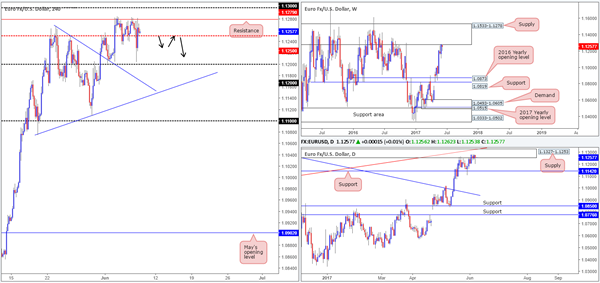
For those who read Wednesday's report you may remember us mentioning that we had taken a short position from 1.1282, and were looking to target the H4 mid-level support at 1.1250 as the initial take-profit zone. As you can see, the trade worked out nicely and hit 1.1250. Unfortunately, we moved our stop to breakeven following this and were taken out shortly after.
Despite H4 price trading back above 1.1250, we still feel the bears have general control of this market, at least from a technical standpoint. This is due to seeing the single currency not only trading around the underside of a weekly supply at 1.1533-1.1278, but also a daily supply, which is glued to the underside of the weekly zone at 1.1327-1.1253.
Our suggestions: To prove seller interest remains, we'd like to see a decisive H4 close form below 1.1250. This – coupled with a retest of 1.1250 and a reasonably sized H4 bear candle (preferably a full-bodied candle) would, in our humble opinion, be enough to begin considering shorts down to 1.1200, and possibly the daily support at 1.1142.
Data points to consider: EUR Minimum bid rate at 12.45pm, ECB Press conference at 1.30pm. US Unemployment claims at 1.30pm GMT+1.
Levels to watch/live orders:
- Buys: Flat (stop loss: N/A).
- Sells: Watch for H4 price to engulf 1.1250 and then look to trade any retest seen thereafter ([waiting for a reasonably sized H4 bear candle to form following the retest is advised] stop loss: ideally beyond the candle's wick).
GBP/USD:
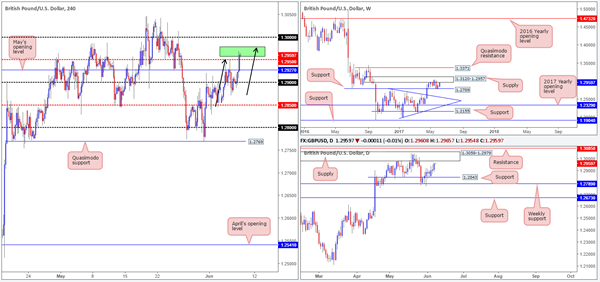
In yesterday's report we noted the 1.2957/1.2979 area (marked in green on the H4 chart) was of interest. This is due to this zone being formed by the underside of both weekly and daily supplies. In addition to this, there's also a nearby H4 AB=CD bearish completion point seen within the green zone taken from the low 1.2845.
As you can see, H4 price is currently trading inside the said green zone and the bears are beginning to make an appearance. Be that as it may, the UK electorate goes to the polls today and this will likely have a marked effect on this pair and could potentially destabilize this technical setup.
Our suggestions: Given the UK elections today, we will not be taking any setups, be it long or short, on GBP-related pairs today, and probably even tomorrow. ‘Acting in your own best interest' is key to success in this business and sometimes the best position is NO position.
Data points to consider: UK elections (all day). US Unemployment claims at 1.30pm GMT+1.
Levels to watch/live orders:
- Buys: Flat (stop loss: N/A).
- Sells: Flat (stop loss: N/A).
AUD/USD
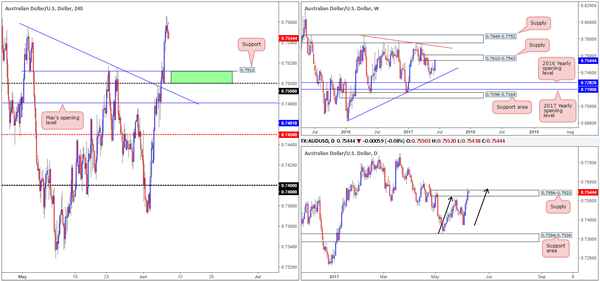
Looking at this market from the top this morning, we can see that weekly price is currently teasing the underside of supply penciled in at 0.7610-0.7543. In conjunction with weekly flow, daily action recently whipsawed above supply formed at 0.7556-0.7523 and touched base with an AB=CD bearish completion point (see black arrows) at 0.7563 taken from the low 0.7328.
In view of the higher-timeframe picture, we believe the H4 candles will continue to push lower today and possibly connect with the 0.75/0.7512 zone seen marked in green. If you look on the M15 timeframe, there was an absolutely beautiful shorting opportunity on the break/retest of a trendline support taken from the low 0.7545. We unfortunately missed this setup, but well done to any of our readers who managed to catch it!
Our suggestions: With the bigger picture indicating that shorts may take control, we will continue to watch the lower timeframes for possible shorting opportunities today, with an initial target zone set at 0.75/0.7512.
Data points to consider: Aussie Trade balance figures at 2.30am, Chinese Trade balance data (tentative). US Unemployment claims at 1.30pm GMT+1.
Levels to watch/live orders:
- Buys: Flat (stop loss: N/A).
- Sells: Currently watching for lower-timeframe shorting opportunities.
USD/JPY
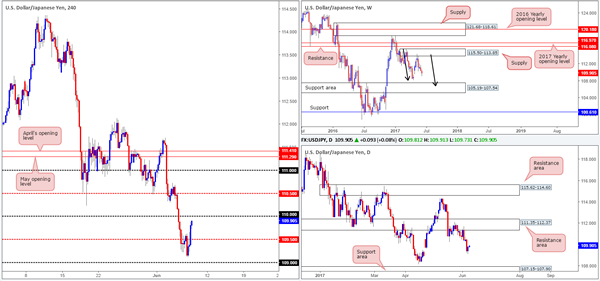
In recent sessions, the USD/JPY recovered from just ahead of the 109 handle and ran through offers at the H4 mid-level resistance drawn from 109.50. Right now, the pair looks poised to attack the 110 handle which could very well hold as resistance today. Be that as it may, the H4 mid-level resistance seen above at 110.50 is, in our opinion, a far more attractive line given how well it held as support throughout May (see green arrows).
Weekly bears continue to remain in a relatively strong position after pushing aggressively lower from supply registered at 115.50-113.85. We know there's a lot of ground to cover here, but this move could possibly result in further downside taking shape in the form of a weekly AB=CD correction (see black arrows) that terminates within a weekly support area marked at 105.19-107.54 (stretches all the way back to early 2014). In conjunction with weekly flow, daily price also shows a potential AB=CD correction in the works taken from the high 114.36, which could see price drive lower to 107.15-107.90: a support zone that's glued to the top edge of the said weekly support area.
Our suggestions: With the above notes in mind, our desk remains biased to the downside. With that, both 110 and 110.50 are possible levels to sell from. To prove seller interest, however, we would advise waiting for a reasonably sized H4 bearish candle to take shape, preferably a full-bodied candle.
Data points to consider: US Unemployment claims at 1.30pm GMT+1
Levels to watch/live orders:
- Buys: Flat (stop loss: N/A).
- Sells: 110 region ([waiting for a reasonably sized H4 bear candle – preferably a full-bodied candle – to form before pulling the trigger is advised] stop loss: ideally beyond the candle's wick). 110.50 ([waiting for a reasonably sized H4 bear candle – preferably a full-bodied candle – to form before pulling the trigger is advised] stop loss: ideally beyond the candle's wick).
USD/CAD
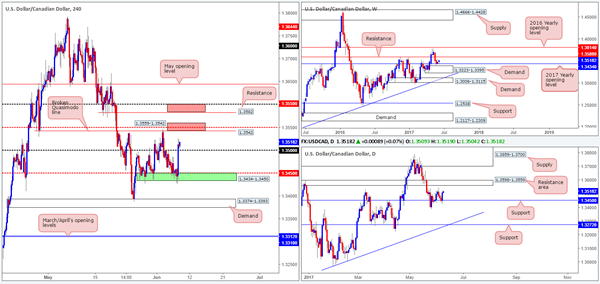
As can be seen from the H4 chart this morning, the market bounced beautifully from the 1.3434-1.3450 green area during yesterday's trading. The zone is comprised of a 2017 yearly opening level at 1.3434 seen on the weekly chart and the H4 mid-level support pegged at 1.3450 which also represents a support level seen on the daily chart.
The advance seen from the said (green) zone has lifted the currency above the 1.35 handle, with H4 price now seen trading within striking distance of a broken Quasimodo line at 1.3542, followed closely by a mid-level resistance penciled in at 1.3550. These two levels, coupled with the underside of a daily resistance area at 1.3559 forms a potential zone for a bounce (lower red zone). However, it might be worth noting that the H4 resistance seen above this area at 1.3582 could also be targeted given that it's positioned so closely to weekly resistance visible at 1.3588.
Our suggestions: Watch for lower-timeframe confirmed (see the top of this report) shorting opportunities around 1.3559-1.3542. Should this area be engulfed, however, we'll then shift our focus up to 1.36/1.3582 (the upper red zone on the H4 chart).
Data points to consider: US Unemployment claims at 1.30pm. BoC Gov. Poloz speaks at 4.15pm GMT+1.
Levels to watch/live orders:
- Buys: Flat (Stop loss: N/A).
- Sells: 1.3559-1.3542 ([waiting for a lower-timeframe sell signal to form before pulling the trigger is advised] stop loss: dependent on where one confirms this area). 1.36-1.3582 ([waiting for a lower-timeframe sell signal to form before pulling the trigger is advised] stop loss: dependent on where one confirms this area).
USD/CHF
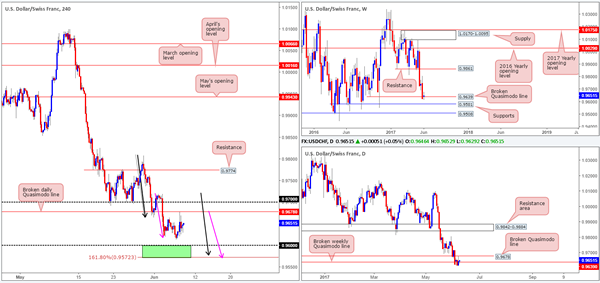
As you can see on the weekly timeframe, the buyers and sellers are behaving somewhat indecisively around the weekly Quasimodo point at 0.9639.The next downside target beyond this hurdle is seen around a support level drawn from 0.9581. Looking down to the daily chart, price recently attacked the underside of a broken Quasimodo line pegged at 0.9678, which we feel could be enough to push H4 price lower into the 0.9572/0.96 region.
This green area marked on the H4 chart is formed by a psychological support handle at 0.96 and a H4 AB=CD (see black arrows) 161.8% bullish completion point at 0.9572. In addition to this, we can also see another H4 AB=CD move possibly in play that terminates around the lower edge of the said green zone (taken from the high 0.9719 – see pink arrows).
Our suggestions: Wait for H4 price to attack 0.9572/0.96 and watch to see if the H4 candles can print a reasonably sized bull candle, preferably a full-bodied candle, before pushing the buy button. This, of course, will by no means guarantee a winning trade, but it will help determine buyer interest and help avoid an unnecessary loss! The first take-profit target from this base will be set around the 0.9650 area.
Data points to consider: US Unemployment claims at 1.30pm GMT+1.
Levels to watch/live orders:
- Buys: 0.9572/0.96 ([waiting for a reasonably sized H4 bull candle – preferably a full-bodied candle – to form before pulling the trigger is advised] stop loss: ideally beyond the candle's tail).
- Sells: Flat (stop loss: N/A).
DOW 30
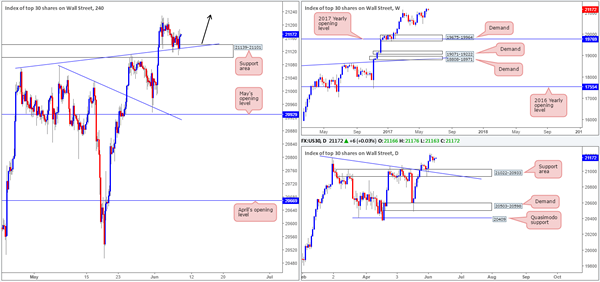
On Wednesday, we mentioned that our desk had taken a small long position at 21164 and placed stops below the H4 support area (21139-21101) at 21097. The position is still active since yesterday's action spent the majority of the day clinging to the top edge of the said H4 support zone, which , as you can probably see, converges with a H4 trendline support etched from the high 21072.
We see absolutely no higher-timeframe resistance ahead, so fresh record highs are what we expect to be seen before the week's end.
Our suggestions: Essentially, what we're looking for here is trend continuation.
Data points to consider: US Unemployment claims at 1.30pm GMT+1.
Levels to watch/live orders:
- Buys: 21164 ([live] stop loss: 21097).
- Sells: Flat (stop loss: N/A).
GOLD:
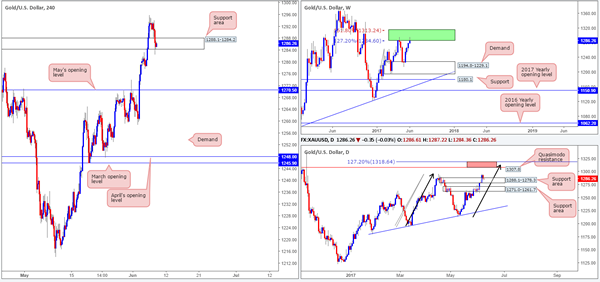
The yellow metal, as expected, has begun turning lower from within an area comprised of two weekly Fibonacci extensions 161.8/127.2% at 1313.7/1285.2 taken from the low 1188.1 (green zone). Similar to when price struck this zone back in mid-April, we expect the bears to drag price action lower from here in the weeks to come.
The story on the daily chart, nevertheless, shows that price is currently retesting a support area formed at 1288.1-1278.3. Provided that this area remains stable, the unit could approach the Quasimodo resistance at 1307.8. Also noteworthy is the possible AB=CD daily bearish pattern (see black arrows) that terminates a tad beyond the said Quasimodo resistance (positioned within the upper limits of the weekly green zone) at 1318.6 (127.2% ext.).
Looking over to the H4 chart, the support area at 1288.1-1284.2 was, in recent hours, breached, but is still managing to hold ground for the time being. It also might be worth acknowledging that this H4 zone is housed within the walls of the daily support area mentioned above at 1288.1-1278.3.
Our suggestions: Unfortunately, we feel this is a risky market to participate in at the moment. A long from the current H4 support area, even though it's bolstered by a daily zone, is chancy knowing where price is positioned on the weekly timeframe. The same, of course, goes for shorts. Selling into the above noted support areas, even with knowing that weekly price is trading within a sell zone would, in our opinion, is still considered too risky.
However, we're still watching for the daily candles to test the aforementioned Quasimodo resistance/127.2% AB=CD completion area (red zone) as it is (given its location on the weekly chart) an ideal sell zone, in our opinion.
Levels to watch/live orders:
- Buys: Flat (stop loss: N/A).
- Sells: 1318.6/1307.8 is a potential sell zone to keep an eye on.
A Bottom Is In Sight For The USDCHF And A Reversal Is Likely To Follow
Key Points:
- Despite recent losses, the pair may not have shaken its long-term bias.
- Numerous technical readings are now bullish.
- If we don’t see a reversal, losses could extend to the 0.95 handle.
The Swissy has been routing for a number of weeks now and, understandably, this has raised questions over whether or not the long-term technical bias is now shifting to bearish. However, we still have one vital support level left before we break what has been an uptrend lasting more than a year. As a result, it’s now make or break time for the bulls as, if they don’t fight back soon, losses may extend to the 0.95 level and beyond.
As shown below, even though the pair has been in decline since December last year, it has remained broadly bullish over the past 12 months. Additionally, without the unexpected effect of the ‘Trump bump,’ gains might have continued to follow the gentle uptrend that began back in April of 2016. This would have prevented the panicked sell-off that now has so many worried that the pair is destined to move to the downside in the long-term
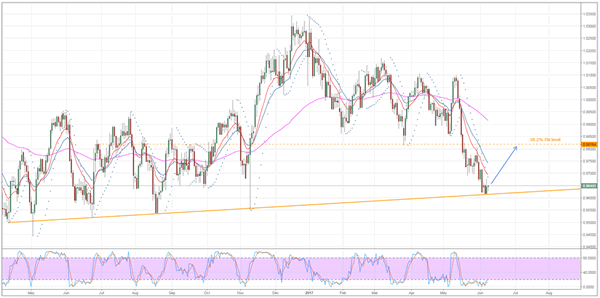
As a result of this, the suggestion that the bulls have entirely given up is rather unfair as they seem to have simply retreated to a robust zone of support, from which, they can stage a comeback. In fact, a number of technical indicators are now shifting to signal that a reversal is on the cards. In particular, the highly oversold stochastics will be giving the bears pause for thought – especially given that the RSI readings are on the verge of reaching a similar conclusion.
What’s more, whilst it is currently bearish, the Parabolic SAR will invert if we see even a mild upswing which will go a long way in rallying the bulls. Furthermore, when combined with the presence of the trend line and the oversold readings, this reading would certainly suggest that a sizable correction to the upside is now warranted. However, the question remains, how far can we expect to see the pair recover in the medium-term?
Using Fibonacci retracement, we can forecast that the rally is likely to run short of steam at around the 0.9818 mark. This coincides with the 38.2% retracement (typically one of the more robust levels) and also a historical reversal point. Moreover, the 100 day moving average should be generating some dynamic resistance at this price which will mean the pair is facing some fairly strong headwinds as it extends.
Ultimately, don’t rule out the chances of the Swissy remaining bullish in the long-term – as tempting as it might be in the wake of the nearly 500 pip rout seen over the past few weeks. As mentioned, the presence of that trend line and the handful of bullish technical readings should be more than enough to encourage the pair to turn around in the absence of a major fundamental upset. Nevertheless, if the USDCHF does slide below the trend line, be prepared to see it test support as low as the 0.95 handle.