Sample Category Title
Sterling Hits 2-Week High ahead of UK Election; Euro Steady with Focus on ECB; Dollar Soft into Comey Hearing
Currency markets were showing signs of caution ahead of key risk events later in the day. Risk aversion supported gold and the yen. The euro and sterling held steady while the dollar index wallowed near seven-month lows. Investors are bracing for the European Central Bank's policy meeting and for the UK general election. All eyes will also be on former FBI Director James Comey's congressional testimony.
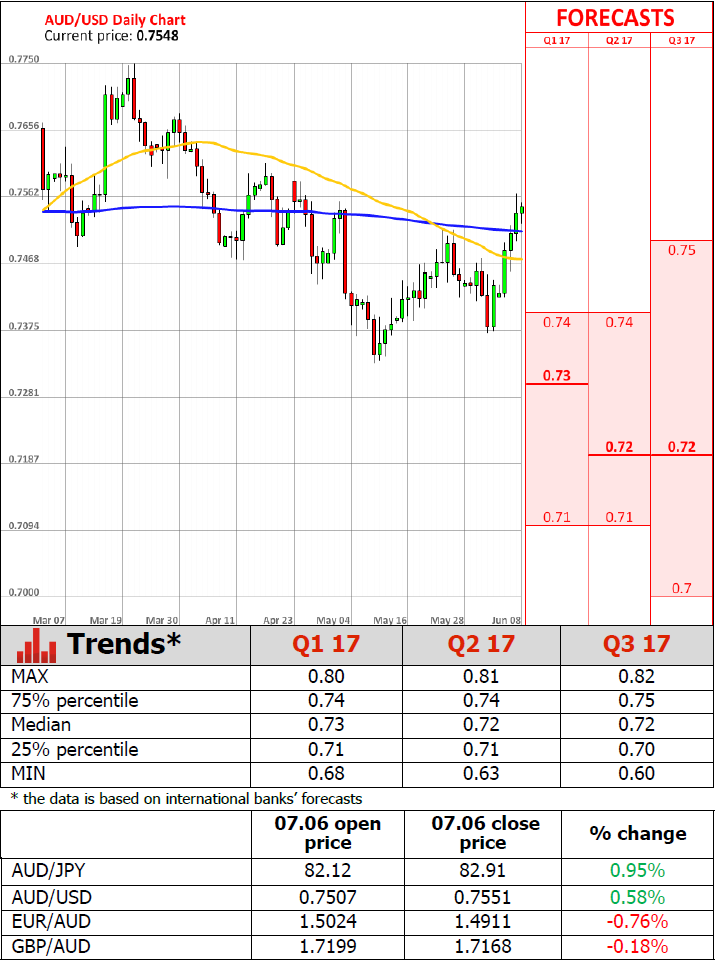
In terms of economic data, the downside miss on Australia's April trade surplus pushed the aussie to a session low of $0.7524 before recovering to $0.7553 after better-than-expected trade data out of China, which is a major trading partner for Australia.
Other data out in the session showed Japan's first quarter GDP data missed forecasts to rise 0.3% over the quarter versus 0.6% expected. The prior estimate was a rise of 0.5%. The yen was not greatly impacted by the data as the safe haven currency was being supported by risk aversion today. The greenback remained below the key 110-yen level during Asian trading today.
During James Comey's testimony, investors will be looking for any hints that US President Donald Trump may have been engaged in obstruction of justice, which is an offence that could lead to impeachment hearings. Comey will testify whether Trump asked him to drop the FBI investigation into fired National Security Adviser Michael Flynn. Political controversies surrounding the US President raise concerns among investors as they may delay passing legislation on Trump's growth agenda.
Sterling traded at 2-week highs to reach $1.2968 as the latest UK election polls suggest Prime Minister Theresa May's Conservatives Party will win a majority in today's vote and this would be positive for the British currency.
The euro was steady against the dollar to trade in a range around $1.1260 during the Asian session as investors turn their focus to the ECB's monetary policy announcement due later today. The central bank is widely expected to keep policy unchanged but markets will look for any hints on how and when it will start normalising its monetary policy.
Oil prices stabilized after a big tumble yesterday in reaction to the EIA report showing US crude inventories rose last week for the first time in 10 weeks, renewing concerns of a supply glut. WTI oil fell below $46 a barrel yesterday but rebounded slightly in Asia today to peak above the $46 mark.
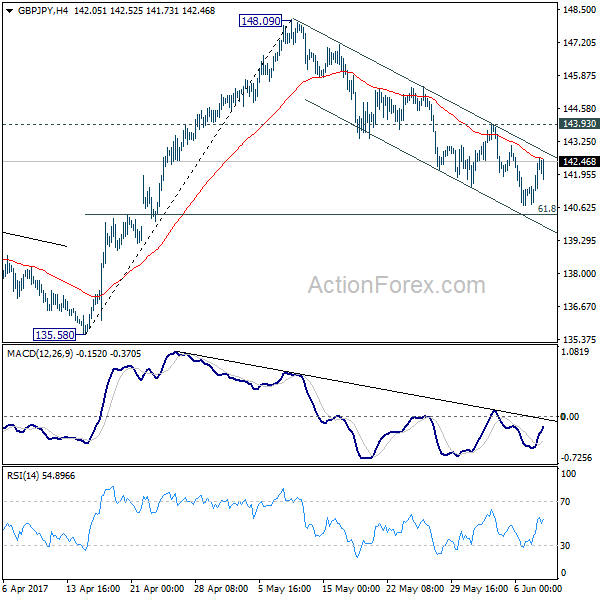
GBP/JPY Daily Outlook
Daily Pivots: (S1) 141.25; (P) 141.81; (R1) 142.89; More....
With 4 hours MACD crossed above signal line again, intraday bias is turned neutral again. As this point, we'll continue to look for bottoming signal around 61.8% retracement of 135.58 to 148.09 at 140.35 to bring rebound. Break of 143.93 will indicate near term reversal and turn bias back to the upside. However, sustained break of 140.35 will bring deeper fall to 135.58 key support level.
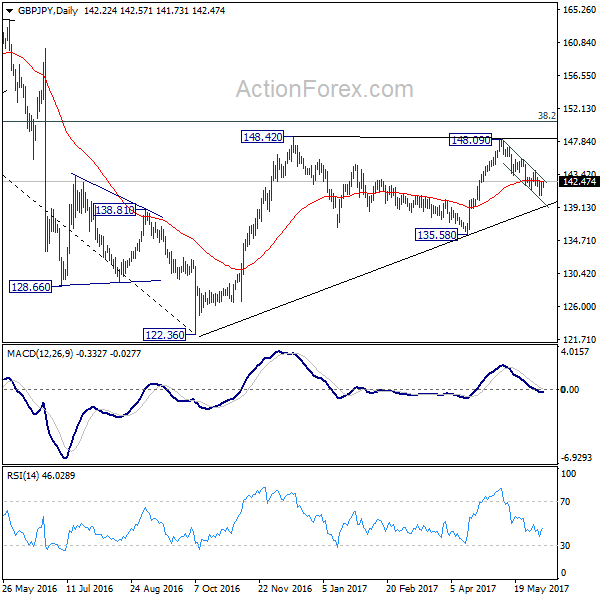
In the bigger picture, rise from 122.36 medium term bottom is still expected to extend to of 195.86 to 122.36 at 150.42. And decisive break there could pave the way to 61.8% retracement at 167.78. However, as the cross is starting to lose upside momentum, rejection below 150.42 and break of 135.58 support will indicate reversal and bring deeper fall back to retest 122.36 instead.
How Will Different Election Outcomes Affect The Markets?
Today is a big day for the market with three major events upcoming: the market-focused UK general election, the Former FBI Director Comey’s testimony, and ECB’s rate decision and press conference at 12:45 and 13:30 BST respectively. The market is expected to be volatile across the board.
In terms of the UK general election, there are 650 seats in total in the House of Commons. To become a majority, a party must win more than half of the 650 seats, which is at least 326 seats. Be aware that the result of the general election outcome will cause volatility to GBP crosses and gold prices.
There will be four possible outcomes :
1. The Conservatives wins more than 350 seats (absolute majority)
The Conservative Party will have more control of the Parliament and reduce the level of opposition from other parties. The UK will be at a stronger position negotiating with the EU under Theresa May’s lead. The result will likely ease market concerns over uncertain UK prospect during the Brexit process to an extent, and hence lifting GBP.
2. The Conservatives wins 326 – 349 seats (narrow majority)
Currently the Tories have 330 seats in the House of Commons. The reason behind the snap election decision was to increase the Conservatives’ dominance in Parliament. If the outcome turns out to be that the Tories narrow majority remains unchanged it will likely result in market disappointment and weigh on GBP. Nevertheless, if the Tories win 340 – 349 seats, markets disappointment is likely to be comparatively moderate.
3. The Conservatives and the Labour both win less than 326 seats (the Tories lose majority, no majority in the Parliament )
If the Tories win less than 326 seats they will lose their current majority in Parliament and this will likely lead to significant market disappointment and a GBP sell-off.
If none of the parties win a majority (326 seats), the Tory and Labour Parties will likely unite with other smaller parties and make a joint government. In this situation, potential hurdles and disagreements caused by the lack of a majority in the Parliament will likely result in the impending 2-year Brexit negotiation process being difficult and weighing on GBP’s prospects.
4. Labour win more than 326 seats (Labour replaces the Tories becoming a majority)
The situation seems to be unlikely to happen, however, not impossible. This will likely shock the market resulting in an initial sell-off in GBP. In addition, market concerns over Corbyn’s soft stance on negotiating with the EU, will also likely weigh on GBP.
Although a weak GBP is likely to boost UK equities, with Labour’s manifesto to raise corporate tax rates this will weigh on UK equities.
To date GBP has been relatively stable ahead of the UK election with the market expecting a Tory win. However, market will likely react differently from a decent victory to a modest win after the release of the election outcome.
This morning, in the early European session, GBP/USD edged up and is currently trading in a range between 1.2950 – 1.2980. EUR/GBP broke through the psychological level at 0.8700 yesterday and is currently trading around 0.8675. GBP/JPY edged up and is holding above the psychological level at 142.00, currently trading around 142.35.
The FTSE 100 index broke through a significant support line at 7500 on Wednesday indicating increased selling pressure. It is currently trading around 7470.
US Crude Oil Inventories Post Surprise Gain Last Week
'Crude, gasoline and distillates inventories are all at or above the top of their five-year ranges; supply remains plentiful.' — Matt Smith, ClipperData
US crude oil inventories rose unexpectedly last week amid lower refinery runs and exports. The Energy Information Administration reported on Wednesday that US crude stockpiles climbed 3.3M barrels in the week ended June 2, following the preceding week's drop of 6.4M barrels. Meanwhile, market analysts anticipated a 3.1M-barrel decline during the reported week. The 3.3M-barrel build in US commercial oil inventories marked the first increase in 10 weeks and raised concerns over the effectiveness of the OPEC production cut agreement. Following the release, WTI futures dropped more than 4% to trade at $46.12 per barrel. Refinery crude runs plunged 283K barrels per day to 17.2M bpd, compared to the prior week's 17.5M-bpd rate. The refinery utilisation rate dropped 0.9% to 94.1%. Crude stockpiles at the Cushing oil hub in Oklahoma fell 1.4M barrels last week. Exports dropped to 557K bpd from the previous week's 1.3M bpd, whereas crude imports advanced 1.1M bpd. Distillate inventories climbed 4.4M barrels, topping expectations for a 281K-barrel gain.
Australia’s Trade Surplus Narrows In April Amid Cyclone Debbie
'We already know that after falling by 60% month-on-month in April, the volume of coal leaving the largest three ports in Queensland leapt by 130% in May, thereby taking it almost back to the level seen in March.' — Paul Dales, Capital Economics
Australia's trade surplus narrowed more than expected in April, official figures revealed on Thursday. The Australian Bureau of Statistics reported that the country's trade balance dropped to a surplus of A$0.56B in April, down from the preceding month's surplus of A$3.17, whereas analysts anticipated a fall to A$1.91B. Exports dropped A$2.8B, or 8%, during the reported month, on a seasonally adjusted basis amid a 45% decrease in the value of coal exports. The decline in exports was a result of the devastation wrought by Cyclone Debbie in March, which hit the north-eastern Australian state of Queensland, causing closures of ports, mines and rail lines. Thursday's trade data suggested that the negative impact of Cyclone Debbie on economic growth had transferred into the second quarter. Meanwhile, imports fell A$0.2B month-over-month in April, or 1%. In real terms, Australian exports dropped 1.6% in the first quarter of 2017, weighing on the country's economic growth. Following the release, the Australian Dollar dropped from 75.37 to 75.30 against its US counterpart.
Technical Outlook: EURUSD Maintains Firm Tone Ahead Of ECB
The Euro is holding just under fresh multi-month high at 1.1285 in early Thursday's trading, with eyes on today's ECB policy meeting. The single currency maintains firm tone for eventual attack at 1.1300 barrier (09 Nov post US-election spike high), as is spent past two weeks in narrow consolidation under the target. Yesterday's dip to 1.1200 zone on news that the ECB needs more evidence of inflation before starts changing monetary policy and subsequent bounce that fully reversed the fall, was seen as bullish signal. Bullish technicals are supportive for probes above 1.1300 but no stronger acceleration is expected, as studies on daily and weekly charts are strongly overbought. Break above 1.1300 barrier would be bullish signal for extension towards next target at 1.1366 (18 Aug 2016 high). On the downside, rising 10SMA (1.1230) marks initial support, followed by daily Tenkan-sen (1.1197) and rising 20SMA (1.1180). Break of these supports would signal further weakness and expose key near-term support at 1.1109 (30 May trough). Traders are awaiting for ECB but other two events today, UK election and testimony of former FBI Director Comey to Senate committee are also in focus and may affect the Euro's performance.
Res: 1.1285, 1.1300, 1.1366, 1.1400
Sup: 1.1247, 1.1230, 1.1197, 1.1109
EUR/JPY Daily Outlook
Daily Pivots: (S1) 122.92; (P) 123.32; (R1) 124.02; More...
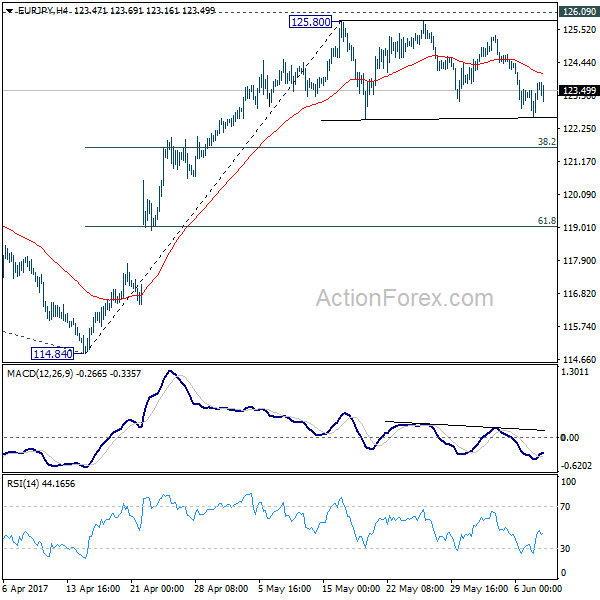
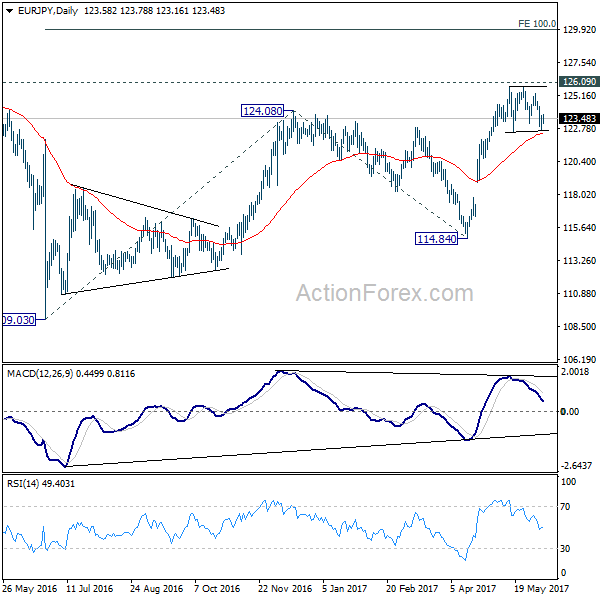
Intraday bias in EUR/JPY remains neutral as the consolidation from 125.80 is still extending. Deeper pull back cannot be ruled out. but downside should be contained by 38.2% retracement of 114.84 to 125.80 at 121.61 to bring rise resumption. We're staying mildly bullish in the cross. And, break of 126.09 key resistance will extend the whole rebound from 109.03 to 100% projection of 109.03 to 124.08 from 114.84 at 129.89. Nonetheless, firm break of 121.61 will dampen our bullish view and bring deeper fall to 61.8% retracement at 119.02.
In the bigger picture, focus is staying on 126.09 support turned resistance. Decisive break there will confirm completion of the down trend from 149.76. And in such case, rise from 109.20 is at the same degree and should target 141.04 resistance and above. Meanwhile, rejection from 126.09 and break of 114.84 will extend the fall from 149.76 through 109.20 low.
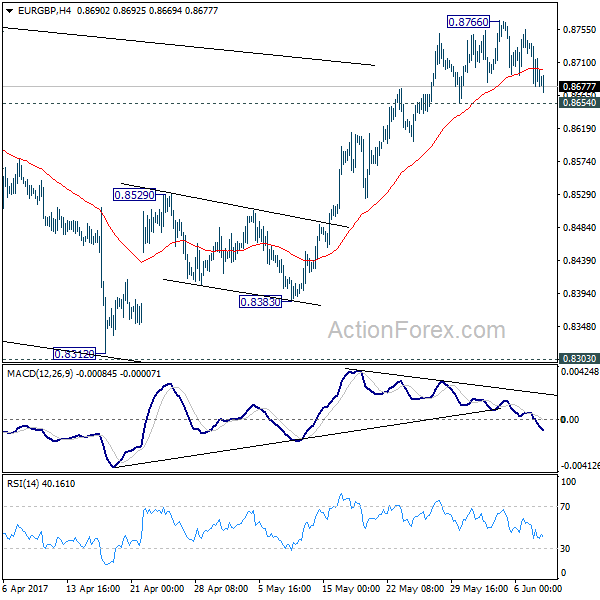
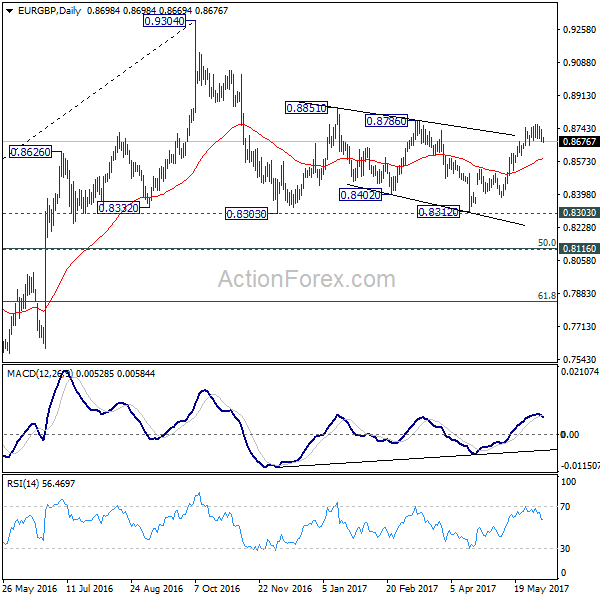
EUR/GBP Daily Outlook
Daily Pivots: (S1) 0.8661; (P) 0.8700; (R1) 0.8723; More...
Intraday bias in EUR/GBP stays neutral as the consolidation from 0.8766 temporary top continues. Further rally is still expected with 0.8654 support intact. Break of 0.8766 will target 0.8786 resistance and then 0.8851. Decisive break of 0.8851 will pave the way to retest 0.9304 high. However, break of 0.8654 will indicate short term topping on bearish divergence condition in 4 hour MACD. In such case, intraday bias will be turned back to the downside for 55 day EMA (now at 0.8585).
In the bigger picture, price actions from 0.9304 are viewed as a medium term corrective pattern. The leg from 0.9304 should have completed after testing 0.8332 structural support. But it's too early to say that larger rise from 0.6935 is resuming. Rejection from 0.9304 will extend the consolidation with another falling leg. Meanwhile, firm break of 0.9304 will target 0.9799 (2008 high). In case of another decline, we'd expect strong support from 0.8116 cluster support (50% retracement of 0.6935 to 0.9304 at 0.8120) to contain downside and bring rebound.
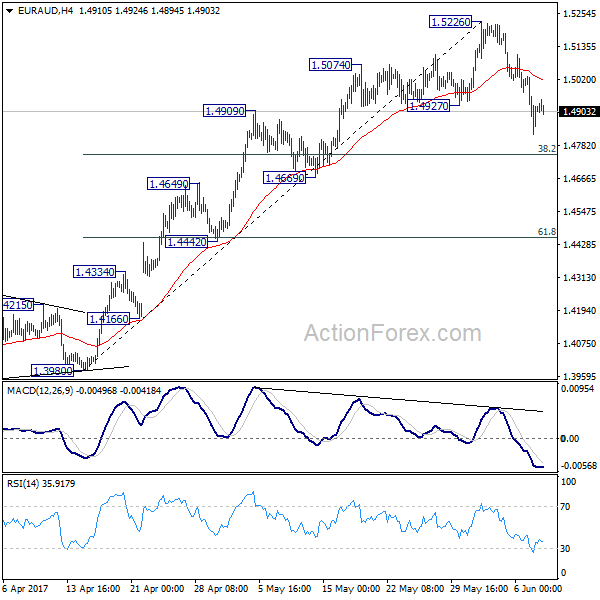
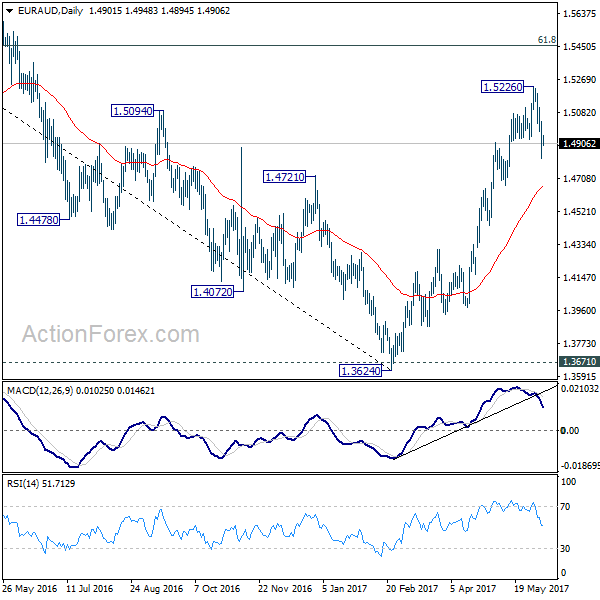
EUR/AUD Daily Outlook
Daily Pivots: (S1) 1.4809; (P) 1.4919; (R1) 1.5016; More...
Intraday bias in EUR/AUD remains on the downside for the moment. The correction from 1.5226 short term top could extend to 38.2% retracement of 1.3980 to 1.5226 at 1.4750. At this point, we'd expect strong support from 1.4669 to contain downside and bring rebound. Larger rise from 1.3642 is expected to resume later after the pull back completes.
In the bigger picture, price actions from 1.6587 medium term top are viewed as a corrective pattern. Such correction should be completed at 1.3624 after defending 1.3671 key support. Rise from 1.3642 is now expected to target 61.8% retracement of 1.6587 to 1.3624 at 1.5455. Sustained break there will pave the way to retest 1.6587. In any case, outlook will now stay cautiously bullish as long as 1.4669 support holds.
Forex Technical Analysis: EUR/USD, USD/JPY, GBP/USD
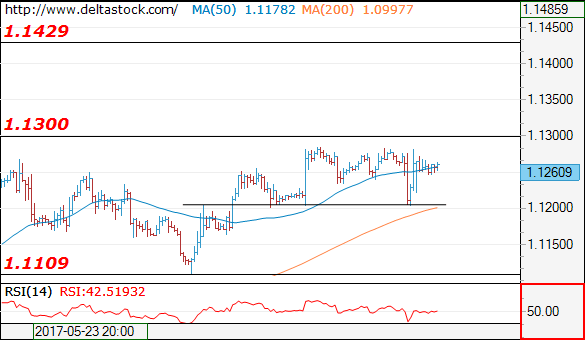
EUR/USD
Current level - 1.1260
The recent dip to 1.1205 support initiated a fast rebound and the outlook is positive, for a break through 1.1300 resistance, towards 1.1430 dynamic hurdle. Crucial support is projected at 1.1205.
| Resistance | Support | ||
| intraday | intraweek | intraday | intraweek |
| 1.1300 | 1.1360 | 1.1205 | 1.1022 |
| 1.1430 | 1.1610 | 1.1165 | 1.0838 |
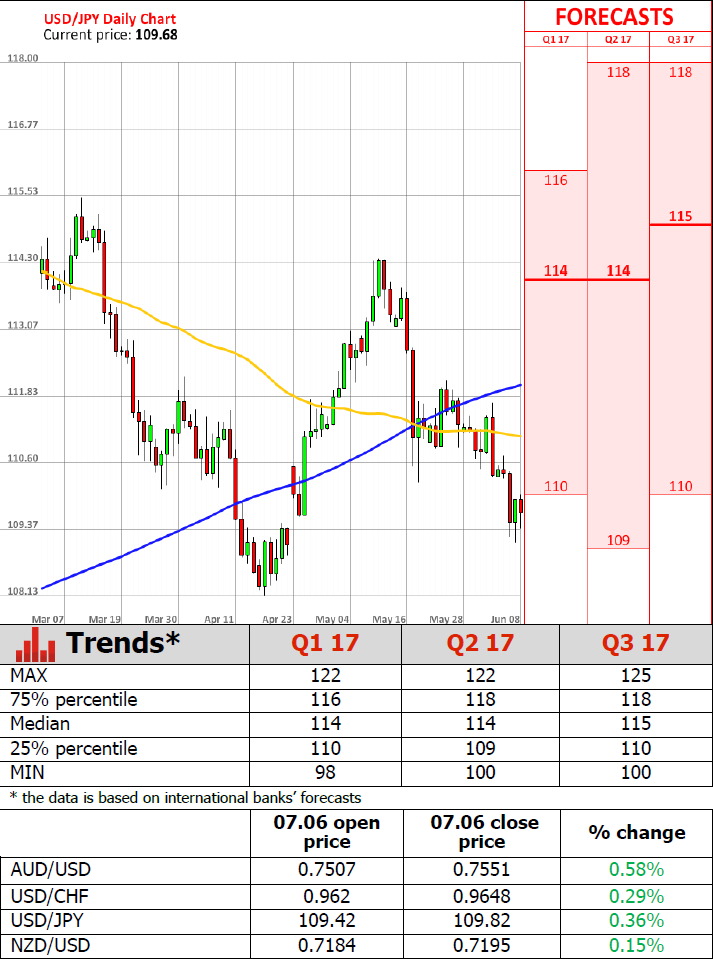
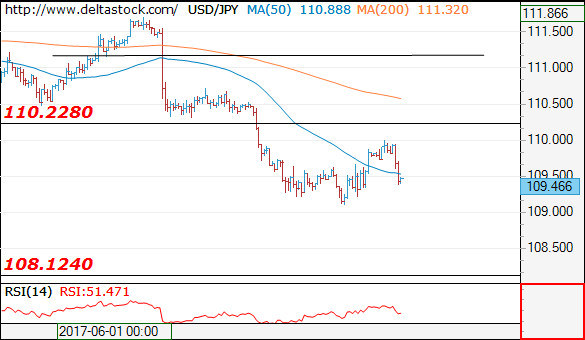
USD/JPY
Current level - 109.46
The recent rebound above 109.10 should be considered corrective, preceding another leg downwards, to 108.12 low. Key resistance lies at 110.20.
| Resistance | Support | ||
| intraday | intraweek | intraday | intraweek |
| 110.20 | 114.30 | 109.10 | 109.40 |
| 112.10 | 115.60 | 108.12 | 108.12 |
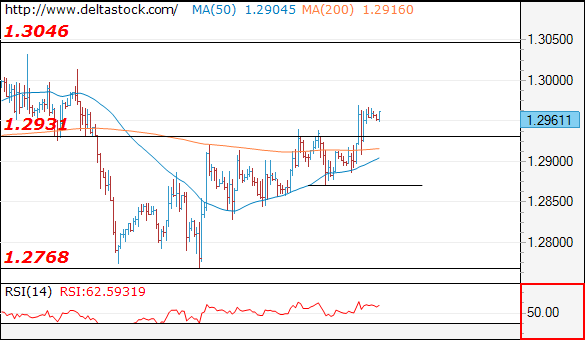
GBP/USD
Current level - 1.2961
The downward attempt failed to break below 1.2850 key support and the upmove is intact, heading towards 1.3050 hurdle. Crucial on the downside is 1.2870 low.
| Resistance | Support | ||
| intraday | intraweek | intraday | intraweek |
| 1.3000 | 1.3120 | 1.2870 | 1.2770 |
| 1.2930 | 1.3500 | 1.2770 | 1.2610 |