Sample Category Title
EUR/USD Mid-Day Outlook
Daily Pivots: (S1) 1.1212; (P) 1.1247 (R1) 1.1291; More....
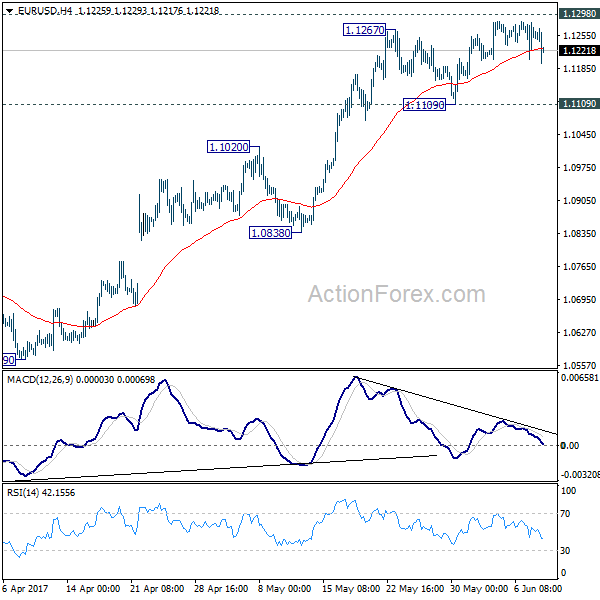
EUR/USD dips mildly against but it's still bounded in range above 1.1109 support. Intraday bias remains neutral with focus on 1.1298 key resistance level. Decisive break of 1.1298 will carry larger bullish implication and target 1.1615 resistance next. However, break of 1.1109 will indicate short term topping and rejection from 1.1298. In that case, intraday bias will be turned back to the downside for 1.0838 support first.
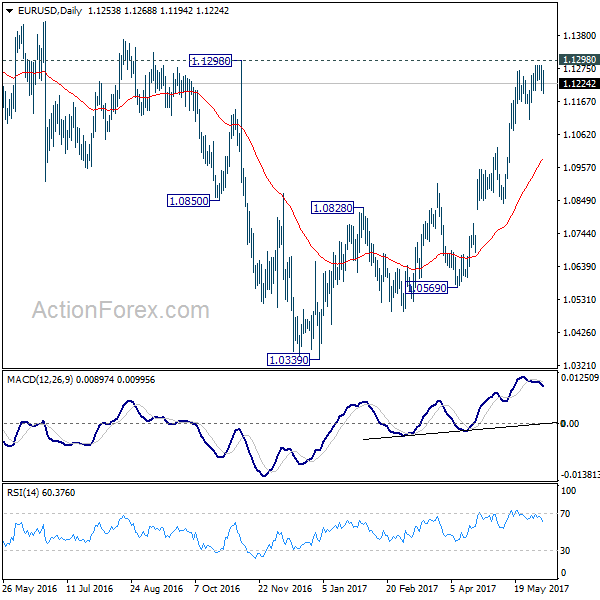
In the bigger picture, the case for medium term reversal continues to build up with EUR/USD staying far above 55 week EMA (now at 1.0888). Also, bullish convergence condition is seen in weekly MACD. Focus will now be on 1.1298 key resistance. Rejection from there will maintain medium term bearishness and would extend the whole down trend from 1.6039 (2008 high). However, firm break of 1.1298 will indicate reversal. In such case, further rally would be seen back to 1.2042 support turned resistance next.
Euro Dips Mildly after ECB But Stays in Range, Inflation Forecast Downgrade Offset by Growth Upgrade
Euro dips mildly after ECB left monetary policies unchanged as widely expected. The central bank moved a tiny step by closing the door for further rate cut. But it leaves the door open for extending the asset purchases. Meanwhile, inflation forecasts were revised down as media reported earlier in the week. But that was offset by the upward revision in growth forecasts. Markets will now look into former FBI Director James Comey's hearing in Senate Intelligence Committee. At the same time, voters in UK are going to vote for their government. Exit polls are expected to be published at around 2200 GMT. By that time, hopefully, we will have a clearer picture on the results of the election, a landslide Conservative victory, a hung parliament, or a surprised Labour win.
ECB: Risks "broadly balanced"
ECB kept key interest rate at 0% and deposit rate at -0.4% today. Asset purchase is held at EUR 60b per month, run through December this year. President Mario Draghi risks to outlook are now "broadly balanced" as the Eurozone is enjoying "stronger momentum" as a "somewhat faster pace than previously expected. Nonetheless, he maintained that substantial degree of monetary accommodation is still needed.
Door for further rate cut closed
ECB closed the door for further rate cut as it said in the statement that "the Governing Council expects the key ECB interest rates to remain at their present levels for an extended period of time, and well past the horizon of the net asset purchases." Previously ECB said that "... at present or lower levels... ". However, ECB maintained the open door for extending the asset purchase program as it noted that "net asset purchases, at the new monthly pace of €60 billion, are intended to run until the end of December 2017, or beyond, if necessary."
Inflation projection revised down, growth up
The latest staff economic projections showed downward revision to inflation forecasts. ECB now projections CPI to be at 1.5% in 2017, 1.3% in 2018 and 1.6% in 2019. That compared to prior forecasts of 1.7% , 1.6% and 1.7% respectively. Draghi said that was mainly because of lower oil prices. On the other hand, growth projections are revised higher. ECB now forecasts GDP growth to be at 1.9% in 2017, 1.8% in 2018 and 1.7% in 2019. That compares to prior 1.8%, 1.7% and 1.7% respectively.
Swiss CPI beat expectation
Swiss CPI rose 0.2% mom and 0.5% yoy in May, above expectation of 0.0% mom, 0.3% yoy. Swiss unemployment rate dropped to 3.2% in May. Business lobby Economiesuisse said that it expected the Swiss economy to grow 1.7% in 2017 and then 2.0% in 2018. That compared to the government's forecast of 1.7% in 2017 and 1.9% in 2018. The group's chief economist Rudolf Minsch noted that there is "still some way to overcoming the franc shock", referring to the even in January 2015 that SNB suddenly removed the Franc cap versus Euro. But he noted that 'the largest part of it is now done". Meanwhile, Minsch saw "broad-based" improvement this year as comparing with last year.
US jobless claims stayed low
Released from US, initial jobless claims dropped -10k to 245k in the week ended June 3, slightly above expectation of 241k. It's now stayed below 300k handle for the 118 straight weeks, longest run since early 1970s. Four week moving average rose 2.25k to 242k. Continuing claims dropped 2k to 1.92m. It stayed below 2m handle for eight straight week, first time since 1973/74. Canada housing starts dropped to 194.7k in May, new housing price index rose 0.8% mom in April.
Elsewhere
German industrial production rose 0.8% mom in April. Eurozone GDP was finalized at 0.6% qoq in Q1, revised up from 0.5% qoq. UK RICS house price balance dropped to 17 in May. Japan Q1 GDP growth was finalized at 0.3% qoq, below expectation of 0.6% qoq. GDP deflator dropped -0.8% yoy. Japan current account surplus widened to JPY 1.81T in April. China trade surplus widened to USD 40.8b, CNY 282b in May. Australia trade surplus narrowed sharply to AUD 0.56b in April.
EUR/USD Mid-Day Outlook
Daily Pivots: (S1) 1.1212; (P) 1.1247 (R1) 1.1291; More....
EUR/USD dips mildly against but it's still bounded in range above 1.1109 support. Intraday bias remains neutral with focus on 1.1298 key resistance level. Decisive break of 1.1298 will carry larger bullish implication and target 1.1615 resistance next. However, break of 1.1109 will indicate short term topping and rejection from 1.1298. In that case, intraday bias will be turned back to the downside for 1.0838 support first.
In the bigger picture, the case for medium term reversal continues to build up with EUR/USD staying far above 55 week EMA (now at 1.0888). Also, bullish convergence condition is seen in weekly MACD. Focus will now be on 1.1298 key resistance. Rejection from there will maintain medium term bearishness and would extend the whole down trend from 1.6039 (2008 high). However, firm break of 1.1298 will indicate reversal. In such case, further rally would be seen back to 1.2042 support turned resistance next.
Economic Indicators Update
| GMT | Ccy | Events | Actual | Forecast | Previous | Revised |
|---|---|---|---|---|---|---|
| 23:01 | GBP | RICS House Price Balance May | 17.00% | 20.00% | 22.00% | |
| 23:50 | JPY | GDP Q/Q Q1 F | 0.30% | 0.60% | 0.50% | |
| 23:50 | JPY | GDP Deflator Y/Y Q1 F | -0.80% | -0.80% | -0.80% | |
| 23:50 | JPY | Current Account (JPY) Apr | 1.81T | 1.62T | 1.73T | |
| 01:30 | AUD | Trade Balance (AUD) Apr | 0.56B | 1.99B | 3.11B | 3.17B |
| 02:30 | CNY | Trade Balance (USD) May | 40.8B | 47.5B | 38.1B | |
| 02:30 | CNY | Trade Balance (CNY) May | 282B | 336B | 262B | |
| 05:00 | JPY | Eco Watchers Survey Current May | 48.6 | 48.5 | 48.1 | |
| 05:45 | CHF | Unemployment Rate May | 3.20% | 3.30% | 3.30% | |
| 06:00 | EUR | German Industrial Production M/M Apr | 0.80% | 0.50% | -0.40% | -0.10% |
| 07:15 | CHF | CPI M/M May | 0.20% | 0.00% | 0.20% | |
| 07:15 | CHF | CPI Y/Y May | 0.50% | 0.30% | 0.40% | |
| 09:00 | EUR | Eurozone GDP Q/Q Q1 F | 0.60% | 0.50% | 0.50% | |
| 11:45 | EUR | ECB Rate Decision | 0.00% | 0.00% | 0.00% | |
| 12:15 | CAD | Housing Starts May | 194.7K | 205K | 213K | 213.5K |
| 12:30 | EUR | ECB Press Conference | ||||
| 12:30 | CAD | New Housing Price Index M/M Apr | 0.80% | 0.30% | 0.20% | |
| 12:30 | USD | Initial Jobless Claims (JUN 03) | 245K | 241K | 248K | 255K |
| 14:30 | USD | Natural Gas Storage | 98B | 81B |
(ECB) Introductory Statement to the Press Conference
Mario Draghi, President of the ECB,
Vítor Constâncio, Vice-President of the ECB,
Tallinn, 8 June 2017
INTRODUCTORY STATEMENT
Ladies and gentlemen, the Vice-President and I are very pleased to welcome you to our press conference. I would like to thank Governor Hansson for his kind hospitality and express our special gratitude to his staff for the excellent organisation of today's meeting of the Governing Council. We will now report on the outcome of our meeting.
Based on our regular economic and monetary analyses, we decided to keep the key ECB interest rates unchanged. We expect them to remain at their present levels for an extended period of time, and well past the horizon of our net asset purchases. Regarding non-standard monetary policy measures, we confirm that our net asset purchases, at the current monthly pace of €60 billion, are intended to run until the end of December 2017, or beyond, if necessary, and in any case until the Governing Council sees a sustained adjustment in the path of inflation consistent with its inflation aim. The net purchases will be made alongside reinvestments of the principal payments from maturing securities purchased under the asset purchase programme.
Our monetary policy measures have continued to preserve the very favourable financing conditions that are necessary to secure a sustained convergence of inflation rates towards levels below, but close to, 2% over the medium term. The information that has become available since our last monetary policy meeting in late April confirms a stronger momentum in the euro area economy, which is projected to expand at a somewhat faster pace than previously expected. We consider that the risks to the growth outlook are now broadly balanced.
At the same time, the economic expansion has yet to translate into stronger inflation dynamics. So far, measures of underlying inflation continue to remain subdued. Therefore, a very substantial degree of monetary accommodation is still needed for underlying inflation pressures to build up and support headline inflation in the medium term. If the outlook becomes less favourable, or if financial conditions become inconsistent with further progress towards a sustained adjustment in the path of inflation, we stand ready to increase our asset purchase programme in terms of size and/or duration.
Let me now explain our assessment in greater detail, starting with the economic analysis. Euro area real GDP increased by 0.6%, quarter on quarter, in the first quarter of 2017, after 0.5% in the last quarter of 2016. Incoming data, notably survey results, continue to point to solid, broad-based growth in the period ahead. The pass-through of our monetary policy measures has facilitated the deleveraging process and should continue to support domestic demand. In particular, the recovery in investment continues to benefit from very favourable financing conditions and improvements in corporate profitability. Employment gains, which are also benefiting from past labour market reforms, are supporting real disposable income and private consumption. Moreover, the global recovery is increasingly supporting trade and euro area exports. However, economic growth prospects continue to be dampened by a sluggish pace of implementation of structural reforms, in particular in product markets, and by remaining balance sheet adjustment needs in a number of sectors, notwithstanding ongoing improvements.
This assessment is broadly reflected in the June 2017 Eurosystem staff macroeconomic projections for the euro area, finalised in late May, which are conditional on the full implementation of all our monetary policy measures. These projections foresee annual real GDP increasing by 1.9% in 2017, by 1.8% in 2018 and by 1.7% in 2019. Compared with the March 2017 ECB staff macroeconomic projections, the outlook for real GDP growth has been revised upwards over the projection horizon.
The risks surrounding the euro area growth outlook are considered to be broadly balanced. On the one hand, the current positive cyclical momentum increases the chances of a stronger than expected economic upswing. On the other hand, downside risks relating to predominantly global factors continue to exist.
According to Eurostat's flash estimate, euro area annual HICP inflation was 1.4% in May, following 1.9% in April and 1.5% in March. As expected, the recent volatility in inflation rates was mainly due to energy prices and temporary increases in services prices over the Easter period. Looking ahead, on the basis of current futures prices for oil, headline inflation is likely to remain around current levels in the coming months. At the same time, measures of underlying inflation remain low and have yet to show convincing signs of a pick-up, as unutilised resources are still weighing on domestic price and wage formation. Underlying inflation is expected to rise only gradually over the medium term, supported by our monetary policy measures, the continuing economic expansion and the corresponding gradual absorption of economic slack.
This assessment is also broadly reflected in the June 2017 Eurosystem staff macroeconomic projections for the euro area, which foresee annual HICP inflation at 1.5% in 2017, 1.3% in 2018 and 1.6% in 2019. By comparison with the March 2017 ECB staff macroeconomic projections, the outlook for headline HICP inflation has been revised downwards, mainly reflecting lower oil prices.
Turning to the monetary analysis, broad money (M3) continues to expand at a robust pace, with an annual rate of growth of 4.9% in April 2017, after 5.3% in March. As in previous months, annual growth in M3 was mainly supported by its most liquid components, with the narrow monetary aggregate M1 expanding at an annual rate of 9.2% in April 2017, after 9.1% in March.
The recovery in loan growth to the private sector observed since the beginning of 2014 is proceeding. The annual growth rate of loans to non-financial corporations increased to 2.4% in April 2017, from 2.3% in the previous month, while the annual growth rate of loans to households remained stable at 2.4% in April. The pass-through of the monetary policy measures put in place since June 2014 continues to significantly support borrowing conditions for firms and households, access to financing, notably for small and medium-sized enterprises, and, hence, credit flows across the euro area.
To sum up, a cross-check of the outcome of the economic analysis with the signals coming from the monetary analysis confirmed the need for a continued very substantial degree of monetary accommodation to secure a sustained return of inflation rates towards levels that are below, but close to, 2%.
In order to reap the full benefits from our monetary policy measures, other policy areas must contribute much more decisively to strengthening economic growth. The implementation of structural reforms needs to be substantially stepped up to increase resilience, reduce structural unemployment and boost productivity and potential output growth. Regarding fiscal policies, all countries would benefit from intensifying efforts towards achieving a more growth-friendly composition of public finances. A full, transparent and consistent implementation of the Stability and Growth Pact and of the macroeconomic imbalances procedure over time and across countries remains essential to bolster the resilience of the euro area economy.
We are now at your disposal for questions.
(ECB) Monetary Policy Decisions
At today's meeting, which was held in Tallinn, the Governing Council of the ECB decided that the interest rate on the main refinancing operations and the interest rates on the marginal lending facility and the deposit facility will remain unchanged at 0.00%, 0.25% and -0.40% respectively. The Governing Council expects the key ECB interest rates to remain at their present levels for an extended period of time, and well past the horizon of the net asset purchases.
Regarding non-standard monetary policy measures, the Governing Council confirms that the net asset purchases, at the current monthly pace of €60 billion, are intended to run until the end of December 2017, or beyond, if necessary, and in any case until the Governing Council sees a sustained adjustment in the path of inflation consistent with its inflation aim. The net purchases will be made alongside reinvestments of the principal payments from maturing securities purchased under the asset purchase programme. If the outlook becomes less favourable, or if financial conditions become inconsistent with further progress towards a sustained adjustment in the path of inflation, the Governing Council stands ready to increase the programme in terms of size and/or duration.
The President of the ECB will comment on the considerations underlying these decisions at a press conference starting at 14:30 CET today.
Super Thursday – Politics and Monetary Policy Take Center Stage
Thursday June 8: Five things the markets are talking about
Pick your poison. Today is a pivotal day for capital markets with three major events - ECB monetary decision, U.K Parliamentary elections and Comey's U.S senate testimony - expected to influence the directions of the various asset classes.
If today's U.K election brings a hung parliament, some sterling bulls think that a Labour-led coalition could be the most 'positive scenario' for GBP (£1.2964).
Under this scenario, the pound is expected to plummet on the headline - PM Theresa May would have to resign, and the pending Brexit negotiations would have to be postponed. Pound "bulls" sees this type of price action as a potential buying opportunity. Why? It would require the Labour Party to negotiate with the pro-EU Scottish National Party and Liberal Democrats, which could result in a commitment to hold a second referendum and a greater likelihood of a softer Brexit.
However, if the Conservative Party increases its majority, it could be considered either positive or negative for the pound, depending on your timeline.
PM May winning more seats would provide GBP some short-term relief, but how high it goes, that depends on the increase in number of seats. The Conservatives held 330 seats when Parliament was dissolved on May 3. Some polls have suggested that the Tories are inline for a 74-seat majority, the biggest since Thatcher.
In the longer term, the Conservatives' plan to take the U.K out of the single market is expected to weigh on GBP, in part due to tough Brexit negotiations, thus any meaningful rally may be considered to be short lived.
Note: The first big event is the 'Exit Poll' at 22:00 BST/17:00 EDT. In 2015, the first exit poll correctly predicted a Conservative majority - contradicting all polling - it turned out to be right. The second exit poll, 15 or so minutes later, predicted an even bigger majority and got the final number spot on.
This morning's ECB policy decision - 07:45am EDT, no rate change is expected, but the central bank may drop the reference to "downside" risks to growth, while reiterating a weak inflation outlook - is followed by Mario Draghi's press conference (8:30am EDT).
Stateside, ahead of his Congressional appearance today, the former FBI head James Comey released a prepared testimony yesterday saying the president asked him to end an investigation into the former national security adviser.
1. Stocks mixed results
The aforementioned geopolitical worries have many investors wading to the sidelines to seek sanctuary, at least until there is more market clarity.
In Japan, the Nikkei and the broader Topix gave up early gains to close lower (-0.4%) overnight as the yen (¥109.89) rallied in a market already on tenterhooks. Data earlier in the day showed Japan's economy growing less than the government initially reported for Q1. Final GDP was revised lower by its biggest margin since 2009, + 0.3% vs. +0.6%e q/q.
In Hong Kong, the Hang Seng and the Shanghai Composite Index each increased +0.3% on the back of stronger China data - exports rose +8.7% in May vs. +7.2% expected gain.
In South Korea, the Kospi index increased +0.2% - North Korea launched a series of short-range missiles overnight.
In Europe, indices are trading higher across the board in thin trading as the markets await the ECB rate announcement and the U.K election results.
U.S stocks are set to open in the "black" (+0.1%).
Indices: Stoxx50 +0.3% at 3561, FTSE +0.1% at 7483, DAX +0.3% at 12714, CAC-40 +0.2% at 5277, IBEX-35 +0.3% at 10909, FTSE MIB flat at 20743, SMI flat at 8880, S&P 500 Futures +0.1%
2. Oil off one-month lows, but supply gloom caps gains
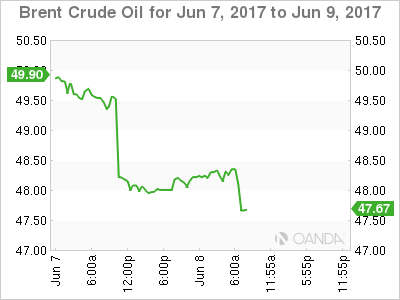
Oil has pushed a tad higher from yesterday's one-month low print, which came about after an unexpected surge in U.S inventories and the return of more Nigerian crude to an already oversupplied market.
Note: Yesterday, Royal Dutch Shell lifted its force majeure on exports of Nigeria's crude, bringing all the country's oil grades fully online for the first time in 16-months.
Brent crude is up +43c at +$48.49 a barrel, having fallen -4% yesterday, while U.S crude (WTI) has rallied +38c to +$46.10 a barrel.
The market has also come under pressure from news of rising output from Libya, which together with Nigeria is exempt from the production cut made by OPEC.
The "big" dollars actions and investors risk appetite to today's highlighted geopolitical events will mostly influence today's crude price movements.
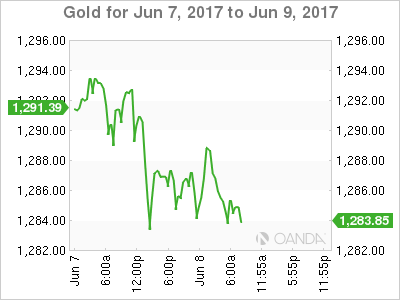
Ahead of the U.S open, gold is holding steady (-0.1% to +$1,285.92), hovering close to its six-week high print in Tuesday's session, on weaker global stocks and amid dwindling expectations for aggressive U.S rate hikes this year.
3. Global yields looking for direction
Currently, U.K Gilt yields are little changed, as are rates in Germany (Bunds) and France (OAT's).
However, yields on 10-year German Bunds (+0.27%) maybe set to rise whether the ECB delivers a 'hawkish' surprise or it opts for a 'neutral' stance. If the former happens, bond prices are expected to drop more aggressively, backing up yields, on more solid prospects of asset purchase tapering and a quicker rise in policy rates.
In Japan, yields backed up more aggressively in the overnight session on hearsay reports that the Bank of Japan (BoJ) is recalibrating its communication policy to talk more openly about exit strategy - 10-year JGB's backed up +5 bps to +0.06%, while the on 20-year bonds rose +3 bps, climbing for the first time in five days.
Elsewhere, U.S 10-year Treasury yield rallied +1 bps to +2.18%.
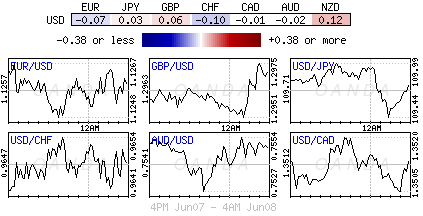
4. Dollar looking for guidance
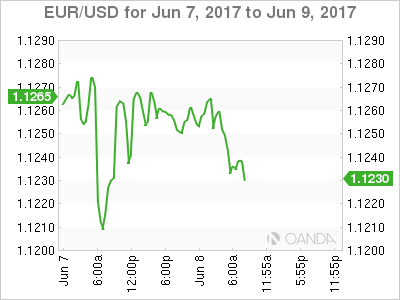
The EUR (€1.1234) is a tad weaker ahead of a ECB decision at 0.7:45 EDT and President Draghi's press conference at 08:30 EDT. The 'single' unit has gained recently on expectations the ECB could hint at scaling back monetary easing after recently improved eurozone data. Yesterday, the EUR fell (intraday low €1.1208) following an anonymous report that the ECB would cut inflation forecasts. This would suggest that the current price has reduced inflation forecasts somewhat priced in, which could reduces the scope for more EUR falls.
The pound (£1.2961) is holding below the psychological £1.30 level as voting gets underway in the U.K for the Parliamentary elections. How high the pound will surge will depend on how wide the expected majority will be.
Elsewhere, USD/JPY (¥110.06) is higher after Japan Q1 Final GDP was revised lower. The pair initially stalled at ¥110 area after reports circulated that BoJ was considering ways of communicating any shape of Japan's QE exit.
5. Eurozone economy grows at fastest rate since 2015
Data this morning shows that the eurozone's economy grew at a faster rate than previously estimated during the first three months of 2017 as investment spending continued to rise.
The European Union's statistics agency said that in Q1, GDP increased by +0.6% from Q4, 2016, and by +1.9% from Q1, 2016.
Note: Eurostat had previously estimated q/q growth at +0.5%, and y/y growth at +1.7%.
This translates into annualized growth of +2.3%, up from +2.1% in Q4. During Q1, the U.S economy grew by +1.2%.
Despite the pickup in growth, the ECB remains cautious about removing the stimulus they have provided over the years, awaiting clear evidence that the recovery is stoking underlying inflationary pressures.
Euro Quiet As Investors Cautious Ahead Of ECB Rate Decision
It has been a lackluster week for the euro, and the trend has continued on Thursday, ahead of the ECB rate decision. In the European session, EUR/USD has inched lower and is trading at 1.1240. In economic news, German Industrial Production bounced back in April with a strong gain of 0.8%, which beat the forecast of 0.6%. There was more good news from Eurozone Revised GDP, which improved to 0.6%, edging above the estimate of 0.5%. Today's highlight is the ECB rate meeting, with the markets expecting the benchmark rate to remain at a flat 0.00%. The US releases unemployment claims, which is expected to drop to 241 thousand.
All eyes are on the ECB, which holds it monthly rate meeting later in the day. The central bank is not expected to announce any changes to current monetary policy. The benchmark rate has been pegged at 0.00% since March 2016. As well, policymakers are unlikely to make any changes to the quantitative easing program, which ends in December. However, the euro could still move if there are any surprises in the rate statement or from Mario Draghi, who will hold a follow-up press conference. On Wednesday, the euro briefly lost ground on reports that the ECB was planning to downgrade its inflation forecast to 1.5% annually for 2017, 2018 and 2019. In a March forecast, the bank predicted inflation at 1.7%, 1.6% and 1.7%, respectively. The forecast of weaker inflation is being attributed to lower energy prices. Earlier in the year, inflation reached the ECB's target of 2.0%, but this didn't last long, and the May figure of 1.4% was well of this goal. Mario Draghi has preached caution and patience, and will reluctant to tighten policy without stronger inflation levels. Still, with the euro-area economy showing improved growth in 2017, the markets would like to see the ECB at least acknowledge that the economic picture has brightened, and will be looking for a more hawkish tone from the central bank, such as a removal of the bias towards easing. If there are some nuances in the rate statement or Draghi's comments that point to a more hawkish stance, the euro could move higher.
In Washington, the hottest ticket in town is the Senate Intelligence Committee hearing of former FBI director James Comey. On Wednesday, the committee released a written statement from Comey which discussed his meeting with President Trump. There are accusations that Trump asked Comey to close an investigation into Trump's alleged ties with Moscow, and the committee will grill Comey on this key issue. The media is in a feeding frenzy ahead of Comey's testimony, but it is doubtful that his testimony will be the “smoking gun” that leads to charges of obstruction of justice against President Trump. At the same time, Comey's testimony could complicate matters for a beleaguered Trump administration, and any dramatic revelations could shake up the markets. Investors are growing more skeptical that Trump, who seems to be spending most of his time in damage control mode, will be able to deliver on key campaign planks, such as tax reform. If Trump appears even more vulnerable after Comey's day on the stand, the dollar could weaken.
EUR/GBP Elliott Wave Analysis
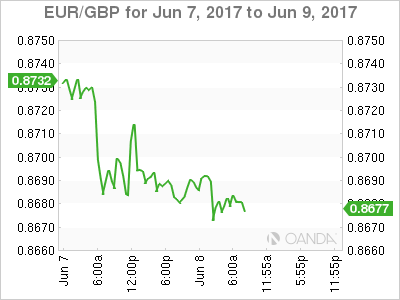
EUR/GBP – 0.8679
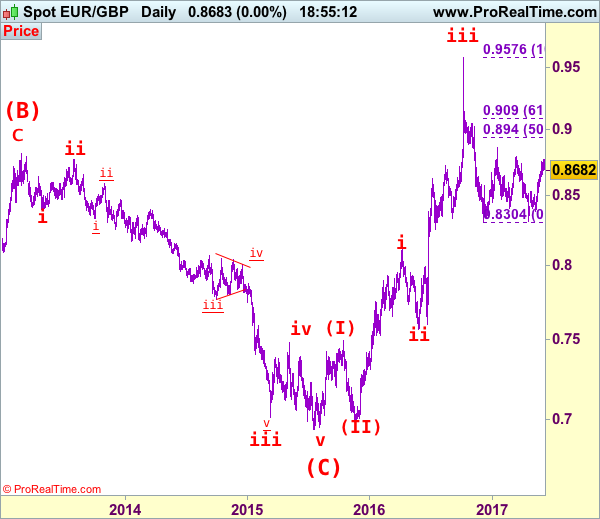
EUR/GBP – The major (A)(B)(C)-(X)-(A)(B)(C) correction from 0.9805 is unfolding and 2nd (A) has possibly ended at 0.6936.
As the single currency has finally retreated after rising to 0.8771 earlier this week, suggesting minor consolidation below this level would be seen and pullback to 0.8650, then 0.8600-10 cannot be rule out, however, reckon 0.8570-75 would limit downside and bring another rise later, above said resistance at 0.8771 would signal another leg of corrective rise from 0.8312 low is underway for gain to 0.8788 resistance, having said that, as broad outlook remains consolidative, reckon upside would be limited to another previous resistance at 0.8857.
Our latest preferred count is that the wave V of a 5-wave series from 0.5682 ended at 0.9805 earlier and major from there has possibly ended at 0.8067 as A-B-C-X-A-B-C. We are keeping our view that the entire correction from 0.9805 has possibly ended at 0.7756 and as labeled as the attached daily chart and impulsive move from 0.9084 has ended at 0.7756 as a 5-waver which marked either the (C) wave or the A leg of (C), a daily close above resistance at 0.8831 would suggest (C) leg has ended and headway towards 0.9084.
On the downside, whilst initial pullback to 0.8600-05 cannot be rule out, reckon 0.8565-70 would limit downside and bring another rise later. Below support at 0.8524 would suggest top is possibly formed instead, risk weakness to 0.8500-05 but only break of 0.8455-60 would confirm and suggest the rebound from 0.8312 has ended, bring further fall towards indicated key support at 0.8384.
Recommendation: Buy at 0.8570 for 0.8720 with stop below 0.8500
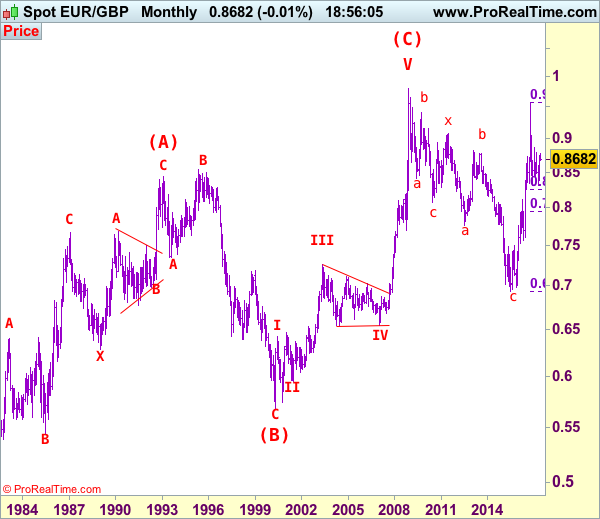
Euro's long term uptrend started in Feb 1981 at 0.5039 and is unfolding as a (A)-(B)-(C) move with (A): 0.8433 (Feb 1993), (B): 0.5682 (May 2000) and impulsive wave (C) should have ended at 0.9805 with wave III ended at 0.7254 (May 2003), triangle wave IV at 0.6536 (23 Jan 2007) and wave V as well as wave (C) has ended at 0.9805.
We are keeping an alternate count that only wave III ended at 0.9805 and the correction from there is the wave IV and may extend weakness to 0.7700, however, it is necessary to see a daily close above resistance at 0.9143 would change this to be the preferred count.
Technical Outlook: AUDUSD Remains Steady Despite Downbeat Australian Data
The Australian dollar remains steady against the greenback on Thursday and holding near previous day's fresh recovery high at 0.7566, showing no stronger negative impact on downbeat Australian trade data.
Australian trade surplus narrowed to 0.56 billion in April, falling well below the forecast at 1.91 billion and 3.11 million AUD surplus in March.
The pair is holding within daily cloud, with cloud base offering solid support at 0.7525, reinforced by 200SMA, where today's dips were contained.
However, gains remain capped by 100SMA (0.7556) which was briefly dented on Wednesday.
Overall bullish structure suggests further upside, however, bulls could be delayed for correction on strongly overbought slow stochastic on daily chart.
Extended pullback should be ideally contained at 0.7500 zone (55SMA/Fibo 38.2% of 0.7369/0.7566 upleg) to keep bullish structure intact and avert deeper correction, as the pair is on track for strong weekly bullish close.
Res: 0.7556, 0.7585, 0.7610, 0.7664
Sup: 0.7527, 0.7500, 0.7468, 0.7447
USD/CAD Elliott Wave Analysis
USD/CAD – 1.3510
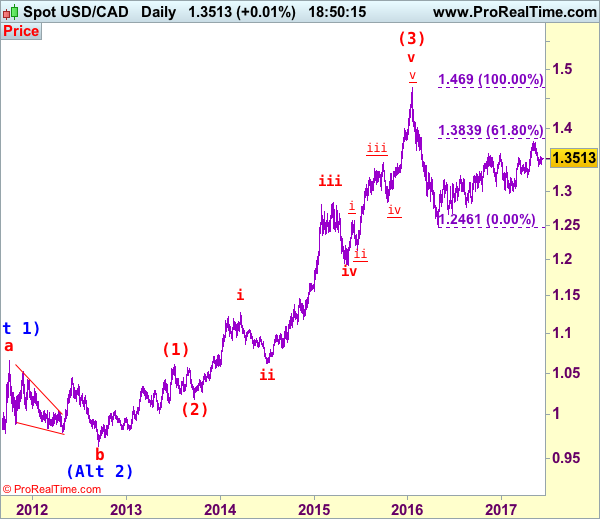
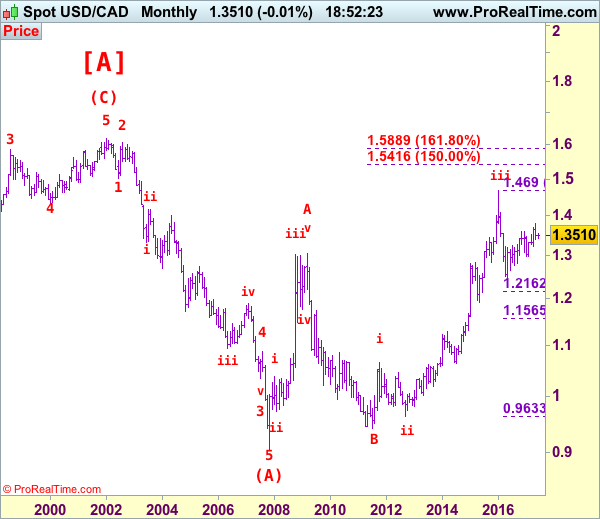
USD/CAD – Wave v ended at 0.9407 and a-b-c correction may extend gain to 1.4700
Although the greenback did meet selling interest at 1.3547 and retreated (we recommended in our previous update to sell at 1.3530 and a short position was entered), as the pair found support at 1.3426 yesterday and has rebounded again, suggesting further consolidation above lsat month’s low at 1.3387 would be seen and another bounce to said resistance at 1.3547 cannot be ruled out, however, still reckon 1.3590-00 would cap upside and bring another decline later. Below 1.3426 support would signal decline from 1.3794 top has resumed for retest of 1.3387, break there would extend weakness to 1.3320-30, then towards support at 1.3262 but reckon key support at 1.3223 would hold from here, bring rebound later. Looking ahead, only a daily close below this level would provide confirmation that recent upmove has ended at 1.3794, bring further subsequent decline to 1.3140-50 and then 1.3090-00.
We are keeping our view that the wave b from 1.0657 (a leg top) has possibly ended at 0.9633 with (a): 0.9800, wave (b): 1.0447 and wave c at 0.9633, the subsequent rise from there is now treated as wave c exceeded indicated upside target at 1.3770-80 and 1.4000 and wave (3) has possibly ended at 1.4690 and wave (4) correction has commenced for retracement back to 1.2832 support, then 1.2410-20.
On the daily chart, our latest preferred count remains that the A of (B) rally from 0.9059 low (7 Nov 2007) unfolded into an impulsive wave with i: 0.9059-1.0380, ii ended at 0.9819, iii at 1.3019 followed by triangle wave iv at 1.2026 , then wave v formed a top at 1.3066 and also ended the wave A. The wave B is unfolding as an double three a-b-c-x-a-b-c and is sub-divided as a: 1.2192, b: 1.2716 and wave c at 1.0784, followed by wave x at 1.1725, another set of a-b-c unfolded with 2nd a at 0.9931, 2nd b at 1.0674. the 2nd c has possibly ended at 0.9407, therefore, consolidation with upside bias is seen for major correction, indicated target at 1.3900 had been met and gain to 1.4700 would follow.
On the upside, whilst initial recovery to 1.3547 cannot be ruled out, reckon upside would be limited to previous support at 1.3571 and bring another decline later. A daily close above previous support at 1.3571 would suggest the first leg of decline from 1.3794 has ended, bring a stronger rebound to 1.3610-15 and possibly towards resistance at 1.3670, price should falter well below said resistance at 1.3794, bring another decline later.
Recommendation: Hold short entered at 1.3530 for 1.3330 with stop above 1.3630.
Longer term - The selloff from 1.6194 (21 Jan 2002) to 0.9059 (07 Nov 2007) is viewed as (A) wave which is a 5-waver as labeled on the monthly chart as below, the subsequently rally is labeled as (B) with impulsive A leg of (B) ended at 1.3066, wave B of (B) is unfolding which has either ended at 0.9407 or would extend one more fall but downside should be limited to 0.9200 and 0.9000 should hold.
Gold Ready To Break $1300, Silver Testing 61.8% Fibonacci Retracement, Crude Oil Continued Decline.
Gold Ready to break $1300.
Gold is pushing higher within uptrend channel. Hourly support is located at 1246 (18/05/2017 low). Stronger support is given at 1195 (10/03/2017 low). Expected to show further upside pressures.
In the long-term, the technical structure suggests that there is a growing upside momentum. A break of 1392 (17/03/2014) is necessary ton confirm it, A major support can be found at 1045 (05/02/2010 low).
Silver Testing 61.8% Fibonacci retracement.
Silver declines. Strong support is given at 15.63 (20/12/2017 low). Closest support is given at 16.20 (04/05/2017 low). Key resistance is given at a distance at 19.00 (09/11/2017 high). Expected to push back towards 61.8% Fibonacci retracement around 17.75.
In the long-term, the death cross indicates that further downsides are very likely. Resistance is located at 25.11 (28/08/2013 high). Strong support can be found at 11.75 (20/04/2009).
Crude oil Continued decline.
Crude oil keeps on moving lower after the recent collapse from $52. Support is given at a distance 43.76 (05/05/2017 low). The technical structure suggests further weakness towards 43.76.
In the long-term, crude oil has recovered after its sharp decline last year. However, we consider that further weakness are very likely. Strong support lies at 24.82 (13/11/2002) while resistance can now be found at 55.24 (03/01/2017 high)