
Sample Category Title
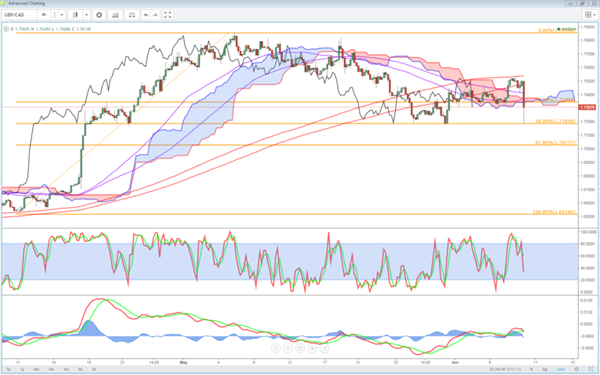
How Far Can GBP Fall?
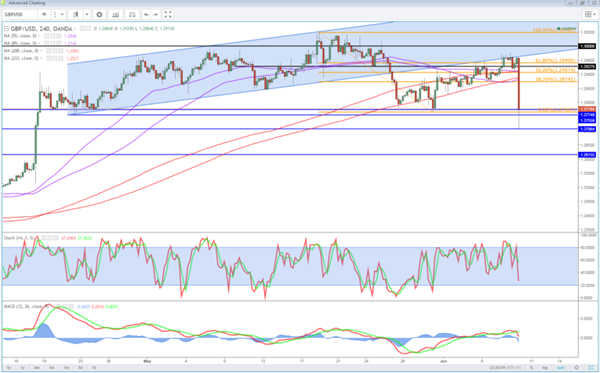
It will be a generation before a UK leader, perhaps any democratic leader, pushes his or her luck with a snap election when the polls show they're in command. Cable is down 230 pips as election results roll in and PM May's calculated gamble increasingly looks like the end of her political career. The latest forecasts show Conservatives win by about 318 seats, which may require negotiations into the weekend for the Tories to achieve a working coalition. 2 new GBP and 1 new EUR Premium trades have been issued. The previous GBPUSD long was stopped out at 1.2700, 5 pips above the session lows.
Theresa May called an election because she had a small majority and was confident she could extend it on a message of strong, stable governance. Instead, she stumbled during a campaign that the public rightly saw as opportunistic and destabilizing.
3450 of 650 seats have been reported so far but if the trends hold and the exit polls are correct, it looks like a managable hung parliament. Or, will Jeremy Corbyn's rebounding Labour Party extend its advances through the night for a possible coalition with SNP and LibDems?
Either way a hung parliament appears certain and that's challenging for the pound. The 230 pip fall to 1.2730 so far doesn't full capture the extent of the newfound uncertainty. The EU wanted to begin Brexit negotiations next month, now we don't even know who they will be negotiating with. And if it is a hung parliament, the negotiators could be changed by another election.
We continue to monitor the 1.2740-1.2760 territory as the crucial support for GBPUSD. One piece of good news for the pound is that the two-year clock that started after Article 50 was initiated will be extended, maybe by years. Or maybe, just maybe, Corbyn decides on calling another referendum and the UK decides to stay. Another piece of good news is that minority governments love to spend and that kind of short-term stimulus could boost growth.
So while it's not as clear and isn't likely to materialize as quickly, this could be a US election redux, especially if Corbyn can cobble together a stable minority that isn't afraid of deficits.
Market Morning Briefing: ECB Trimmed Inflation Expectations Through 2019
STOCKS
Dow, Nikkei and Nifty looks stable for now and could be ranged sideways for a few sessions while Shanghai and Dax look bullish.
Dow (21182.53, +0.04%) is almost stable and could consolidate within 21200-21100 for a couple of sessions.
Dax (12713.58, +0.32%) could re-test levels near 12800-12900 in the coming sessions while above 12600. Near term looks bullish.
Shanghai (3155.62, +0.17%) is trading higher as expected and could move towards 3200 just now before a small corrective dip back to 3125 levels. Overall medium term looks bullish with possible interim corrections.
Nikkei (20063.84, +0.78%) is trading above immediate support near 19840 and while that holds, a few sessions of sideways movement is possible within 20250 and 19800 levels.
Nifty (9647.25, -0.17%) is in a pause mode and is consolidating below 9700 which could possibly extend towards 9620-9600 in the coming sessions. We do not look at levels below 9600 just now and expect a bounce back towards 9700 by end of next week.
COMMODITIES
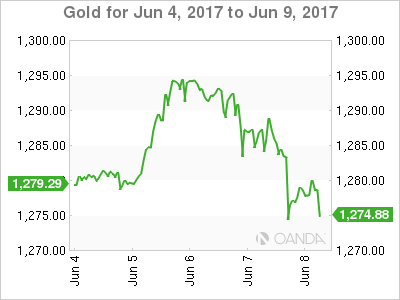
Gold (127.19) has been hurt by the Dollar (97.30) strength and broken below the support of 1275, bringing 1247 to the downside into consideration.
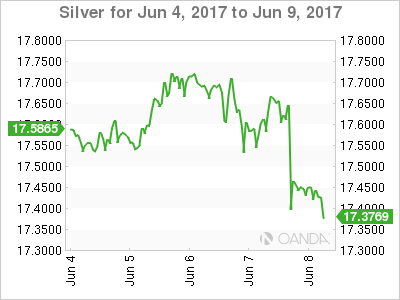
Silver (17.29) has weakened after failing to sustain above 17.50-60 just as expected and now may test 16.91 to the downside in the next couple of sessions.
Copper (2.60) has strengthened considerably but as long as it stays below 2.66, the rise remains suspect As discussed yesterday, only above 2.66, higher resistances of 2.72-80 can come into consideration.
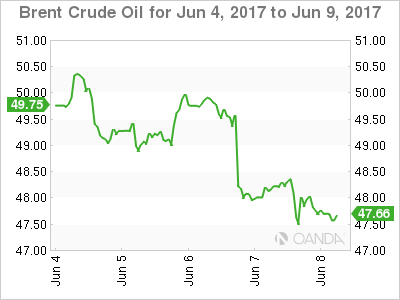
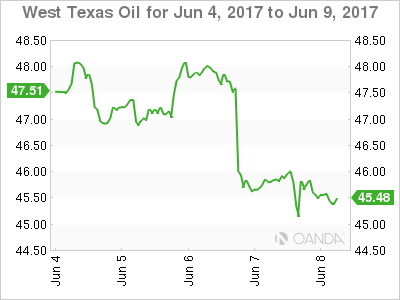
Brent (47.87) and WTI (45.64) are trading just above near term support levels and while the support holds, both could bounce back immediately. WTI could possibly try to test 45.00 before bouncing back towards 47.00 while Brent has already started to move up from support at 47.50 and could now be headed towards 49.00-49.50 in the next 2-3 sessions. Overall crude looks bullish for the near term.
FOREX
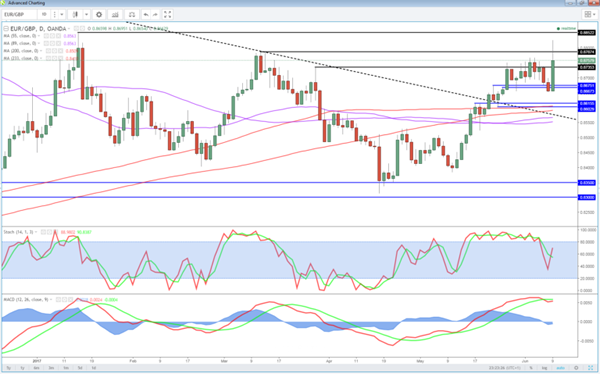
While keeping the rates unchanged as expected, ECB trimmed Inflation expectations through 2019, driving Euro lower. The Comey testament has been brushed off by the investors, boosting Dollar and UK is headed for a hung parliament, weakening the Pound. Overall Dollar strength.
The initial signal of an upside reversal in Dollar Index (97.30) is visible now and it may rise to 97.60-80 in a day or two. A break above 97.80 may fully confirm a near term reversal and open up higher levels of 98.40 and above. The bias turns bullish now with the support of 96.50 holding firm.
Euro (1.1195) has weakened from the higher levels exactly as discussed for the last few days. Technically it may decline further to the support of 1.1125-15 before any bounce can be considered but the German-US 2Yr (-2.08%) keeps the possibility of a recovery still open (Check Interest Rates section). Bias bearish but not with full conviction yet.
Dollar Yen (110.26) has bounced in line with expectations and may rise to 111.20 but as discussed yesterday, to negate the downside risk, it requires a break above 111.70. Till then, the larger trend remains down.
Pound (1.2746) has taken a major hit from the unexpected UK election results. With the initial shock digested, it may either grind in the range of 1.2700-1.2850 for a few sessions or continue the decline towards 1.2600 immediately. It may take one more trading session which is the more probable path.
Aussie (0.7532) remains indifferent to all the global events and untouched even by the general Dollar strength today. It may end the week in the range of 0.7500-0.7600.
Dollar Rupee (64.21) broke the range of 64.30-70 to the downside and now we have to watch crucial Support at 64.10. If that holds, there could be chances of sharp rise to 64.40-50 again. A break below 64.10, on the other hand, could lead to lower levels near 63.90
INTEREST RATES
The US yields are holding well above immediate support levels and could move higher in the near term as mentioned yesterday The 10Yr (2.19%) has moved up by 1bps and could target 2.25% while the 30Yr (2.86%) has moved up from 2.84% yesterday to head towards 2.92% in the near term. The 10-5 Yr (0.44%) may head back to 0.45%.
The Japan 10YR (0.06%) is coming off from immediate resistance and while that holds, could come off towards 0.05% in the near term. On the other hand, the 5Yr (-0.07%) has been rising much sharply in the last few session and looks bullish for the near term.
The German-US 2Yr (-2.08%) could test -2.15% on the downside before bouncing back from there while the German-US 10YR (-1.94%) is trading just above immediate support levels and in case the yield spreads bounce from current levels, it could possibly pull up Euro also along with itself. (Also refer to Forex section above)
The UK-US 10Yr (-1.16%) has come off sharply as expected pulling down the Pound also with it and if the yield spread continues to head towards support near -1.23%, we could see some more downside for the Pound in the coming sessions; else both could bounce back from current levels. (Also refer to Forex section above)
Oil And Precious Metals Ignore The UK’s Mayday Call
Oil bounces along the seafloor bottom overnight as precious metals continue their bullish unwind from earlier in the week, ignoring an emotional U.K. election.
Crude Oil
Both Brent and WTI closed almost unchanged overnight despite both attempting a failed dead cat bounce in the New York session leaving the crude contracts down some 5.0% for the week. Following the king hit from the Crude Inventories number Thursday morning (Singapore time), both contracts have a suspiciously consolidative look about them before more downside as we run into the week's end.
The Baker Hughes Rig Count this evening is unlikely to provide much respite either, and oil will probably have to rely on a weaker U.S. dollar or some headline-driven volatility to pick itself up off the floor.
Brent spot trades at 47.45 in early Asia with resistance at 48.50 and then 50.00. Support is very near at 47.40 with the next level below this the May liquidation low at 46.30.
WTI spot trades at 45.30 with resistance at 46.50 and then 48.20. Support again is very near at 45.00 with a break potentially targeting its May low of 43.50.
Precious Metals
Gold clung on to its uptrend overnight by the skin of its teeth, just managing to hold recent trend line support, this morning at 1274.30. A flat stock market in the U.S. and no new bombshells from ex-FBI Director Comey in Congress seems to have unwound some of the safe haven premia from gold in the last 24 hours.
Looking at gold's price action, the gold price may well have had a significant amount of uncertainty built into it over the week which was given a further boost by a weaker U.S. Dollar initially. Traders may also have taken fright by the failure of gold to breach its April high of 1296.00 this week leaving a technically significant double top now at this level on the charts.
Ahead of the weekend, it would not be surprising to see Asia hedge some weekend risk and for buying to emerge in the session. However, gold may take its cue from Silver as it did yesterday, with the later breaking critical support at 17.5000 overnight which also took out it's 100 and 200-day moving averages. If silver continues to drop to its next support near 17.2000, this may be the straw that breaks gold's back.
This morning Gold trades at 1279.50 with resistance at 1289.00 followed by 1296.00 and then 1300.00, implying the yellow metal has a lot of wood to chop from a technical standpoint. Support is nearby at the 1274.30 level as mentioned above followed by 1270.00 with a break of this level implying a possible move to 1259.00.
GBP Plummets As Exit Polls Suggest No Majority
Who's Going to Have a Worse Night, GBP or Theresa?
The initial exit poll suggest it's been a catastrophic campaign for Theresa May, with the Conservatives on course to fall short of an overall majority having been 20 points in the lead in the polls only a few weeks ago.
Sterling has fallen off a cliff after the initial exit poll. A hung parliament is the worst outcome from a markets perspective as it creates another layer of uncertainty ahead of the Brexit negotiations and chips away at what is already a short timeline to secure a deal for Britain. GBPUSD fell more than 2 cents immediately after the exit poll and looks very vulnerable to further downside.
Now we move onto the results in the coming hours to see whether the exit polls do in fact accurately represent the voting. We should get the first result very soon and should it confirm what we're seeing, it could be another very bad night for GBP.
USD/CAD Canadian Dollar Unchanged Awaiting UK Election Results
The Canadian dollar was almost flat on Thursday trading despite the European Central Bank (ECB) releasing its rate statement and the awaited testimony of former FBI director James Comey before the US Senate Intelligence Committee regarding his meetings with President Donald Trump and the ongoing investigation with members of the Trump administration and Russia ties. In the end the ECB had little to add and only removed language that took off the table further rate cuts as expected as the market is now pricing in a rate hike and tapering of the massive quantitative easing program. In Washington there were few fireworks as Comey was questioned by Senator after Senator adding little in way of details as some of it might be classified or in other cases he had already addressed their questions in his prepared written statement. Markets remain in a tight range awaiting the results of the UK election with a forecasted Conservative win but given the lack of faith in pollsters it will have to be seen to be believed.
The price of oil continue to drop after Wednesday's surprise buildup in US supplies. The fall was smaller than yesterday but geopolitical anxiety did not allow crude to gain a foothold. US producers have ramped up supply to take advantage of higher prices as Organization of the Petroleum Exporting Countries (OPEC) and other major producers agreed to limit supply until March 2018. The US has turned from an importer to an exporter of crude to the point President Trump has suggested America could sell its strategic reserves to help balance the budget.
The Bank of Canada (BoC) delivered its semi-annual Financial System Review on Thursday with a warning to rising consumer debt. The central bank is seeing positive signs of economic strength despite the risks housing prices and high consumer debt pose to the financial system. The Canadian central bank has not modified it monetary policy since cutting rates twice in 2015. The next move is more likely to be a rate hike, but the timing remains uncertain as it depends on how stable is the upward trend of the economy.
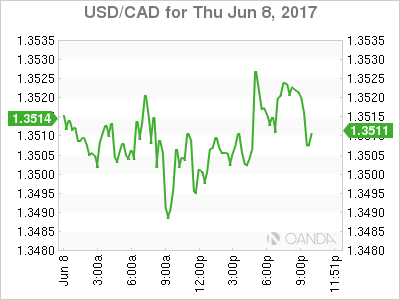
The USD/CAD lost 0.048 in the last 24 hours. The currency pair is trading at 1.3506 after a politically charged trading session. The testimony of James Comes and the ongoing election process in the UK have kept the loonie in a range near the 1.35 price level.
Canadian job data will be released on Friday, June 9 at 8:30 am EDT with a gain of 11,000 positions. A gain of 10,000 or more would validate the Bank of Canada (BoC) estimate of a recovery despite falling oil prices. The unemployment rate is expected to have risen to 6.6 percent as more people are looking to rejoin the workforce.
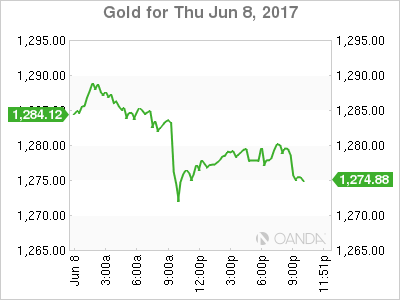
Gold lost 0.657 percent on Thursday. The yellow metal is trading at $1278.67 as the Comey testimony failed to spark a sell off of the US dollar as there was very little new under the sun from the US Senators questions. Gold will continue to be volatile as the UK elections enters its final stretch and if pollsters have called a majority win by the UK Conservative party the metal will be under pressure as risk appetite will be higher.
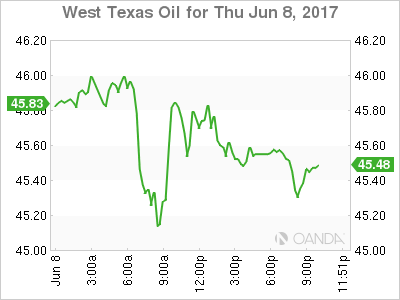
Oil lost 0.37 percent in the last 24 hours. The price of West Texas Intermediate is trading at $45.46 in the aftermath of the surprise buildup of weekly US inventories. Oil inventories rose 3.3 millions barrels when the forecast called for a drop of 3.5 million barrels. Gasoline inventories also gained as part of a worrisome trend that has seen demand stagnate ahead of the US driving season and putting more pressure on oil prices.
Increasing production from US shale producers has all but offset the best efforts from the Organization of the Petroleum Exporting Countries (OPEC) and other major producers that banded together to extend the production cut agreement until March 2018. The diplomatic situation with Qatar has also raised concerns on how solid is the group as internal rifts are reemerging.
Market events to watch this week:
Friday, Jun 9
4:30am GBP Manufacturing Production m/m
8:30am CAD Employment Change
8:30am CAD Unemployment Rate
CRUDE OIL – Sells Off, Looks To Weaken Further
CRUDE OIL - The commodity continues to retain its downside pressure selling off strongly on Wednesday. This has opened the door for more weakness. On the downside, support resides at the 45.00 level where a break will expose the 44.50 level. A cut through here will set the stage for a run at the 44.00 level. Further down, support resides at the 43.50 level. On the upside, resistance resides at the 46.00 level. Further out, resistance comes in at the 46.50 level. A break above here will aim at the 47.00 level and then the 47.50 level followed by the 48.00 level. All in all, CRUDE OIL remains biased to the downside.
GBP/USD Election Price Action: Even In Times Of Panic Selling, Forex Markets Follow Structure.
Another day, another political event and another forex market sell off.
I've marked the Brexit bloodbath on the below GBP/USD chart for comparison, but I wanted to focus on THE WAY that price sold off.
GBP/USD Daily:
After a huge fall like this, it's easy to just say that markets lost control within whipsawing price action, before dropping. When in reality, this couldn't be further from what actually happened.
Even in times of market panic, the selling is always done in a structured, technical manner. Let's take a look at what I'm talking about.
GBP/USD 15 Minute:
Having zoomed into an intraday chart, you can see just how structured the selling was. Price hit higher time frame resistance and heading into the vote, failed to make a new higher high. From here price then retested short term support and resistance and after retesting this level price was subsequently destroyed. This is the exact same price structure that we look for on the blog every single day.
Markets are a reflection of human behaviour represented by price. Even in times of panic selling, humans and therefore markets, follow structure!
ECB Review: Slightly Less Dovish Forward Guidance
The ECB kept policy rates and its QE programme unchanged but changed forward guidance on policy rates as it no longer expects these to go to 'lower levels'. The rest of the forward guidance was left unchanged implying the ECB now expects policy rates "to remain at their present levels for an extended period of time, and well past the horizon of the net asset purchases". Regarding the QE purchases, the ECB continued to have an easing bias as it communicated that it stands ready to increase QE in terms of size and/or duration.
According to President Mario Draghi, the ECB changed its forward guidance on policy rates as the deflation risks have disappeared. However, this was despite the ECB lowering its inflation projection throughout its entire forecast horizon. In particular, the inflation forecast for 2018 was lowered to 1.3% from 1.6% previously, while the forecast for 2019 was revised down by 0.1pp to 1.6% bringing it even further away from the 2% target.
The reduced deflation risk should instead mainly reflect a stronger economic outlook. The ECB now characterises the risks to the economic outlook as 'broadly balanced' while it revised its GDP growth projection upwards by 0.1pp in 2017, 2018 and 2019. That said, Draghi again emphasised that the economic expansion has to feed through to prices and, while employment was increasing, he argued the ECB needs to be patient to see if the underlying price pressure picks up as many jobs are created within low quality sectors and also are part-time positions.
Crucially, Draghi said underlying inflation is expected to stay where it is. Related to this, the ECB revised its core inflation projection slightly lower for 2018 and 2019 and argued "measures of underlying inflation remain low and have yet to show convincing signs of a pick-up, as unutilised resources are still weighing on domestic price and wage formation." In our view, the ECB is still too optimistic in its core inflation projection and further downward revisions should warrant a continuation of the accommodative monetary policy.
We still expect the ECB to continue its QE programme next year but to reduce its purchases to EUR40bn per month starting from January 2018 and continuing for at least six months. In our view, it is still premature to discuss rate hikes from the ECB.
Fixed income: No prelude to a major sell-off
We do not see today's ECB meeting as a prelude to a major sell-off in the European fixed income market despite the removal of "or lower" from the introductory statement and the upward revisions to the growth forecasts. In fact, neither should come as a major surprise to the market given the ongoing economic recovery and the reduced risk of outright deflation. For the fixed income market it is pivotal that the change to the introductory statement was mainly due to the improved economic outlook and not an improved inflation outlook given the significant downward revisions to the 2018 inflation outlook in particular. We also note that Draghi mentioned that the ECB still expects very muted wage growth in the euro area. In our view Draghi today managed to convince the market that inflation is still 'the only' mandate for the ECB.
Hence, we do not expect today's meeting to change the outlook for EUR rates and yields for 2017. We argue that there are several supportive factors for the European bond market for the next six months. We discuss that in detail in Strategy: Low yield environment intact, published on 1 June 2017.
We generally recommend positioning for further performance for periphery bond markets and to take advantage of the relatively steep curves in the 5Y segment in the periphery bond markets. Today's strong performance by periphery markets underlines that the market is increasingly betting on an extension of the PSPP programme into 2018. For more, see the latest issue of Government Bonds Weekly that we published 2 June.

FX: too early for ECB to unlock upside EUR potential
It was down and back again for EUR/USD following today's meeting with the cross briefly dipping below 1.12 but now back in the 1.1220 area. The hawkish amendments in the statement were indeed balanced by the significant downward revisions to inflation, suggesting to the FX market that rate hikes are still very far off as indeed the postponement of a first hike hints. We have previously stressed the importance of rates communication for the euro, i.e. the 'reverse hot potato' effect coming into play with the possibility of sending EUR crosses higher on a sustained basis. However, today's message from the ECB is not in our view going to be a key catalyst for further EUR/USD upside for three reasons.
First, ECB rate hikes will be deemed far away by the market as long as euro area inflation struggles to tick higher – and a first rate hike needs to be eyed in order for the upside potential in notably EUR/USD from fundamental factors to be unlocked on a larger scale in our view (our medium-term fundamental estimate is 1.26). This should be a story for late H2. Second, speculative positioning has turned net long the single currency and likely some longs were liquidated today, driving part of the initial drop in EUR/USD. If cyclical momentum in the eurozone wears off in the coming months the risk is that sentiment could reverse somewhat and fuel EUR selling again. Third, a Fed that will likely at the meeting next week confirm its determinedness to move on with hikes and balance-sheet reduction down the road could lead markets to reassess the rather soft pricing of the fed funds rate currently in place. As a result, USD strength could return temporarily in the summer.
We remain tactically short EUR/USD in the Danske FX Trading Portfolio - see Danske FX Trading Portfolio: Sell EUR/USD for short-term dip on June reality check - and maintain our call for a summer dip in the cross. We continue to project an uptick in the pair in 6-12M targeting 1.16 in one year's time. The result of the UK general election today will be the next focal point for FX markets but is unlikely to have much impact on EUR/USD.
ECB's updated projections
The ECB lowered its headline inflation projections considerably for 2018 and slightly for 2019. The revision was mainly due to the oil price, but the core projection was also lowered.
The ECB kept its 2017 core inflation forecast unchanged but lowered it by 0.1pp in 2018 and 2019. Despite the modest revision, the ECB's projection is still too optimistic in our view.
The ECB did not change its wage forecast for 2018 and 2019 and in our view, the projection remains hopeful. Without rising wages it will be very difficult to see higher underlying prices.
British Pound Edges Lower on Election Day
The British pound is trading quietly in the Thursday session. In North American trade, GBP/USD is trading at 1.2930. It's Election Day in the United Kingdom, and there are no British economic events. In the US, unemployment claims dipped to 245 thousand, but was higher than the estimate of 241 thousand. On Friday, the UK releases Manufacturing Production, which is expected to rebound and post a gain of 0.8%.
It's Election Day in the UK, as an election campaign marred by deadly terrorist attacks has ended. What started out as a cakewalk for Theresa May's Conservatives has turned into a fiercely fought campaign, as May's comfortable lead in the polls has been seriously eroded by the rejuvenated Labour party, lead by Jeremy Corbyn. May called a snap election just six weeks ago, and Brexit was supposed to be the primary issue facing voters. However, terror attacks in Manchester and London have left voters fearful about their safety, and the fight against terror has become the number one issue in the campaign. It remains unclear what the political landscape will look like on Friday morning. May remains ahead in the opinion polls, but the key, unanswered question is will she garner enough seats to win a majority. The markets have priced in a May victory, so the pound could bump a notch higher if she gets her majority. If not, May will only be able to govern at the grace of a hostile opposition. Such a scenario would seriously hinder May in upcoming Brexit negotiations with the European Union. If no party wins a majority, there is the possibility of Labor and the Liberal Democrats joining forces to form a coalition government, leaving the Conservatives in opposition. This would create even more uncertainty around Brexit and the pound could respond with sharp losses.
Washington is buzzing with excitement, as former FBI director James Comey is currently testifying before the Senate Intelligence Committee. Comey started off by saying that he was not specifically asked by President Trump to close an investigation into Trump's alleged ties with Moscow, so it is unlikely that his testimony will be the "smoking gun" that leads to charges of obstruction of justice against Trump. Still, Comey's testimony could raise troubling questions about Trump's conduct, and will only complicate matters for the beleaguered Trump administration. Investors are growing more skeptical that Trump, who seems to be spending most of his time in damage control mode, will be able to deliver on key promises, and may come to view the president as a lame duck, just months into his presidency. This kind of sentiment could weigh on the US dollar.
Dollar Climbs Above 110 Yen on Soft Japanese GDP
USD/JPY has posted slight losses in the Thursday session. In North American trade, the pair is trading just above the 110 level. On the release front, Japanese Final GDP disappointed, as the reading of 0.3% missed the forecast of 0.6%. Japan's current account surplus improved to JPY 1.81 trillion, well above the forecast of JPY 1.62 trillion. In the US, unemployment claims dipped to 245 thousand, higher than the estimate of 241 thousand.
It was report card day for the Japanese economy, but the results were disappointing. First quarter GDP was revised downwards to 0.3%, compared to 0.5% in the preliminary GDP report. At the same time, the economy has posted growth for five consecutive quarters – the first time that has occurred in over 10 years. Japan has benefited from a stronger global economy, notably the manufacturing and export sectors. However, domestic consumption remains sluggish, and household spending contracted 1.4% on year in April. The Bank of Japan will hold a policy meeting on June 15-16, and is expected to maintain its ultra-loose monetary stance in order to prop up inflation and domestic demand.
Japan's economy continues to improve, and stronger numbers have buoyed the yen. Wage growth posted a solid gain of 0.5% in April, rebounding from a 0.3% decline in the previous release. The dollar has dropped below the 110 level for the first time since April 25. Stronger global demand has boosted the economy, notably the export and manufacturing sectors. The markets are predicting that Final GDP will be revised upwards to 0.6%, better than the 0.5% gain in Preliminary GDP. If Final GDP matches or beat its estimate, the yen rally could continue.
In Washington, the hottest ticket in town is the Senate Intelligence Committee hearing of former FBI director James Comey. On Wednesday, the committee released a written statement from Comey which discussed his meeting with President Trump. There are accusations that Trump asked Comey to close an investigation into Trump's alleged ties with Moscow, and the committee will grill Comey on this key issue. The media is in a feeding frenzy ahead of Comey's testimony, but it is doubtful that his testimony will be the "smoking gun" that leads to charges of obstruction of justice against President Trump. At the same time, Comey's testimony could complicate matters for a beleaguered Trump administration, and any dramatic revelations could shake up the markets. Investors are growing more skeptical that Trump, who seems to be spending most of his time in damage control mode, will be able to deliver on key campaign planks, such as tax reform. If Trump appears even more vulnerable after Comey's day on the stand, investors could flock to the safe-haven Japanese currency.