
Sample Category Title
Trade Idea Update: EUR/USD – Stand aside
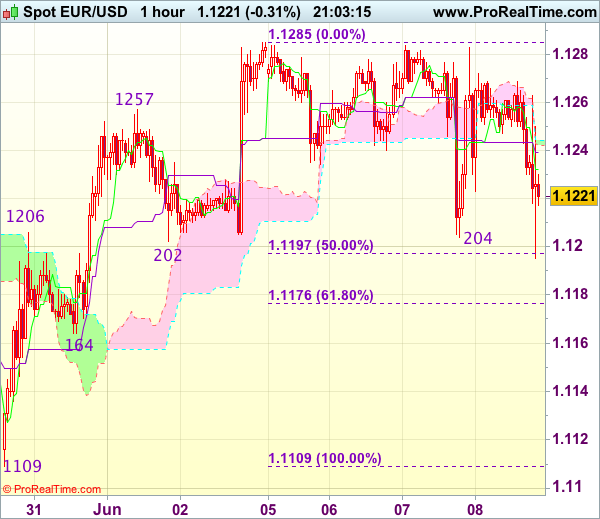
EUR/USD - 1.1213
New strategy :
Stand aside
Position : -
Target : -
Stop : -
Failure to extend early rebound from 1.1204 and the subsequent retreat after faltering below strong resistance at 1.1285 suggest further consolidation would be seen and weakness to 1.1195 is likely, however, break of indicated support 1.1164 is needed to confirm top has been formed at 1.1285, bring subsequent decline to 1.1145-50 first.
In view of this, would not chase this fall here and would be prudent to stand aside in the meantime. Above 1.1245-50 would bring another bounce to 1.1270 but only break of said resistance at 1.1285 would revive bullishness and confirm recent upmove has resumed and extend further gain to previous chart resistance at 1.1300, break there would encourage for headway to 1.1340-45 and later towards chart point at 1.1366.
USD/JPY Mid-Day Outlook
Daily Pivots: (S1) 108.91; (P) 109.71; (R1) 110.20; More...
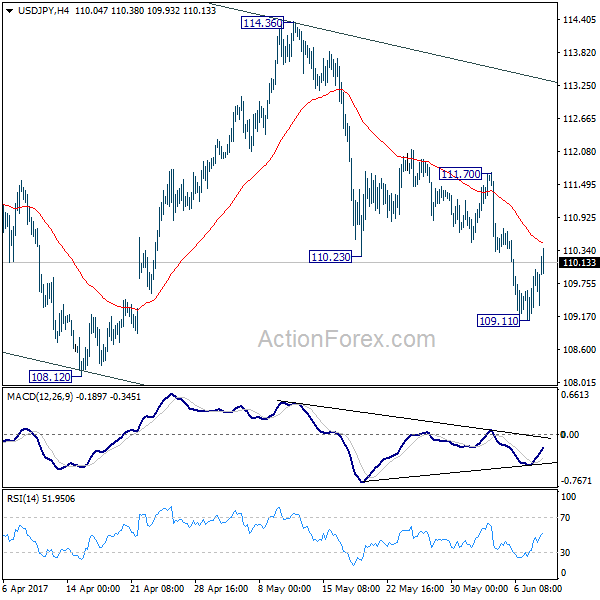
USD/JPY's recovery from 109.11 extends higher but it's kept well below 111.70 resistance. Intraday bias remains neutral at this point. Another fall is still expected as long as 111.70 resistance holds. Below 109.11 will target 108.12 low first. Break will extend whole decline from 118.65 to 61.8% retracement of 98.97 to 118.65 at 106.48. As such decline is seen as a correction, we'll looking for bottoming signal around 106.48. Meanwhile, break of 110.70 will suggest near term reversal and turn bias back to the upside for 114.36 resistance instead.
In the bigger picture, price actions from 125.85 high are seen as a corrective pattern. It's uncertain whether it's completed yet. But in case of another fall, downside should be contained by 61.8% retracement of 75.56 to 125.85 at 94.77 to bring rebound. Overall, rise from 75.56 is still expected to resume later after the correction from 125.85 completes.

USD/CHF Mid-Day Outlook
Daily Pivots: (S1) 0.9615; (P) 0.9646; (R1) 0.9676; More.....
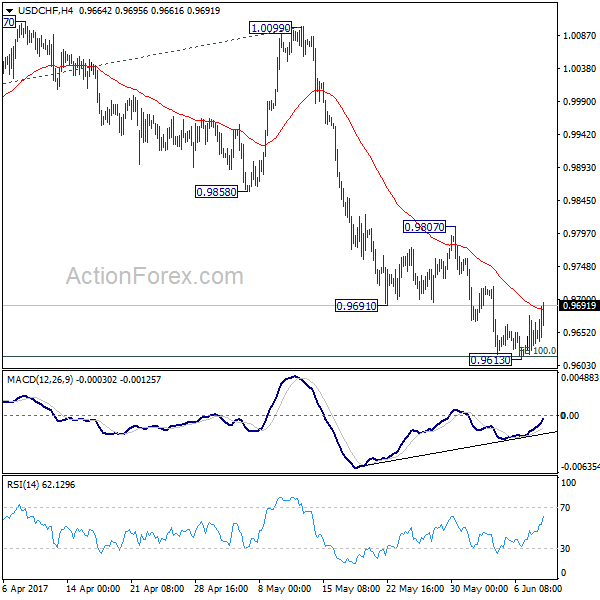
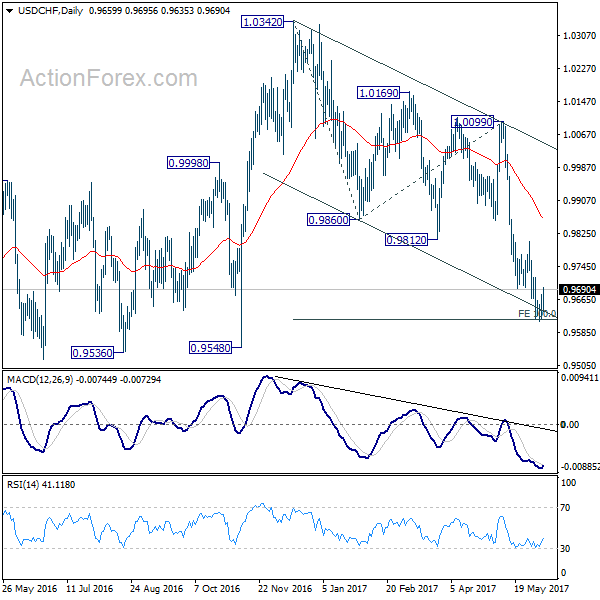
USD/CHF's recovery from 0.9613 continues in early US session but it's staying well below 0.9807 resistance so far. Intraday bias remains neutral for the moment. Deeper fall is expected with 0.9807 intact. When decline from 1.0342 resumes, we'd tart to look for bottoming signal again as it approaches 0.9443 key support level. However, considering bullish convergence condition in 4 hour MACD, break of 0.9807 will indicate near term reversal and turn outlook bullish for 1.0099 resistance next.
In the bigger picture, USD/CHF is still bounded in medium term range of 0.9443/1.0342 for the moment. Consolidative trading would likely continue and medium term outlook remains neutral. Break of 1.0342 key resistance is needed to confirm underlying bullish momentum in the pair. Meanwhile, downside attempts should be contained by 0.9443 key support level. However, sustained break of 0.9443 will carry larger bearish implication and target 0.9 handle.
GBP/USD Mid-Day Outlook
Daily Pivots: (S1) 1.2908; (P) 1.2937; (R1) 1.2988; More...
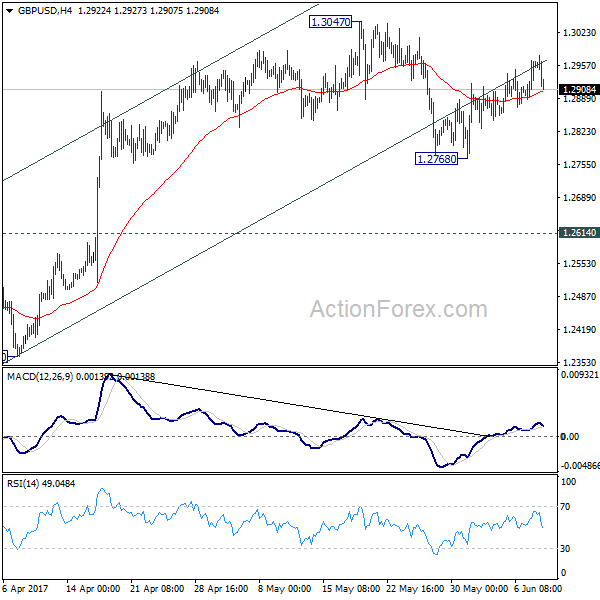
Intraday bias in GBP/USD remains neutral for the moment. On the downside, below 1.2768 minor support will extend the fall from 1.3047 to 1.2614 resistance turned support. Decisive break there should confirm completion of the consolidation pattern from 1.1946 and resume the larger down trend through this low. On the upside, break of 1.3047 will extend the correction with another rise towards 1.3444 key resistance.
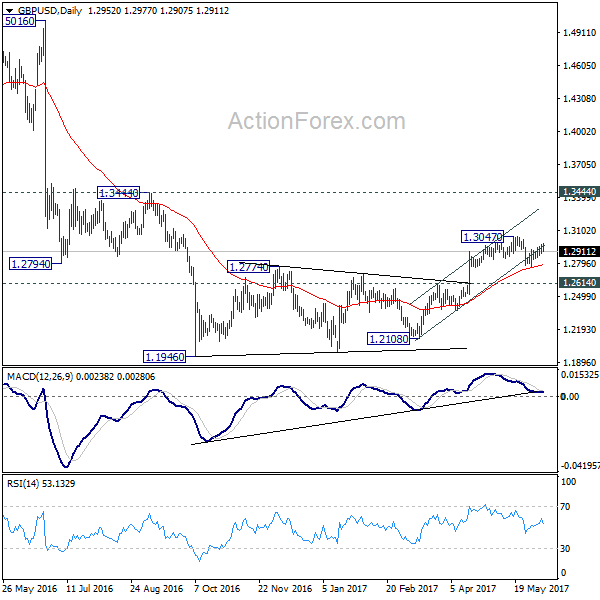
In the bigger picture, fall from 1.7190 is seen as part of the down trend from 2.1161. The rejection from 55 week EMA is maintaining bearishness in the pair. Also, at this point, as long as 1.3444 resistance holds, fall from 1.7190 is still expected to continue. Break of above mentioned 1.2614 support will affirm this bearish case.
Canadian Housing Starts Fell in May as a Welcome Cooling Trend Begins to Set in
Highlights:
- Housing starts fell to 195k annualized units in May from 213k in April.
- Residential investment is set to be a small drag on growth in Q2 following a double digit gain in Q1.
- Ontario and Quebec recorded sizeable declines but were still higher year-to-date relative to 2016. The Prairies saw an increase in May as homebuilding activity continues to pick up from last year.
- Both single and multi-unit starts declined in May. On a trend basis, single unit starts edged down from a multi-year high while multis continued to pick up.
- Building permits edged down to 200k in April, and on a trend basis, narrowed the gap between permit issuance and starts. That implies less upside risk to starts going forward.
Our Take:
Five months into 2017 and Canadian housing starts are still running at the strongest pace in five years, but it appears we are entering a cooling phase in the housing market that should see homebuilding activity moderate over the second half of the year. We expect that trend will be driven by Ontario, where starts are already beginning to retrace Q1's multi-decade high. A decline in Toronto accounted for much of the province's drop in May. It seems a bit early to attribute this to regulatory changes that began to cool the city's hot resale market in April. Starts usually lag resale activity, so we think the true regulatory-induced slowdown will take hold later this year. Offset is coming from improving activity in the Prairie provinces as oil-producing regions continue to recover from a downturn over the last two years. And while homebuilding in British Columbia has slowed relative to last year's torrid pace, there is risk that starts regain momentum alongside a nascent rebound in the province's resale market. On balance though, we expect worsening affordability and housing policy changes will contribute to a slowdown at the national level. This will result in a modest drag on GDP growth from the residential sector, which has contributed positively in all but one of the past twelve quarters.
September Eyed as Careful ECB Remains Balanced
What was shaping up to be a potentially lively ECB announcement and press conference following yesterday's draft staff projections leak, instead ended up being another relatively dull affair, despite the leak itself turning out to have some credibility.
The central bank made every effort to retain a relatively neutral stance overall, balancing any hawkish or dovish statement with something roughly equal and opposite. The fact that it no longer expects interest rates to remain at present "or lower" levels is a clear deliberate signal that policy makers are gradually becoming more hawkish and yet it also claimed that they could increase the asset purchase program or continue until the end of 2017, or beyond, if necessary. Equally, the ECB did, as reported yesterday, raise growth and lower inflation forecasts but put the latter down to oil price movements. It was the change in inflation expectations that triggered yesterday's selling and triggered some weakness today – alongside the removal of "or lower" – but overall, the message was broadly neutral.
EURUSD fell quite hard following the statement and in response to the inflation forecasts but did recover after finding strong support around 1.12, a level which roughly represents the low from yesterday, last Friday and last Thursday. A proper break through this level would be quite significant, possibly triggering a move back towards the bottom of the channel.
The result of all of this is that I still expect the ECB to announce further reductions in bond buying once the current expires at the end of this year, while hinting at such a move in September. The euro may be a little weaker on the back of the meeting at the moment and did see some volatility, but broadly speaking we're no wiser than we were prior to the meeting and expectations remain the same. A careful and considered performance as ever from Mr Draghi.
Elliott Wave Analysis: Silver impulsively Increasing In Price
Silver is clearly bullish since start of May and is now trading in red wave 3). Current rally away from wave 2) correction is a sign that bulls are maintaing control and that more gains may follow in days ahead. We see Fibonacci ratio of 261.8 as a projection target for the unfolding wave 3). After wave 3) unfolds a new pullback into wave 4) may follow.
Silver, 4H
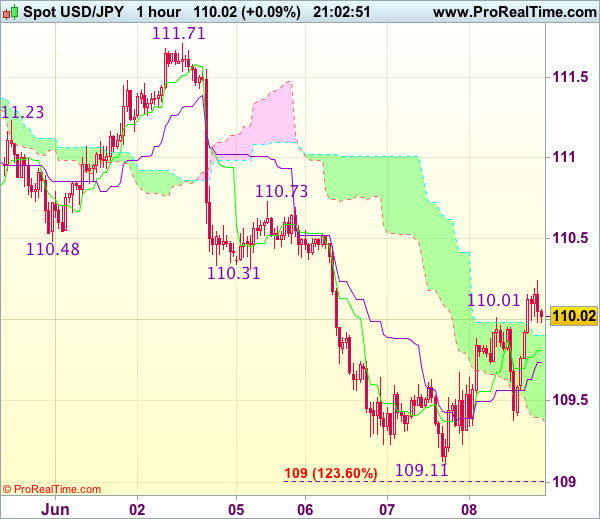
Trade Idea Update: USD/JPY – Hold short entered at 110.20
USD/JPY - 110.23
Original strategy :
Sold at 110.20, Target: 109.20, Stop: 110.55
Position : - Short at 110.20
Target : - 109.20
Stop : - 110.55
New strategy :
Hold short entered at at 110.20, Target: 109.20, Stop: 110.55
Position : - Short at 110.20
Target : - 109.20
Stop : - 110.55
Although the greenback found renewed buying interest at 109.38 and has staged a strong rebound, as this move is viewed as retracement of recent decline, reckon upside would be limited to previous support at 110.31 and bring retreat later, below said support at 109.38 would signal an intra-day top is formed, bring another fall towards this week’s low at 109.11 which is likely to hold on first testing.
In view of this, we are holding on to our short position entered at 110.20. Above 110.50 would defer and suggest low is formed instead, bring a stronger rebound to 110.60 but break of resistance at 110.73 is needed to add credence to this view.
Market Concerns over Uncertain Outcome Drives GBP/USD Lower
GBP/USD has rallied around 3.14% since Theresa May announced a snap general election, as markets largely priced in a Tory victory.
GBP/USD has been trading above the downside uptrend line support since May 31st.
Today is the market-focused UK general election.
The Tories are expected to remain in power, however, now it is hard to predict to what extent. Recent YouGov forecasts indicate the Tories are likely to win less than the current number of seats they hold.
This morning, in early European session, GBP/USD edged up and was trading in a range between 1.2950 – 1.2980.
However, it was followed by a correction in the afternoon session, and the increased bearish momentum is currently testing the uptrend line support on increased market concerns.
If the election result turns out to be disappointing, it will likely lead to a sharp fall in GBP and test the significant psychological support line at 1.2800. If it is broken, the bears will likely further test the next psychological support at 1.2700.
Conversely, if the Tories increase their majority notably it will likely ease market concerns and lead to GBP rising.
The resistance level is at 1.3000 followed by 1.3050, 1.3100 and 1.3200.
The support line is at 1.2900 followed by 1.2800 and 1.2700.
Different results will lead to different market reactions. Be aware that GBP crosses are likely to be volatile before and after the release of the election outcome.
CAC Flat as ECB Maintains Rates, Drops Guidance
The CAC index has ticked higher in the Thursday session. Currently, the CAC is at 5268.00 points. On the release front, there were no surprises from the ECB, which held rates at 0.00%. This will be followed by ECB President Mario Draghi's press conference. Elsewhere, France's trade deficit edged up to EUR 5.5 billion, beating the forecast of a EUR 5.9 billion deficit. Eurozone Revised GDP, improved to 0.6%, edging above the estimate of 0.5%.
As expected, the ECB maintained interest rates at 0.00%, where they have pegged since March 2016. The big story from the ECB was that it rate statement dropped its guidance on rate cuts, saying that rates could remain at current levels for an extended period. Previous rate statements had said that interest rates could go lower, so the markets may take the rate statement as a message that the ECB has taken a step closer to winding up its stimulus program. Under this scheme, the ECB is purchasing EUR 60 billion in assets/mth, until December. If economic numbers improve and inflation moves higher, the central bank could taper the purchases or opt to wind up the program ahead of schedule. There were concerns in the markets on Wednesday that the ECB might lower its inflation forecast, so the hawkish rate statement will no doubt please investors and could send the CAC to higher levels.
French President Emmanuel Macron won the presidential election in convincing style, and he remains firmly in the driver seat, ahead of the first round of parliamentary elections on Sunday. Opinion polls are showing that Macron's LREM party, which is barely one year old, has 30% of votes, with the conservative Republicans trailing at 22%. The polls, which were quite accurate in last month's presidential election, are predicting that Macron will win a convincing majority in parliament. Macron, a strong supporter of the European Union, has a pro-business agenda, and wants to streamline government and improve the country's productivity. A cooperative parliament would enable Macron to implement his pro-business agenda, and the French stock market will likely head higher if Macron does well at the ballot box.
Washington is buzzing with excitement, as the former FBI director James Comey will testify before the Senate Intelligence Committee on Thursday. The committee released a written statement from Comey on Wednesday, which discussed his meeting with President Trump. There are accusations that Trump asked Comey to close an investigation into Trump's alleged ties with Moscow, and the committee will grill Comey on this key issue. The media is in a feeding frenzy ahead of Comey's testimony, but unless Comey drops a bombshell, it's unlikely that his testimony will be the "smoking gun" that leads to charges of obstruction of justice against President Trump. At the same time, Comey's testimony could complicate matters for a beleaguered Trump administration, and any dramatic revelations could shake up the markets. Investors are growing more skeptical that Trump, who seems to be spending most of his time in damage control mode, will be able to deliver on key promises, and may come to view the president as a lame duck, just months into his presidency.