Sample Category Title
Trade Idea: AUD/USD – Buy at 0.7500
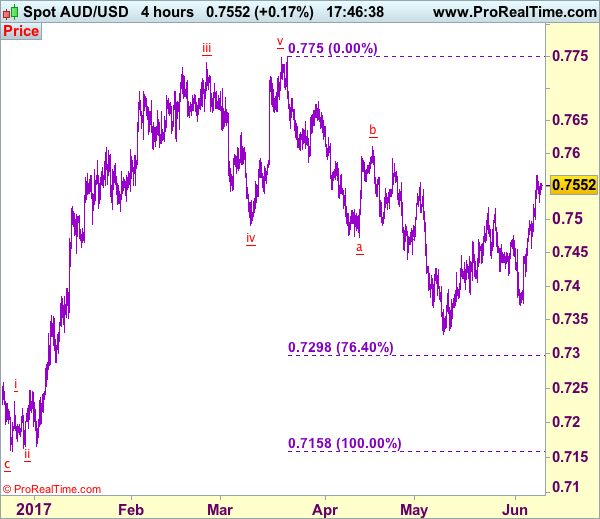
AUD/USD – 0.7547
Recent wave: Wave 5 ended at 1.1081 and major correction has commenced for fall to 0.7000 and then towards 0.6500-10
Trend: Near term down
Original strategy :
Buy at 0.7500, Target: 0.7650, Stop: 0.7440
Position: -
Target: -
Stop: -
New strategy :
Buy at 0.7500, Target: 0.7650, Stop: 0.7440
Position: -
Target: -
Stop:-
As aussie has eased after rising to 0.7567 yesterday, suggesting consolidation below this level would be seen and pullback to previous resistance at 0.7518 is likely, however,r reckon 0.7500 would limit downside and bring another rise later, above said resistance would extend the rise from 0.7329 low towards 0.7592, then test of resistance at 0.7611 but break of latter level is needed add credence to this bullish count and encourage for subsequent upmove towards resistance at 0.7680 but price should falter below chart point at 0.7750.
In view of this, we are looking to buy aussie on dips as 0.7500 should limit downside and bring another rise. Below support at 0.7457 would abort and suggest top is possibly formed, bring weakness to 0.7415-20 but price should stay well above key support at 0.7372, bring another rebound later.
On the 4-hour chart, the move from 0.8066 is the wave 5 with i: 0.8860, ii: 0.8315, wave iii is an extended move ended at 1.0183, iv: 0.9706 and wave v has ended at 1.1081 (also the top of entire wave 5). The subsequent selloff is the major correction which is unfolding as ABC-X-ABC and 2nd A leg has ended at 0.8848, followed by a-b-c wave B which ended at 0.9758, hence, 2nd C wave is now in progress and indicated downside target at 0.7000 and 0.6950 had been met, so further fall to 0.6710-20 cannot be ruled out.
Swiss CPI Surprises To The Upside, ECB And UK Election In Focus
Upside surprise in Swiss data
The publication of the latest batch of economic data from Switzerland went largely unnoticed as investors await impatiently the results of the UK general election and Mario Draghi’s press conference later this afternoon. The EUR/CHF was treading water above the 1.0850 threshold, while USD/CHF stabilised at around 0.9650.
The unemployment rate eased to 3.2% (seasonally adjusted) in May, beating median forecast of 3.3%, while the previous month’s figure was downwardly revised to 3.2%. Investors also got a positive surprise on the inflation front as the headline measure printed at 0.5% y/y, well above estimates of 0.3%.
However, the HICP measure, which allows to compare inflation pressure with that of its European neighbours, shrunk 0.2% m/m in the previous month. On a year-over-year basis, the indicator eased to 0.4%, down from 0.7% in April. There is no reason to worry as core inflation continued to accelerate in May, highlighting the negative effect of the most volatile components, especially petroleum products.
We expect the economic conditions in Switzerland to continue to improve along with the European economy. However, upside pressures on the Swiss franc will take time to dissipate as investors are looking for sustained improvement in the EU before turning their back on the Swiss currency.
ECB meeting: markets expect hints of normalization of the monetary policy
The euro is trading mixed ahead of the ECB meeting today. The European Central Bank is expected to cut its inflation forecast for 2019. Indeed the CPI should, according to an official European report, fall to 1.5% within the next three years while growth should remain below 2%.
In addition, markets are now waiting for hints about the future of the monetary policy. The massive easing did not yet have the expected results. Concerns are also from German Chancellor Angela Merkel and also from Dutch officials. Recently at the end of a meeting with the Dutch parliament, Draghi was offered a plastic tulip to remind of bubble concern.
Today, the rates are not likely to be changed. The press conference will be widely followed. It should have a positive impact on the single currency as we believe that we are approaching towards an inflexion point regarding monetary policy.
Trade the risk recovery on strong China data
The headline events have drowned out most everything else. Even before the prime time events of today, the former FBI Director James Comey's pre-prepared statement, despite providing no new revelations, stole the news cycle from more investment critical news.
In the background Chinese exports and imports both increased more than anticipated. China’s May trade balance printed 281.6bn CNY against 324.1bn CNY expected. Exports increased 8.7% y/y vs. 7.2% expected while imports rose 14.8% y/y vs. 8.3% expected.
Interestingly import growth was driven by “other imports” not commodities which suggest a correction next month. That said the solid read offsets some dire predictions of a sharp economic slowdown and due to mixed recent data is less probable.
The read should also provide a temporary backstop for risk sentiment. We agree the recent surge in volatility has provided a bit of a white knuckle ride yet we remain confident that as the news cycle shifts the good fundamental environment will drive EM prices higher. We sell JPY against EM on the back of Japan’s weak -0.3% 1Q GDP release.
BoJ Kuroda has been increasingly pressured by hawkish politicians to acknowledge the strong economic data and outline an exit strategy. However, today’s disappointing read provides the BoJ some cushion to delay any shift in policy. USDJPY rebound will be challenged at 110.40 resistance.
UK General Election: Let The Show Begin
Today, all eyes will be on the UK General Election. Even though the Conservatives have lost some of their poll-lead recently, they are still expected to secure 43% of the vote, with Labour tracking behind them at 36%. Since a Conservative victory is widely anticipated, if this is indeed the case, market focus may be on how big of a majority the party secures in the House of Commons.
A strong showing that gives them a large majority could prove positive for sterling, on the grounds that PM May could strengthen her hand in the Brexit negotiations with the increased support she will gain. That said, given sterling's sharp rally after May announced the election, most of the good news may be priced in already. Thus, we believe that any upside in the pound is unlikely to be massive. GBP/JPY bulls may take the opportunity to extend yesterday's rally and perhaps drive the battle above the resistance of 143.00 (R1), and the downtrend line taken from the peak of the 10th of May. Such a break could initially aim for our next resistance of 144.00 (R2).
The surprise here and thus the risk for sterling, would be a poor showing by the Conservatives, which leaves them with only a marginal majority in Parliament. In that case, the pound may come under selling interest and GBP/JPY may fall below 141.90 (S1), perhaps targeting the 140.70 (S1) support, marked by yesterday's low.
The worst-case scenario is no majority at all. This implies the Conservatives would need to form a coalition with another party, or govern with a minority. In both of these scenarios, Theresa May could lose a lot of her negotiating power. Therefore, we expect GBP/JPY to tumble below the round number of 140.00 (S3) in this case, something that may pave the way for the 138.00 zone.
ECB meeting: Too soon to change tune?
In Eurozone, the main event will be the highly-anticipated ECB policy gathering. With no expectations for any change in policy, market focus will be on whether the Bank will shift to a less dovish bias. Media reports suggest policymakers will likely indicate that the risks surrounding the growth outlook are no longer tilted to the downside but are instead “broadly balanced”. These reports also suggest officials will discuss whether they should drop some dovish aspects of their forward guidance- that QE can be expanded and that rates can be reduced further if needed.
We share the view for an upgrade in the growth assessment, but we think it is too early for the ECB to alter its dovish forward guidance. A rapid change in language could be over-interpreted by markets as a preliminary hint for tapering, which may result in a sharp appreciation of the euro as well as a spike higher in euro-area bond yields. We don't expect the ECB to risk something like that, especially since it is not clear whether the recent upswing in the core inflation rate is self-sustaining and durable, as Draghi recently pointed out.
Draghi also noted that an extraordinary amount of monetary policy support is still needed, including through the use of the Bank's forward guidance. Unchanged guidance may come as a disappointment for investors looking for such hawkish changes and thereby, lead to a pullback in the euro. EUR/USD may retreat for another test near 1.1200 (S1), where a break could aim for the next support of 1.1160 (S2). Nevertheless, given that the price structure still suggests a short-term uptrend, we would tread any setback that stays limited above the uptrend line taken from the low of the 17th of April as a correction.
Comey's testimony: Smoking gun or non-event?
Last but not least, in the US, former FBI Director James Comey will testify before Congress. The testimony will likely center around whether President Trump attempted to influence an FBI investigation regarding ties between Trump's prior advisor Michael Flynn and Russia. Markets may pay attention to this event as it could hold implications for Trump's tax-reform agenda.
If Comey confirms Trump asked him to drop the investigation, we could see renewed political turmoil in Washington D.C. Investors could begin to question whether Trump can be impeached and consequently, whether he can implement the reforms he has promised amid a political maelstrom. Such concerns could weigh on the dollar. Comey's prepared remarks suggest that he is unlikely to do so, though surprises during the Q&A session are always possible.
EUR/USD
Support: 1.1200 (S1), 1.1160 (S2), 1.1110 (S3)
Resistance: 1.1300 (R1), 1.1370 (R2), 1.1430 (R3)
GBP/JPY
Support: 141.90 (S1), 140.70 (S2), 140.00 (S3)
Resistance: 143.00 (R1), 144.00 (R2), 145.45 (R3)
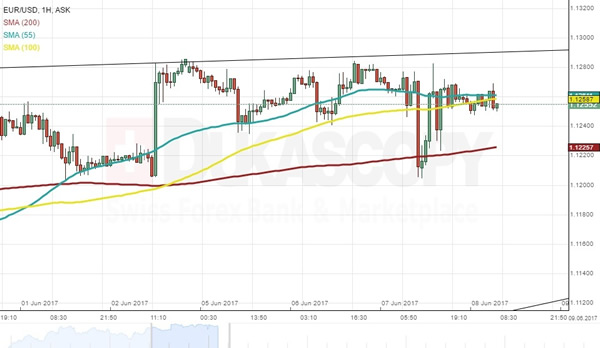
EURUSD Analysis: Dips During Wednesday’s Trading
Although on Thursday morning the common European currency traded against the US Dollar near the previous two trading session levels, which is above the 1.1250 mark, there is an additional detail to the rate. The currency exchange rate plummeted in the hour, which began at 10:00 GMT. The pair fell as low as the 1.12 level, and that event most likely triggered a lot of orders, as during the fall, which was clearly fundamental, the rate retreated below all this week's relevant levels of significance. However, by 14:00 GMT the Euro was back above 1.1250 mark against the US Dollar. It is most likely that the fundamentals will continue to dictate the pair's movements during the day, as the ECB is publishing their updated rate and hosting a press conference.
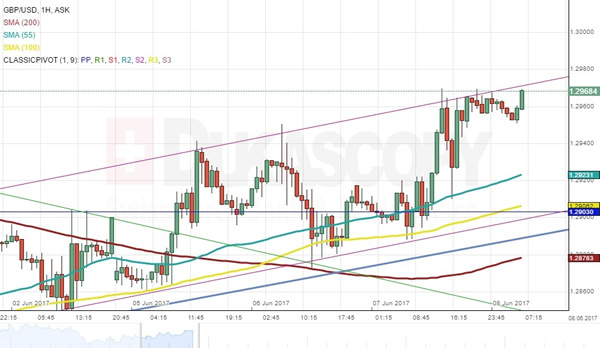
GBPUSD Analysis: Awaits Election Results
The British Pound continued to outperform the US Dollar on Wednesday, but with gains limited by the newly-formed ascending channel's resistance line. The channel supports the possibility of the Cable edging lower today, with both trend-lines near 1.29 likely to be retested. The bearish development was long expected, but technical indicators began showing rather strong bullish signals recently, suggesting the channel could be broken to the upside. A continued recovery could suggest the pair is on the path to the larger scale pattern's resistance line just under the 1.35 mark. However, the Sterling is first required to stabilise above 1.30, as supply around this area kept it away from posting more gains since October 2016.
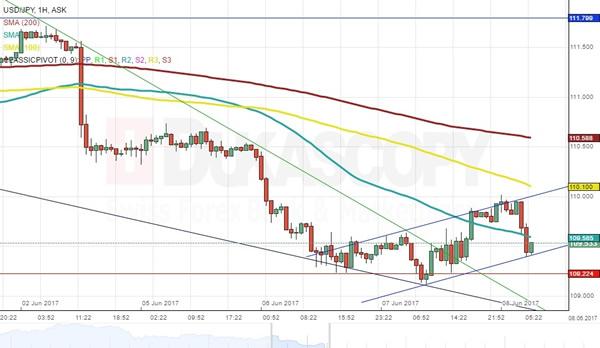
USD/JPY Analysis: Risks Falling Uder 109.00
As was anticipated, the US Dollar outperformed the Japanese Yen on Wednesday, with the exchange rate nearing the 110.00 mark. Another rally today would confirm the birth of a new ascending channel, but technical indicators imply the Greenback is to sustain heavy losses. The key support is still the monthly S1 at 109.22, which should be sufficient to limit the losses. In case this area fails, the next target would become the trend-line around 108.80. Nevertheless, due to the falling wedge getting pierced to the upside yesterday, a small possibility of the USD/JPY pair resuming its bullish trend exists. On the other hand, no other signs point to a potential recovery, thus, risks remain skewed to the downside.
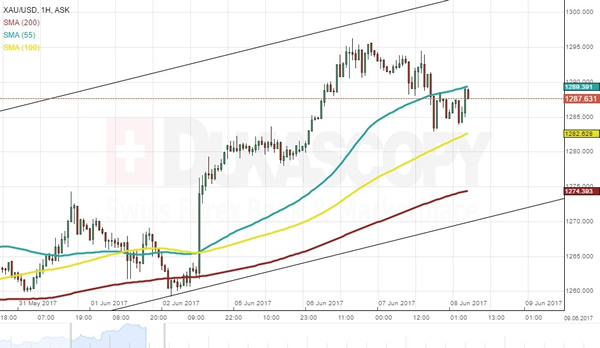
Gold Analysis: Declines On Thursday
The decline of the yellow metal's price has extended itself, as the bullion continue to search for a strong enough support level to continue the surge. On Thursday morning the commodity price still remained in the middle of the medium term ascending channel pattern. There the metal faced the resistance of the 55-hour SMA at the 1,289.49 mark, while, meanwhile, being supported by the weekly R1 at 1,286.87. It is highly possible that the bullion will remain below the 1,300 mark until additional support is found. The additional support could come in the form of the 100-hour SMA, which on Thursday morning was located at the 1,282.73 level. In addition, the just mentioned SMA was supported by the lower Bollinger band of the hourly chart.
Daily Technical Analysis: AUD/USD Slow Zig-Zag Towards 0.7580
As we could see on yesterday's Live Trading webinar, straight after our live trading session, the AUD/USD has rejected and made pips in the bearish direction. That was a counter trade opportunity we had, but today the AUD/USD might proceed with the trend. The POC zone is 0.7510-20 (D L4, ATR pivot, bullish order block, EMA89) and if we see a retracement, the pair might reject from the POC zone targeting H3 and H4 camarilla pivots. 1 hour candle close above 1.7568 might target 1.7586 and further 0.7617 on a stronger momentum push. Have in mind that the ATR (range) of the pair is small, only 57 pips so 0.7580 zone is looking more realistic should the bullish momentum prevail.
EUR/GBP Candlesticks and Ichimoku Analysis
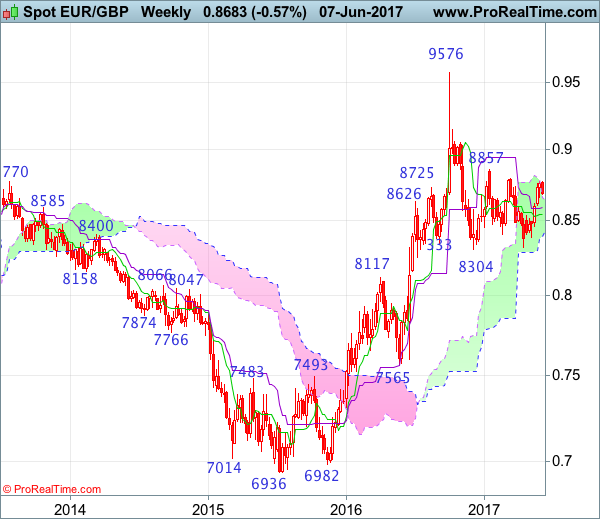
Weekly
• Last Candlesticks pattern: N/A
• ime of formation: N/A
• Trend bias: Near term up
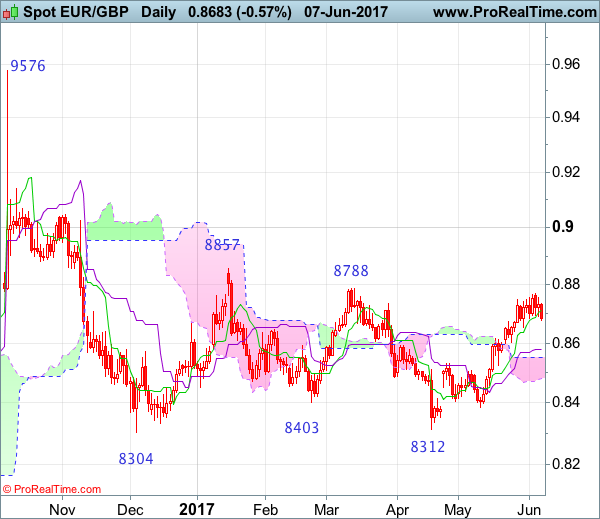
Daily
• Last Candlesticks pattern: Hammer
• Time of formation: 3 Feb 2016
• Trend bias: Up
EURGBP – 0.8677
Although the single currency rose to as high as 0.8771 earlier this week, the subsequent retreat suggests consolidation below this level would be seen and pullback to 0.8600-10 cannot be ruled out, however, reckon the Kijun-Sen (now at 0.8778) would limit downside and bring another rise later, above said resistance at 0.8771 would extend further gain to 0.8788 resistance, then 0.8850 but loss of upward momentum should prevent sharp move beyond 0.8900, risk from there is seen for another retreat later.
On the downside, whilst initial pullback to 0.8600-10 cannot be ruled out, reckon the Kijun-Sen (now at 0.8578) would limit downside and bring another rise later to aforesaid upside targets. Below the upper Kumo (now at 0.8550) would defer and risk weakness to 0.8524 support but only a daily close below there would signal top has been formed, bring retracement of recent upmove to 0.8500, then towards support at 0.8457. Looking ahead, a drop below this level would signal the rise from 0.8312 has ended, bring subsequent decline to 0.8400-10 and then test of indicated support at 0.8384.
Recommendation: Buy again at 0.8580 for 0.8730 with stop below 0.8500.
On the weekly chart, as the single currency has eased after meeting resistance at 0.8771, suggesting minor consolidation would be seen and pullback to 0.8600 cannot be ruled out, however, reckon downside would be limited to 0.8570-75 and bring another rise later, above 0.8771 would bring test of previous resistance at 0.8788 but only break there would retain bullishness and encourage for a test of previous chart resistance at 0.8857 which is likely to hold form here.
On the downside, although initial pullback to 0.8600-05 cannot be ruled out, reckon the Kijun-Sen (now at 0.8585) would limit downside and bring another rise later. A weekly close below the Tenkan-Sen (now at 0.8542) would defer and suggest top is possibly formed, risk weakness to 0.8495-00 but a drop below support at 0.8457 is needed to add credence to this view, bring further fall to 0.8400-10, however, only a break of said support at 0.8384 would suggest the rebound from 0.8312 has ended instead, extend weakness to 0.8350-55 and eventually retest of 0.8312.
GBPJPY Bearish in Descending Channel
GBPJPY is in a downtrend since the May 10 high of 148.09. Prices reached a low of 140.70 this week. The RSI is below 50 in bearish territory and has no clear direction, so the market does not look like it can push any higher in the near term. It has reached a critical level at the 50% Fibonacci of the uptrend from 135.58 to 148.09. There is now a consolidation phase around this level.
The market is below the tenkan-sen line and there was a bearish crossover of this line below the kijun-sen on May 29, which gave a bearish signal and is keeping the bias to the downside. A move lower would target 140.36, which is the 61.8 Fibonacci. Breaking below this support would strengthen the bearish bias and open the way for a deeper fall towards 138 before heading to the April 17 low at 135.58.
The medium-term bias remains bearish as long as the market is in a descending channel. A rise above the June 2 high of 143.93 is needed to shift momentum back to the upside to target resistance at the 23.6 Fibonacci at 145.14. A move above 147 would help bring a resumption of the April to May uptrend.